Australia Gluten Removed Products Market (2026-2032) | Outlook, Share, Size & Revenue, Value, Forecast, Analysis, Competitive Landscape, Industry, Companies, Growth, Segmentation, Trends
Market Forecast By Type (Bakery Products, Snacks & RTE Products, Condiments & Dressings, Pizzas & Pastas, Other Types), By Form (Solid, Liquid), By Source (Plant, Animal), By Distribution Channel (Conventional Stores, Specialty Stores, Drugstores & Pharmacies) And Competitive Landscape
| Product Code: ETC6181801 | Publication Date: Sep 2024 | Updated Date: Mar 2026 | Product Type: Market Research Report | |
| Publisher: 6Wresearch | Author: Shubham Deep | No. of Pages: 75 | No. of Figures: 35 | No. of Tables: 20 |
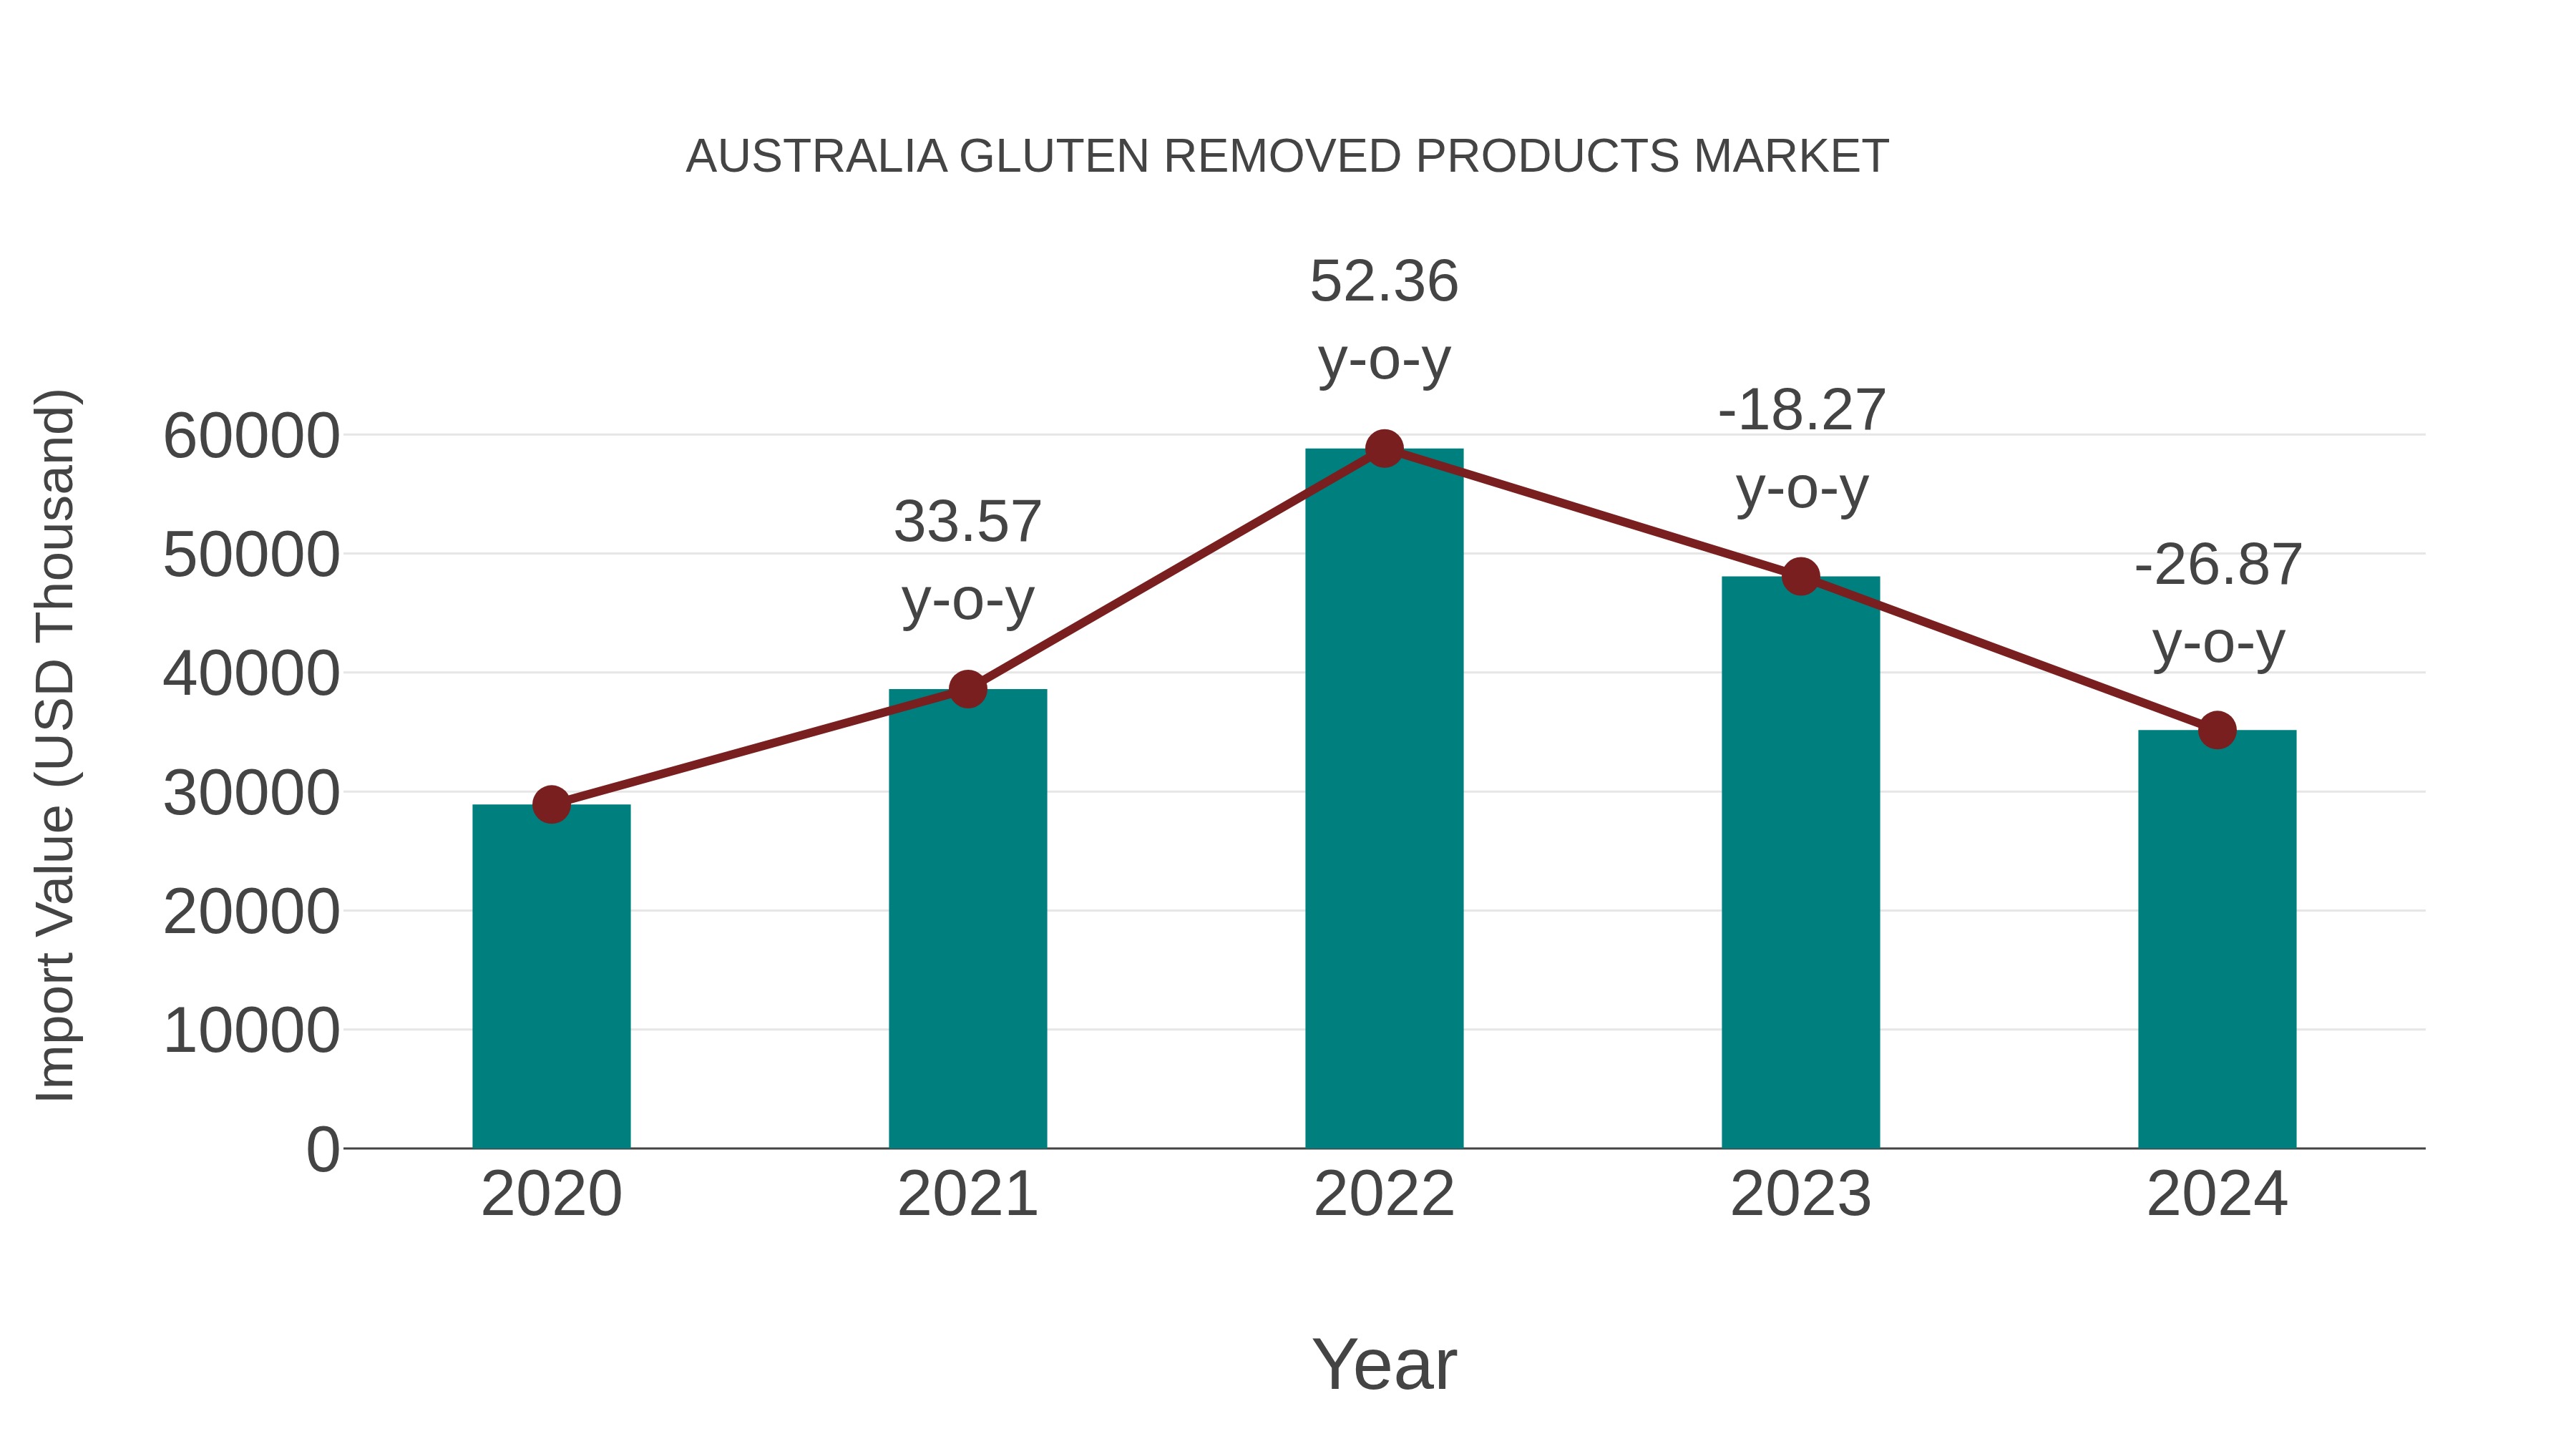
Australia Gluten Removed Products Market: Import Trend Analysis
In 2024, Australia`s import trend for gluten removed products experienced a decline, with a growth rate of -26.87% compared to the previous year. However, the compound annual growth rate (CAGR) for 2020-2024 stood at 5.02%. This decline in import momentum could be attributed to shifting consumer preferences or changes in trade policies impacting market stability.
Australia Gluten Removed Products Market Overview
Gluten removed products, which undergo processing to eliminate gluten from their ingredients, are gaining traction in Australia, particularly in beverages like gluten-removed beer. However, regulatory and labeling standards pose challenges, as these products may not be suitable for those with celiac disease, thereby limiting market trust and growth potential.
Trends of the market
Products labeled as "gluten-removed" are becoming increasingly popular among consumers with gluten sensitivity, but not necessarily those with celiac disease. These products, typically beers or fermented goods, appeal to consumers looking to reduce but not eliminate gluten. As awareness grows around gluten-removed production processes and labeling standards, this market is set to expand, though regulatory scrutiny and consumer education remain critical for sustained growth.
Challenges of the market
The gluten-removed products market in Australia is challenged by consumer confusion between gluten-free and gluten-removed labels. While gluten-free products are suitable for individuals with celiac disease, gluten-removed products may still contain trace amounts of gluten, posing a risk to sensitive consumers. Additionally, the market faces a lack of strong consumer education regarding the differences between these two types of products, leading to misperceptions about their safety and health benefits. The market is also limited by the relatively high cost of gluten-removed products and the challenge of ensuring the removal process meets strict regulatory standards to guarantee the products` safety.
Investment opportunities in the Market
As gluten intolerance and celiac disease become more recognized, there is growing interest in gluten-removed products. These products offer the appeal of traditional food but with lower gluten content, making them suitable for those who may not suffer from celiac disease but prefer to avoid gluten. Investors in this market can capitalize on the increasing demand for gluten-removed versions of everyday food items, such as bread, beer, and pasta. This presents an opportunity for new product lines that meet the needs of both health-conscious and convenience-seeking consumers, especially in the context of high-quality ingredients and taste retention.
Government Policy of the market
The market for gluten-removed products in Australia is subject to ongoing debates over the definitions and claims surrounding gluten removal versus gluten-free. FSANZ has specific regulations for products that are labeled as gluten-removed, which are distinct from those that are fully gluten-free. The Australian government emphasizes the importance of clear labeling to avoid consumer confusion. Products labeled as gluten-removed must meet certain criteria, with manufacturers required to provide evidence that the product`s gluten content is significantly reduced to be safe for most consumers with gluten intolerance, although not necessarily safe for those with celiac disease.
Key Highlights of the Report:
- Australia Gluten Removed Products Market Outlook
- Market Size of Australia Gluten Removed Products Market, 2025
- Forecast of Australia Gluten Removed Products Market, 2032
- Historical Data and Forecast of Australia Gluten Removed Products Revenues & Volume for the Period 2022 - 2032F
- Australia Gluten Removed Products Market Trend Evolution
- Australia Gluten Removed Products Market Drivers and Challenges
- Australia Gluten Removed Products Price Trends
- Australia Gluten Removed Products Porter's Five Forces
- Australia Gluten Removed Products Industry Life Cycle
- Historical Data and Forecast of Australia Gluten Removed Products Market Revenues & Volume By Type for the Period 2022 - 2032F
- Historical Data and Forecast of Australia Gluten Removed Products Market Revenues & Volume By Bakery Products for the Period 2022 - 2032F
- Historical Data and Forecast of Australia Gluten Removed Products Market Revenues & Volume By Snacks & RTE Products for the Period 2022 - 2032F
- Historical Data and Forecast of Australia Gluten Removed Products Market Revenues & Volume By Condiments & Dressings for the Period 2022 - 2032F
- Historical Data and Forecast of Australia Gluten Removed Products Market Revenues & Volume By Pizzas & Pastas for the Period 2022 - 2032F
- Historical Data and Forecast of Australia Gluten Removed Products Market Revenues & Volume By Other Types for the Period 2022 - 2032F
- Historical Data and Forecast of Australia Gluten Removed Products Market Revenues & Volume By Form for the Period 2022 - 2032F
- Historical Data and Forecast of Australia Gluten Removed Products Market Revenues & Volume By Solid for the Period 2022 - 2032F
- Historical Data and Forecast of Australia Gluten Removed Products Market Revenues & Volume By Liquid for the Period 2022 - 2032F
- Historical Data and Forecast of Australia Gluten Removed Products Market Revenues & Volume By Source for the Period 2022 - 2032F
- Historical Data and Forecast of Australia Gluten Removed Products Market Revenues & Volume By Plant for the Period 2022 - 2032F
- Historical Data and Forecast of Australia Gluten Removed Products Market Revenues & Volume By Animal for the Period 2022 - 2032F
- Historical Data and Forecast of Australia Gluten Removed Products Market Revenues & Volume By Distribution Channel for the Period 2022 - 2032F
- Historical Data and Forecast of Australia Gluten Removed Products Market Revenues & Volume By Conventional Stores for the Period 2022 - 2032F
- Historical Data and Forecast of Australia Gluten Removed Products Market Revenues & Volume By Specialty Stores for the Period 2022 - 2032F
- Historical Data and Forecast of Australia Gluten Removed Products Market Revenues & Volume By Drugstores & Pharmacies for the Period 2022 - 2032F
- Australia Gluten Removed Products Import Export Trade Statistics
- Market Opportunity Assessment By Type
- Market Opportunity Assessment By Form
- Market Opportunity Assessment By Source
- Market Opportunity Assessment By Distribution Channel
- Australia Gluten Removed Products Top Companies Market Share
- Australia Gluten Removed Products Competitive Benchmarking By Technical and Operational Parameters
- Australia Gluten Removed Products Company Profiles
- Australia Gluten Removed Products Key Strategic Recommendations
Australia Gluten Removed Products Market (2026-2032): FAQs
6Wresearch actively monitors the Australia Gluten Removed Products Market and publishes its comprehensive annual report, highlighting emerging trends, growth drivers, revenue analysis, and forecast outlook. Our insights help businesses to make data-backed strategic decisions with ongoing market dynamics. Our analysts track relevent industries related to the Australia Gluten Removed Products Market, allowing our clients with actionable intelligence and reliable forecasts tailored to emerging regional needs.
Yes, we provide customisation as per your requirements. To learn more, feel free to contact us on sales@6wresearch.com
1 Executive Summary |
2 Introduction |
2.1 Key Highlights of the Report |
2.2 Report Description |
2.3 Market Scope & Segmentation |
2.4 Research Methodology |
2.5 Assumptions |
3 Australia Gluten Removed Products Market Overview |
3.1 Australia Country Macro Economic Indicators |
3.2 Australia Gluten Removed Products Market Revenues & Volume, 2022 & 2032F |
3.3 Australia Gluten Removed Products Market - Industry Life Cycle |
3.4 Australia Gluten Removed Products Market - Porter's Five Forces |
3.5 Australia Gluten Removed Products Market Revenues & Volume Share, By Type, 2022 & 2032F |
3.6 Australia Gluten Removed Products Market Revenues & Volume Share, By Form, 2022 & 2032F |
3.7 Australia Gluten Removed Products Market Revenues & Volume Share, By Source, 2022 & 2032F |
3.8 Australia Gluten Removed Products Market Revenues & Volume Share, By Distribution Channel, 2022 & 2032F |
4 Australia Gluten Removed Products Market Dynamics |
4.1 Impact Analysis |
4.2 Market Drivers |
4.2.1 Increasing awareness about gluten intolerance and celiac disease among consumers |
4.2.2 Growing health consciousness leading to demand for gluten-free alternatives |
4.2.3 Rise in disposable income enabling consumers to opt for premium gluten removed products |
4.3 Market Restraints |
4.3.1 Higher cost of gluten removed products compared to conventional products |
4.3.2 Limited availability and accessibility of gluten removed products in certain regions |
4.3.3 Perception of gluten removed products as less tasty or inferior in quality by some consumers |
5 Australia Gluten Removed Products Market Trends |
6 Australia Gluten Removed Products Market, By Types |
6.1 Australia Gluten Removed Products Market, By Type |
6.1.1 Overview and Analysis |
6.1.2 Australia Gluten Removed Products Market Revenues & Volume, By Type, 2022 - 2032F |
6.1.3 Australia Gluten Removed Products Market Revenues & Volume, By Bakery Products, 2022 - 2032F |
6.1.4 Australia Gluten Removed Products Market Revenues & Volume, By Snacks & RTE Products, 2022 - 2032F |
6.1.5 Australia Gluten Removed Products Market Revenues & Volume, By Condiments & Dressings, 2022 - 2032F |
6.1.6 Australia Gluten Removed Products Market Revenues & Volume, By Pizzas & Pastas, 2022 - 2032F |
6.1.7 Australia Gluten Removed Products Market Revenues & Volume, By Other Types, 2022 - 2032F |
6.2 Australia Gluten Removed Products Market, By Form |
6.2.1 Overview and Analysis |
6.2.2 Australia Gluten Removed Products Market Revenues & Volume, By Solid, 2022 - 2032F |
6.2.3 Australia Gluten Removed Products Market Revenues & Volume, By Liquid, 2022 - 2032F |
6.3 Australia Gluten Removed Products Market, By Source |
6.3.1 Overview and Analysis |
6.3.2 Australia Gluten Removed Products Market Revenues & Volume, By Plant, 2022 - 2032F |
6.3.3 Australia Gluten Removed Products Market Revenues & Volume, By Animal, 2022 - 2032F |
6.4 Australia Gluten Removed Products Market, By Distribution Channel |
6.4.1 Overview and Analysis |
6.4.2 Australia Gluten Removed Products Market Revenues & Volume, By Conventional Stores, 2022 - 2032F |
6.4.3 Australia Gluten Removed Products Market Revenues & Volume, By Specialty Stores, 2022 - 2032F |
6.4.4 Australia Gluten Removed Products Market Revenues & Volume, By Drugstores & Pharmacies, 2022 - 2032F |
7 Australia Gluten Removed Products Market Import-Export Trade Statistics |
7.1 Australia Gluten Removed Products Market Export to Major Countries |
7.2 Australia Gluten Removed Products Market Imports from Major Countries |
8 Australia Gluten Removed Products Market Key Performance Indicators |
8.1 Percentage increase in the number of gluten-free product launches in the market |
8.2 Growth in the number of consumers opting for gluten removed products |
8.3 Number of new entrants or expansions in the gluten removed products market |
9 Australia Gluten Removed Products Market - Opportunity Assessment |
9.1 Australia Gluten Removed Products Market Opportunity Assessment, By Type, 2022 & 2032F |
9.2 Australia Gluten Removed Products Market Opportunity Assessment, By Form, 2022 & 2032F |
9.3 Australia Gluten Removed Products Market Opportunity Assessment, By Source, 2022 & 2032F |
9.4 Australia Gluten Removed Products Market Opportunity Assessment, By Distribution Channel, 2022 & 2032F |
10 Australia Gluten Removed Products Market - Competitive Landscape |
10.1 Australia Gluten Removed Products Market Revenue Share, By Companies, 2025 |
10.2 Australia Gluten Removed Products Market Competitive Benchmarking, By Operating and Technical Parameters |
11 Company Profiles |
12 Recommendations |
13 Disclaimer |
Global Go To Market Strategy - 2030
Export potential enables firms to identify high-growth global markets with greater confidence by combining advanced trade intelligence with a structured quantitative methodology. The framework analyzes emerging demand trends and country-level import patterns while integrating macroeconomic and trade datasets such as GDP and population forecasts, bilateral import–export flows, tariff structures, elasticity differentials between developed and developing economies, geographic distance, and import demand projections. Using weighted trade values from 2020–2024 as the base period to project country-to-country export potential for 2030, these inputs are operationalized through calculated drivers such as gravity model parameters, tariff impact factors, and projected GDP per-capita growth. Through an analysis of hidden potentials, demand hotspots, and market conditions that are most favorable to success, this method enables firms to focus on target countries, maximize returns, and global expansion with data, backed by accuracy.
By factoring in the projected importer demand gap that is currently unmet and could be potential opportunity, it identifies the potential for the Exporter (Country) among 190 countries, against the general trade analysis, which identifies the biggest importer or exporter.
To discover high-growth global markets and optimize your business strategy:
Click Here
Pricing
- Single User License$ 1,995
- Department License$ 2,400
- Site License$ 3,120
- Global License$ 3,795

Leadership Perspectives from Industry Events
Search
Thought Leadership and Analyst Meet


Our Clients
6WResearch In News
- India Export Attractiveness Tracker 2026
- India Air Conditioner Market Set for Strong Rebound in 2026 After Weather-Led Correction and GST-Driven Recovery: 6Wresearch
- ADAS in India: How Automatic Emergency Braking, Blind Spot Detection & Driver Monitoring are Transforming Road Safety
- Doha a strategic location for EV manufacturing hub: IPA Qatar
- Demand for luxury TVs surging in the GCC, says Samsung
- Empowering Growth: The Thriving Journey of Bangladesh’s Cable Industry
Latest Reports
- Nicaragua RPG Gaming Market (2026-2032)
- New Zealand RPG Gaming Market (2026-2032)
- Netherlands RPG Gaming Market (2026-2032)
- Nauru RPG Gaming Market (2026-2032)
- Namibia RPG Gaming Market (2026-2032)
- Mozambique RPG Gaming Market (2026-2032)
- Montenegro RPG Gaming Market (2026-2032)
- Mongolia RPG Gaming Market (2026-2032)
- Monaco RPG Gaming Market (2026-2032)
- Micronesia RPG Gaming Market (2026-2032)
Industry Events and Analyst Meet

EV India Expo 2026

HIMTEX 2026

India Refining Summit 2026

India EV Show 2026

EV tech India Expo 2026
Whitepaper
- Middle East & Africa Commercial Security Market Click here to view more.
- Middle East & Africa Fire Safety Systems & Equipment Market Click here to view more.
- GCC Drone Market Click here to view more.
- Middle East Lighting Fixture Market Click here to view more.
- GCC Physical & Perimeter Security Market Click here to view more.