Australia Inorganic salts Market (2026-2032) Outlook | Size, Revenue, Growth, Companies, Analysis, Value, Share, Industry, Forecast & Trends
Market Forecast By Application (Chemicals, Food Industry, Pharmaceuticals and Personal Care, Agriculture, Others) And Competitive Landscape
| Product Code: ETC415051 | Publication Date: Oct 2022 | Updated Date: Jul 2026 | Product Type: Market Research Report | |
| Publisher: 6Wresearch | Author: Shubham Padhi | No. of Pages: 75 | No. of Figures: 35 | No. of Tables: 20 |
Australia Inorganic salts Market Size, Share & Growth Rate
The Australia Inorganic salts Market was estimated at USD 226 Million in 2025 and is projected to reach USD 265 Million by 2032, growing at a CAGR of 2.3% from 2026 to 2032. This growth trajectory is largely driven by the increasing demand for high-purity inorganic salts in industries such as food processing, agriculture, and pharmaceuticals. The expanding food processing sector, coupled with the rising focus on trace minerals and electrolytes, reinforces the need for specialty salts that cater to specific industrial requirements.
Australia Inorganic salts Market Year-wise Growth Rate and Key Drivers
This graph highlights how the Australia Inorganic salts Market has steadily grown over the years, supported by major growth factors.
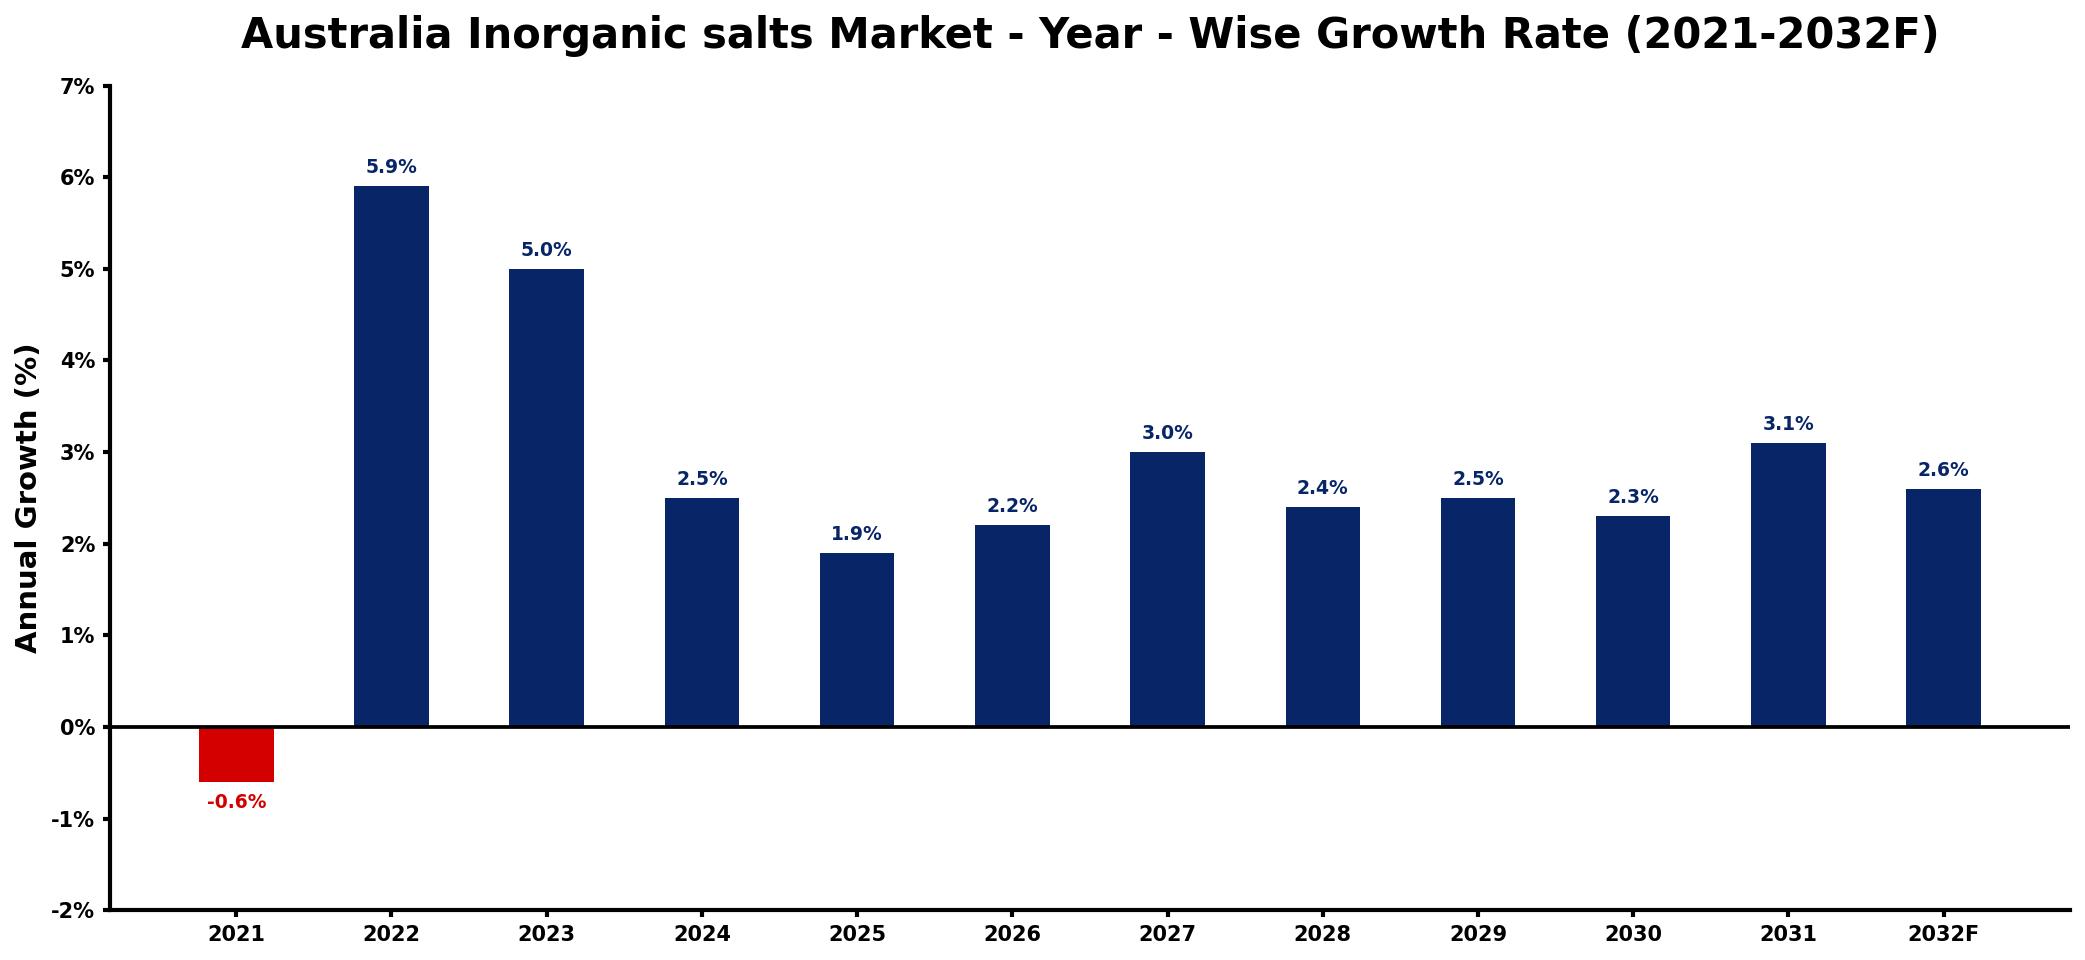
The table below presents the year‑wise growth rates along with the key drivers influencing the market
| Year | Growth Rate | Major Drivers |
| 2021 | -0.6% | Decreased industrial manufacturing activities |
| 2022 | 5.9% | Rising demand from agricultural sector |
| 2023 | 5.0% | Expansion of chemical processing industry |
| 2024 | 2.5% | Increased investment in mining sector |
| 2025 | 1.9% | Growth in water treatment applications |
| 2026 | 2.2% | Surge in pharmaceutical production needs |
| 2027 | 3.0% | Enhanced infrastructure development projects |
| 2028 | 2.4% | Growing demand for food additives |
| 2029 | 2.5% | Strengthened environmental regulations enforcement |
| 2030 | 2.3% | Rising consumer awareness on sustainability |
| 2031 | 3.1% | Advancements in research and development |
| 2032 | 2.6% | Increased global trade activities |
Note: Market size estimations and growth projections presented in this report are based on 6Wresearch's proprietary forecasting methodology, utilizing the latest available industry data, government publications, and primary research inputs.
Australia Inorganic salts Market Synopsis
A significant force shaping the Australia Inorganic salts Market is the surging demand for these materials as additives and catalysts across various sectors. Their versatility in applications, from food preservation to agricultural fertilizers, highlights their vital role in enhancing product quality and efficiency.
Additionally, the market is bolstered by ongoing advancements in manufacturing processes that enhance product purity and functionality. As businesses seek competitive advantages through innovation, the inorganic salts market is likely to witness increased investments geared towards the development of high-performance materials.
Australia Inorganic salts Market Key Takeaways
- The market is projected to reach USD 265 Million by 2032, demonstrating consistent growth.
- Food processing and pharmaceuticals are key sectors driving demand for high-purity inorganic salts.
- Innovation in specialty salts is crucial for addressing specific industry needs.
- Environmental regulations are influencing sustainable production practices in the salt industry.
- Growing awareness of trace minerals is shaping product development and market dynamics.
Evaluation of Restraints in Australia Inorganic salts Market
Despite the promising growth trajectory, the Australia Inorganic salts Market is constrained by challenges related to product purity and quality consistency. As regulations governing the purity and handling of these salts become more stringent, manufacturers face increasing pressure to meet high standards while managing production costs. Additionally, competition from alternative substances and the need for sustainable practices add layers of complexity to the market landscape. These factors may limit growth potential and necessitate strategic adjustments by industry participants to maintain their competitive edge.
Australia Inorganic salts Market Trends
Current trends in the Australia Inorganic salts Market include a heightened focus on product innovation to meet the specific needs of various applications. Manufacturers are increasingly developing specialty salts with enhanced functionalities, which are becoming essential for sectors such as pharmaceuticals and agriculture. Furthermore, sustainability is becoming a priority, with companies exploring eco-friendly production methods and alternatives to traditional inorganic salts to reduce their environmental footprint.
Australia Inorganic salts Market Opportunities
Opportunities for growth in the Australia Inorganic salts Market lie primarily in the expansion of the food processing and pharmaceutical sectors, which are expected to continue their upward trajectory. Investment in research and development of innovative inorganic salts that offer improved performance will be key to capturing market share. Additionally, the focus on sustainable practices presents avenues for companies to differentiate themselves through environmentally friendly offerings, appealing to increasingly eco-conscious consumers.
Government Initiatives in the Australia Inorganic salts Market
Government initiatives are pivotal in shaping the Australia Inorganic salts Market. Policies that emphasize product safety and environmental impact are critical, as regulators seek to ensure that inorganic salts adhere to quality standards. Additionally, public funding and support for research into sustainable extraction and production methods are likely to promote innovation. By fostering collaboration between industry and academia, the government can facilitate advancements that reduce the environmental footprint of salt production while ensuring the availability of high-quality products.
Future Insights of the Australia Inorganic salts Market
Looking ahead to the period from 2026 to 2032, the Australia Inorganic salts Market is set to navigate a path of steady growth, driven by ongoing innovations in product development and processing technologies. The rising demand for high-purity salts, combined with evolving regulatory frameworks, will compel manufacturers to adapt and optimize their operations. Furthermore, as sustainability continues to gain traction, the focus on environmentally responsible practices will further influence market dynamics, shaping the future of inorganic salts in Australia.
Australia Inorganic salts Market Latest Developments (2025 - 2026)
Recent developments in the Australia Inorganic salts Market have showcased a trend towards enhanced collaboration between manufacturers and research institutions to develop innovative products. Companies are investing in new processing technologies that emphasize purity and sustainability. Regulatory changes aimed at tightening environmental standards are also influencing operational strategies among key market players, ensuring compliance while promoting eco-friendly production methodologies.
Australia Inorganic salts Market - Key Attractiveness of the Report
- 10 Years of Market Numbers
- Historical Data Starting from 2022 to 2025
- Base Year: 2025
- Forecast Data until 2032
- Key Performance Indicators Impacting the Market
- Major Upcoming Developments and Projects
Key Highlights of the Report:
- Australia Inorganic salts Market Outlook
- Market Size of Australia Inorganic salts Market, 2025
- Forecast of Australia Inorganic salts Market, 2032
- Historical Data and Forecast of Australia Inorganic salts Revenues & Volume for the Period 2022-2032F
- Australia Inorganic salts Market Trend Evolution
- Australia Inorganic salts Market Drivers and Challenges
- Australia Inorganic salts Price Trends
- Australia Inorganic salts Porter's Five Forces
- Australia Inorganic salts Industry Life Cycle
- Historical Data and Forecast of Australia Inorganic salts Market Revenues & Volume By Application for the Period 2022-2032F
- Historical Data and Forecast of Australia Inorganic salts Market Revenues & Volume By Chemicals for the Period 2022-2032F
- Historical Data and Forecast of Australia Inorganic salts Market Revenues & Volume By Food Industry for the Period 2022-2032F
- Historical Data and Forecast of Australia Inorganic salts Market Revenues & Volume By Pharmaceuticals and Personal Care for the Period 2022-2032F
- Historical Data and Forecast of Australia Inorganic salts Market Revenues & Volume By Agriculture for the Period 2022-2032F
- Historical Data and Forecast of Australia Inorganic salts Market Revenues & Volume By Others for the Period 2022-2032F
- Australia Inorganic salts Import Export Trade Statistics
- Market Opportunity Assessment By Application
- Australia Inorganic salts Top Companies Market Share
- Australia Inorganic salts Competitive Benchmarking By Technical and Operational Parameters
- Australia Inorganic salts Company Profiles
- Australia Inorganic salts Key Strategic Recommendations
Frequently Asked Questions About the Market Study (FAQs):
The primary drivers include the expanding food processing and pharmaceutical sectors, which necessitate high-purity inorganic salts for various applications. Furthermore, a growing awareness of the health benefits associated with trace minerals and electrolytes contributes significantly to market demand.
The market was estimated at USD 226 Million in 2025 and is projected to reach USD 265 Million by 2032, reflecting a CAGR of 2.3% from 2026 to 2032.
Manufacturers encounter challenges related to maintaining product purity and consistency while adhering to stringent quality standards. Additionally, competition from alternative materials and rising sustainability concerns add complexity to their operational strategies.
Emerging trends include a focus on specialty salts that offer enhanced functionalities, as well as a growing emphasis on sustainable production practices, as manufacturers seek to minimize their environmental impact.
Significant growth opportunities lie in the food processing and pharmaceutical sectors, as well as in the development of sustainable and innovative inorganic salt products that meet specific industry requirements.
6Wresearch actively monitors the Australia Inorganic salts Market and publishes its comprehensive annual report, highlighting emerging trends, growth drivers, revenue analysis, and forecast outlook. Our insights help businesses to make data-backed strategic decisions with ongoing market dynamics. Our analysts track relevent industries related to the Australia Inorganic salts Market, allowing our clients with actionable intelligence and reliable forecasts tailored to emerging regional needs.
Yes, we provide customisation as per your requirements. To learn more, feel free to contact us on sales@6wresearch.com
1 Executive Summary |
2 Introduction |
2.1 Key Highlights of the Report |
2.2 Report Description |
2.3 Market Scope & Segmentation |
2.4 Research Methodology |
2.5 Assumptions |
3 Australia Inorganic salts Market Overview |
3.1 Australia Country Macro Economic Indicators |
3.2 Australia Inorganic salts Market Revenues & Volume, 2022 & 2032F |
3.3 Australia Inorganic salts Market - Industry Life Cycle |
3.4 Australia Inorganic salts Market - Porter's Five Forces |
3.5 Australia Inorganic salts Market Revenues & Volume Share, By Application, 2022 & 2032F |
4 Australia Inorganic salts Market Dynamics |
4.1 Impact Analysis |
4.2 Market Drivers |
4.2.1 Increasing demand from industries such as agriculture, food beverage, and chemicals |
4.2.2 Growth in population leading to higher consumption of inorganic salts |
4.2.3 Technological advancements in production processes leading to cost efficiency and product innovation |
4.3 Market Restraints |
4.3.1 Fluctuating raw material prices impacting production costs |
4.3.2 Environmental concerns and regulations regarding the use and disposal of inorganic salts |
4.3.3 Competition from substitute products in certain applications |
5 Australia Inorganic salts Market Trends |
6 Australia Inorganic salts Market, By Types |
6.1 Australia Inorganic salts Market, By Application |
6.1.1 Overview and Analysis |
6.1.2 Australia Inorganic salts Market Revenues & Volume, By Application, 2022-2032F |
6.1.3 Australia Inorganic salts Market Revenues & Volume, By Chemicals, 2022-2032F |
6.1.4 Australia Inorganic salts Market Revenues & Volume, By Food Industry, 2022-2032F |
6.1.5 Australia Inorganic salts Market Revenues & Volume, By Pharmaceuticals and Personal Care, 2022-2032F |
6.1.6 Australia Inorganic salts Market Revenues & Volume, By Agriculture, 2022-2032F |
6.1.7 Australia Inorganic salts Market Revenues & Volume, By Others, 2022-2032F |
7 Australia Inorganic salts Market Import-Export Trade Statistics |
7.1 Australia Inorganic salts Market Export to Major Countries |
7.2 Australia Inorganic salts Market Imports from Major Countries |
8 Australia Inorganic salts Market Key Performance Indicators |
8.1 Research and development investment in developing new inorganic salt products |
8.2 Adoption rate of sustainable production practices in the inorganic salts industry |
8.3 Number of strategic partnerships and collaborations for market expansion |
8.4 Investment in infrastructure for distribution and storage facilities |
8.5 Percentage of market share held by key players in the inorganic salts market |
9 Australia Inorganic salts Market - Opportunity Assessment |
9.1 Australia Inorganic salts Market Opportunity Assessment, By Application, 2022 & 2032F |
10 Australia Inorganic salts Market - Competitive Landscape |
10.1 Australia Inorganic salts Market Revenue Share, By Companies, 2025 |
10.2 Australia Inorganic salts Market Competitive Benchmarking, By Operating and Technical Parameters |
11 Company Profiles |
12 Recommendations |
13 Disclaimer |
Global Go To Market Strategy - 2030
Export potential enables firms to identify high-growth global markets with greater confidence by combining advanced trade intelligence with a structured quantitative methodology. The framework analyzes emerging demand trends and country-level import patterns while integrating macroeconomic and trade datasets such as GDP and population forecasts, bilateral import–export flows, tariff structures, elasticity differentials between developed and developing economies, geographic distance, and import demand projections. Using weighted trade values from 2020–2024 as the base period to project country-to-country export potential for 2030, these inputs are operationalized through calculated drivers such as gravity model parameters, tariff impact factors, and projected GDP per-capita growth. Through an analysis of hidden potentials, demand hotspots, and market conditions that are most favorable to success, this method enables firms to focus on target countries, maximize returns, and global expansion with data, backed by accuracy.
By factoring in the projected importer demand gap that is currently unmet and could be potential opportunity, it identifies the potential for the Exporter (Country) among 190 countries, against the general trade analysis, which identifies the biggest importer or exporter.
To discover high-growth global markets and optimize your business strategy:
Click Here
Pricing
- Single User License$ 1,995
- Department License$ 2,400
- Site License$ 3,120
- Global License$ 3,795

Leadership Perspectives from Industry Events
Search
Thought Leadership and Analyst Meet


Our Clients
6WResearch In News
- India Air Conditioner Market Set for Strong Rebound in 2026 After Weather-Led Correction and GST-Driven Recovery: 6Wresearch
- ADAS in India: How Automatic Emergency Braking, Blind Spot Detection & Driver Monitoring are Transforming Road Safety
- Doha a strategic location for EV manufacturing hub: IPA Qatar
- Demand for luxury TVs surging in the GCC, says Samsung
- Empowering Growth: The Thriving Journey of Bangladesh’s Cable Industry
- Demand for luxury TVs surging in the GCC, says Samsung
Latest Reports
- Nicaragua RPG Gaming Market (2026-2032)
- New Zealand RPG Gaming Market (2026-2032)
- Netherlands RPG Gaming Market (2026-2032)
- Nauru RPG Gaming Market (2026-2032)
- Namibia RPG Gaming Market (2026-2032)
- Mozambique RPG Gaming Market (2026-2032)
- Montenegro RPG Gaming Market (2026-2032)
- Mongolia RPG Gaming Market (2026-2032)
- Monaco RPG Gaming Market (2026-2032)
- Micronesia RPG Gaming Market (2026-2032)
Industry Events and Analyst Meet

EV India Expo 2026

HIMTEX 2026

India Refining Summit 2026

India EV Show 2026

EV tech India Expo 2026
Whitepaper
- Middle East & Africa Commercial Security Market Click here to view more.
- Middle East & Africa Fire Safety Systems & Equipment Market Click here to view more.
- GCC Drone Market Click here to view more.
- Middle East Lighting Fixture Market Click here to view more.
- GCC Physical & Perimeter Security Market Click here to view more.