Australia Marine and Dock Gangways Market (2026-2032) Outlook | Analysis, Forecast, Size, Trends, Share, Companies, Value, Industry, Revenue, Growth
Market Forecast By Structure Type (Truss, Beam), By Material (Composite/Wood, Aluminium, Steel and Metal Alloys, Others), By Application (Vessel, Barges, Port/Harbor, Offshore refineries/exploration plants, Others) And Competitive Landscape
| Product Code: ETC099054 | Publication Date: Jun 2021 | Updated Date: Jun 2026 | Product Type: Report | |
| Publisher: 6Wresearch | Author: Ravi Bhandari | No. of Pages: 70 | No. of Figures: 35 | No. of Tables: 5 |
Australia Marine and Dock Gangways Market Size, Share & Growth Rate
The Australia Marine and Dock Gangways Market was estimated at USD 85 Million in 2025 and is projected to reach USD 99 Million by 2032, growing at a CAGR of 2.2% from 2026 to 2032. This growth trajectory is propelled by the increasing investments in maritime tourism and waterfront infrastructure. Additionally, heightened emphasis on safety and regulatory compliance continues to drive the demand for advanced gangway solutions across the country.
Australia Marine and Dock Gangways Market Year-wise Growth Rate and Key Drivers
This graph highlights how the Australia Marine and Dock Gangways Market has steadily grown over the years, supported by major growth factors.
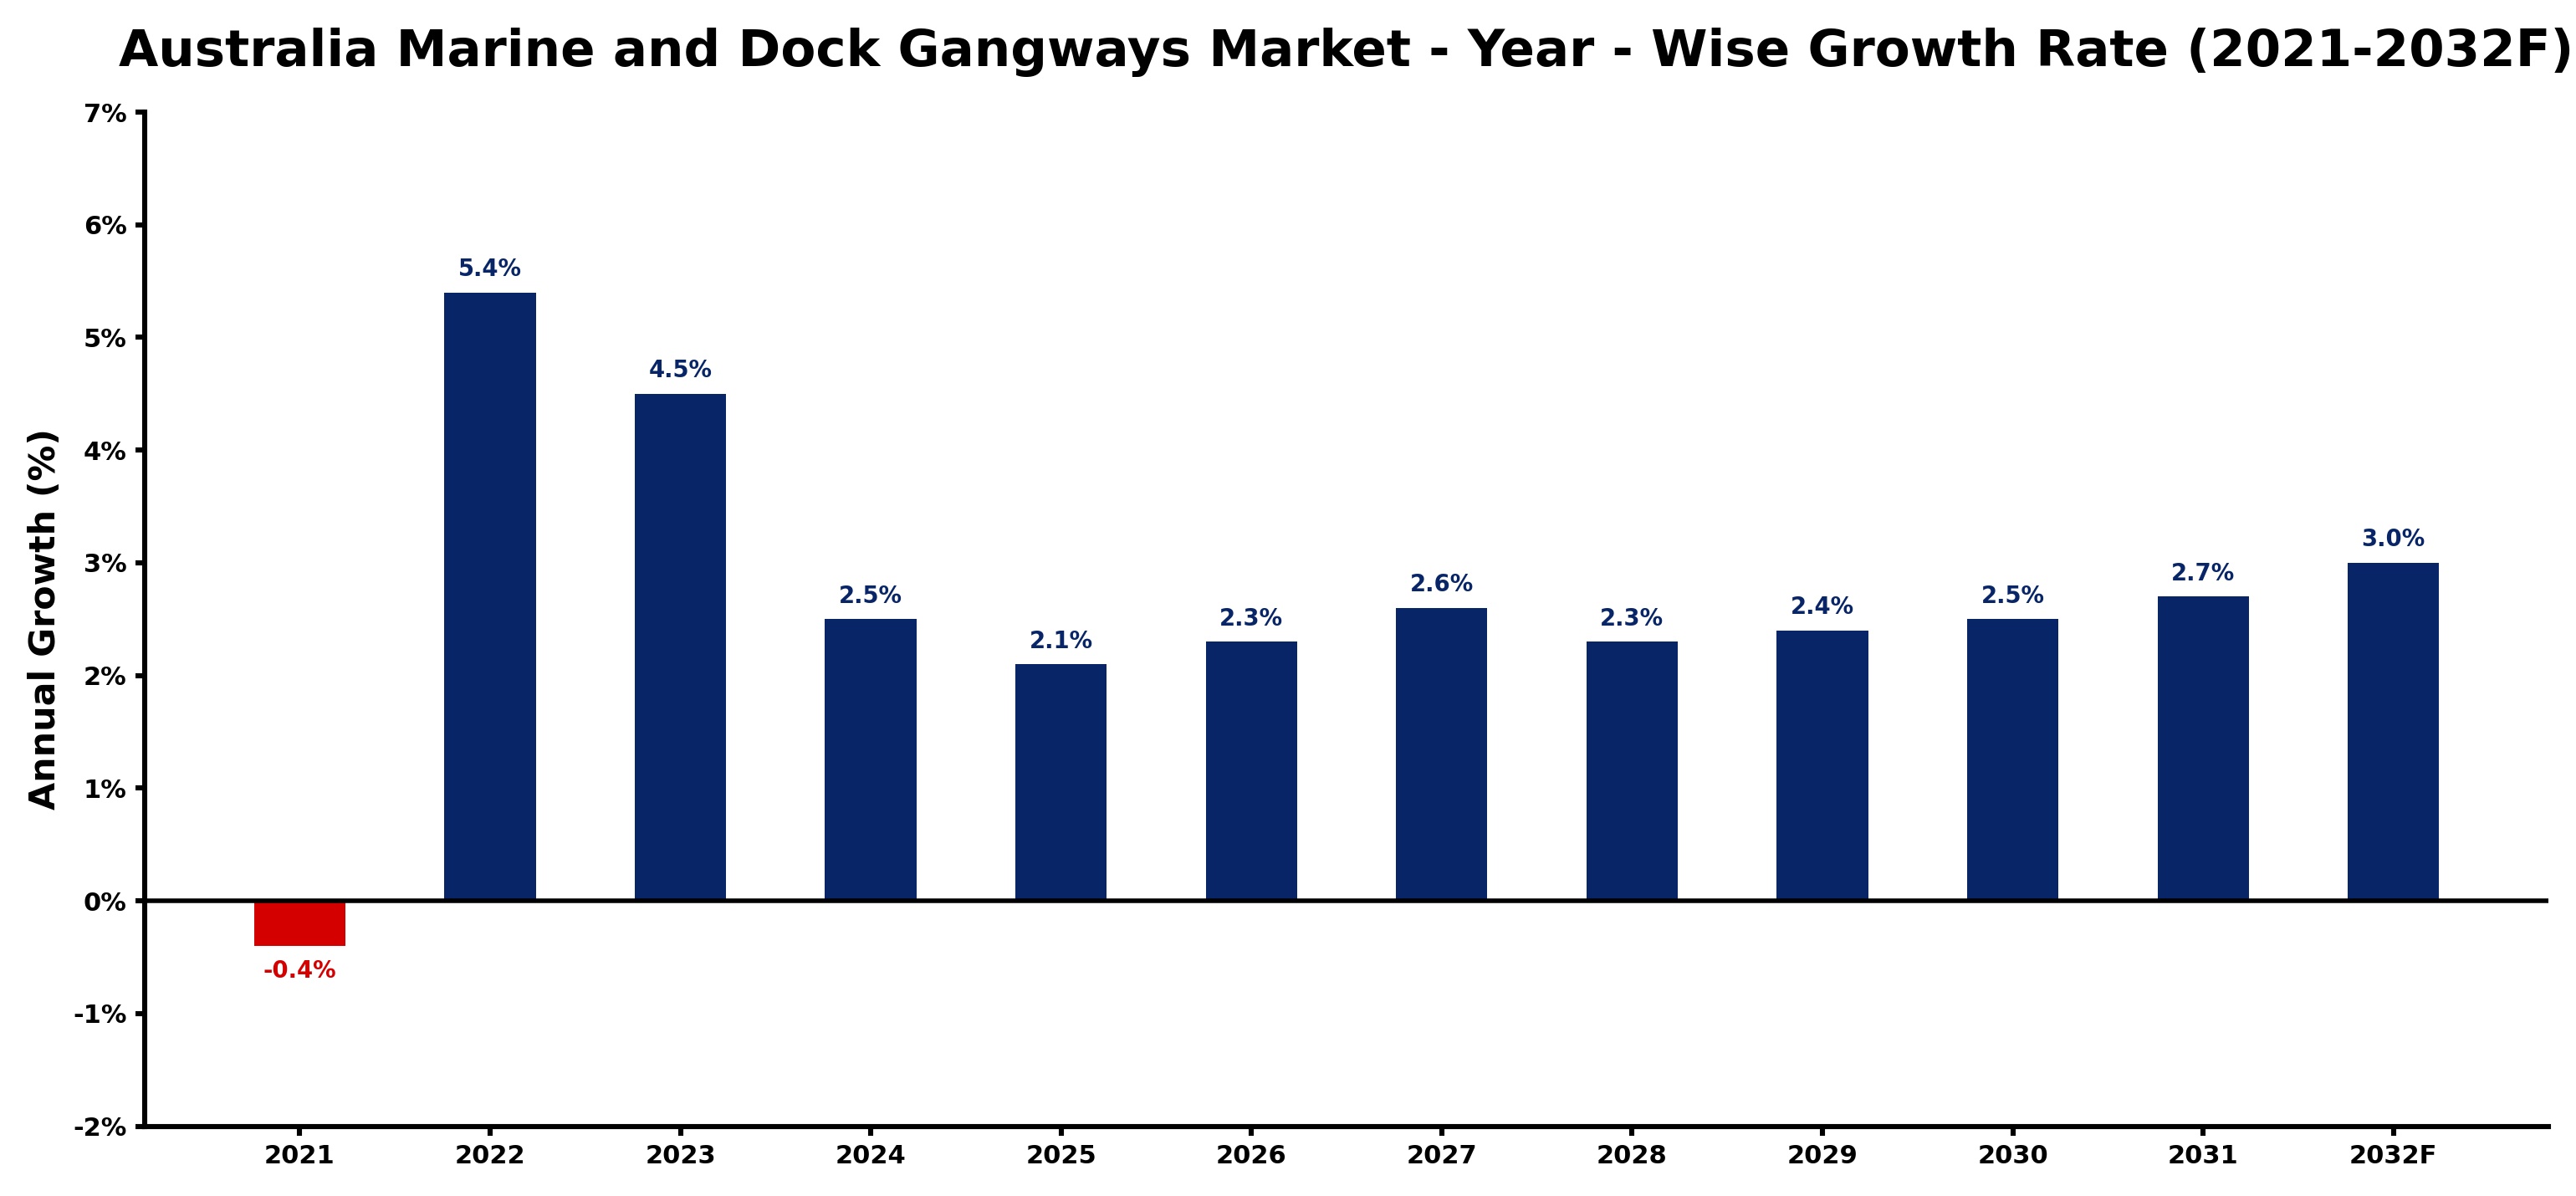
The table below presents the year‑wise growth rates along with the key drivers influencing the market
| Year | Growth Rate | Major Drivers |
| 2021 | -0.4% | Lower mining sector investments weakened marine and dock gangway orders |
| 2022 | 5.4% | Mining sector infrastructure projects boost dock gangway manufacturing demand |
| 2023 | 4.5% | Increased mining infrastructure investments boost demand for gangway systems |
| 2024 | 2.5% | Advanced manufacturing techniques enhanced marine gangway production efficiency |
| 2025 | 2.1% | Accelerated dock upgrades enhance efficiency for mining sector operations |
| 2026 | 2.3% | Mining sector upgrades boost dock gangway manufacturing investments |
| 2027 | 2.6% | Mining sector maintenance schedules boost demand for dock gangways |
| 2028 | 2.3% | Export driven infrastructure projects boost marine gangway production demand |
| 2029 | 2.4% | Mining sector maintenance drives demand for marine gangway systems |
| 2030 | 2.5% | Increased mining infrastructure projects drive dock gangway manufacturing demand |
| 2031 | 2.7% | Marine infrastructure upgrades boost demand for advanced dock solutions |
| 2032 | 3.0% | Export driven advanced manufacturing boosts demand for specialized dock solutions |
Note - Market size estimations and growth projections presented in this report are based on 6Wresearch’s advanced forecasting approach, validated with industry datasets as of June 2026.
Australia Marine and Dock Gangways Market Synopsis
Recent growth in the Australia Marine and Dock Gangways Market has been marked by increased port activities and a surge in recreational boating. As the market evolves, it is poised for a steady expansion driven by infrastructural developments and rising safety standards. Future prospects remain bright as technological innovations in gangway design enhance user accessibility and operational efficiency.
Currently, Australia’s marine sector is undergoing significant changes, aiming to better accommodate the evolving needs of maritime tourism and cargo transport. As more people engage in recreational boating and the demand for safe access solutions intensifies, the market is expected to flourish in alignment with broader economic trends in the maritime industry.
Australia Marine and Dock Gangways Market Key Takeaways
- The market is forecasted to experience a steady growth rate of 2.2% CAGR from 2026 to 2032.
- Investment in waterfront infrastructure and tourism continues to fuel market dynamics.
- Safety and compliance with maritime regulations are critical drivers influencing design and manufacturing.
- The trend toward recreational boating and yacht charters enhances demand for reliable gangway solutions.
- Technological innovations are paving the way for more efficient, accessible, and durable gangway systems.
Evaluation of Restraints in Australia Marine and Dock Gangways Market
Despite the optimistic growth outlook, the Australia Marine and Dock Gangways Market faces certain restraints. The intricacies of designing and manufacturing gangways that comply with stringent safety and environmental regulations can pose significant challenges. Companies must continually innovate to produce lightweight and durable materials that meet evolving customer requirements while ensuring operational efficiency. Balancing these factors while adhering to regulatory standards may limit some players in the market.
Australia Marine and Dock Gangways Market Trends
Emerging trends are significantly shaping the Australia Marine and Dock Gangways Market. Increasingly, companies are focusing on the development of modular and adjustable gangway designs to enhance functionality and ease of use. Furthermore, the integration of smart technology and automated features into gangway systems is becoming commonplace, providing real-time monitoring and improved safety measures. Moreover, eco-friendly materials and sustainable manufacturing processes are gaining traction as companies align with global sustainability goals.
Australia Marine and Dock Gangways Market Opportunities
The market presents numerous growth and investment opportunities, particularly in regions where maritime tourism is burgeoning. As ports and marinas expand to cater to larger vessels and an increasing number of tourists, the demand for innovative gangway solutions will undoubtedly rise. Furthermore, there is a clear opportunity for companies to diversify their offerings by incorporating advanced materials and technologies that enhance the user experience while adhering to safety regulations.
Government Initiatives in the Australia Marine and Dock Gangways Market
Government policies play a vital role in the Australia Marine and Dock Gangways Market. Regulatory bodies, including the Australian Maritime Safety Authority (AMSA) and various state/territory maritime authorities, establish guidelines to ensure the safe design, construction, and installation of gangways. These policies emphasize accessibility, particularly for individuals with disabilities, and promote initiatives that foster operational efficiency and safety within port facilities and marinas.
Future Insights of the Australia Marine and Dock Gangways Market
Looking ahead to 2026-2032, the Australia Marine and Dock Gangways Market is set for a period of moderate growth, driven by ongoing investments in maritime infrastructure and an increasing emphasis on safety and accessibility. The incorporation of advanced technologies and sustainable practices will likely become industry standard as demand for improved solutions heightens. As maritime tourism continues to expand, stakeholders in the market are encouraged to adapt and innovate to meet the evolving needs of the sector.
Australia Marine and Dock Gangways Market Latest Developments (May 2025 - June 2026)
In recent months, the industry has witnessed notable developments focused on enhancing gangway design and functionality. Innovations are increasingly integrating smart technologies to improve safety and user experience in ports and marinas. Additionally, there is a growing emphasis on eco-friendly materials and sustainable practices, positioning companies to meet both market demands and regulatory standards as they prepare for future growth.
Australia Marine and Dock Gangways Market - Key Attractiveness of the Report
- 10 Years of Market Numbers
- Historical Data Starting from 2022 to 2025
- Base Year: 2025
- Forecast Data until 2032
- Key Performance Indicators Impacting the Market
- Major Upcoming Developments and Projects
Key Highlights of the Report:
- Australia Marine and Dock Gangways Market Outlook
- Market Size of Australia Marine and Dock Gangways Market, 2025
- Forecast of Australia Marine and Dock Gangways Market, 2032
- Historical Data and Forecast of Australia Marine and Dock Gangways Revenues & Volume for the Period 2022-2032F
- Australia Marine and Dock Gangways Market Trend Evolution
- Australia Marine and Dock Gangways Market Drivers and Challenges
- Australia Marine and Dock Gangways Price Trends
- Australia Marine and Dock Gangways Porter's Five Forces
- Australia Marine and Dock Gangways Industry Life Cycle
- Historical Data and Forecast of Australia Marine and Dock Gangways Market Revenues & Volume By Structure Type for the Period 2022-2032F
- Historical Data and Forecast of Australia Marine and Dock Gangways Market Revenues & Volume By Truss for the Period 2022-2032F
- Historical Data and Forecast of Australia Marine and Dock Gangways Market Revenues & Volume By Beam for the Period 2022-2032F
- Historical Data and Forecast of Australia Marine and Dock Gangways Market Revenues & Volume By Material for the Period 2022-2032F
- Historical Data and Forecast of Australia Marine and Dock Gangways Market Revenues & Volume By Composite/Wood for the Period 2022-2032F
- Historical Data and Forecast of Australia Marine and Dock Gangways Market Revenues & Volume By Aluminium for the Period 2022-2032F
- Historical Data and Forecast of Australia Marine and Dock Gangways Market Revenues & Volume By Steel and Metal Alloys for the Period 2022-2032F
- Historical Data and Forecast of Australia Marine and Dock Gangways Market Revenues & Volume By Others for the Period 2022-2032F
- Historical Data and Forecast of Australia Marine and Dock Gangways Market Revenues & Volume By Application for the Period 2022-2032F
- Historical Data and Forecast of Australia Marine and Dock Gangways Market Revenues & Volume By Vessel for the Period 2022-2032F
- Historical Data and Forecast of Australia Marine and Dock Gangways Market Revenues & Volume By Barges for the Period 2022-2032F
- Historical Data and Forecast of Australia Marine and Dock Gangways Market Revenues & Volume By Port/Harbor for the Period 2022-2032F
- Historical Data and Forecast of Australia Marine and Dock Gangways Market Revenues & Volume By Offshore refineries/exploration plants for the Period 2022-2032F
- Historical Data and Forecast of Australia Marine and Dock Gangways Market Revenues & Volume By Others for the Period 2022-2032F
- Australia Marine and Dock Gangways Import Export Trade Statistics
- Market Opportunity Assessment By Structure Type
- Market Opportunity Assessment By Material
- Market Opportunity Assessment By Application
- Australia Marine and Dock Gangways Top Companies Market Share
- Australia Marine and Dock Gangways Competitive Benchmarking By Technical and Operational Parameters
- Australia Marine and Dock Gangways Company Profiles
- Australia Marine and Dock Gangways Key Strategic Recommendations
Australia Marine and Dock Gangways Market - Frequently Asked Questions
The main growth drivers include the expansion of the maritime tourism industry, increased investments in waterfront infrastructure, and rising demand for safe and accessible marine access solutions.
The Australia Marine and Dock Gangways Market was estimated at USD 85 Million in 2025 and is projected to reach USD 99 Million by 2032, growing at a CAGR of 2.2% from 2026 to 2032, indicating steady growth.
The design and installation of marine and dock gangways are heavily influenced by regulations set forth by the Australian Maritime Safety Authority and state maritime authorities, which focus on safety, accessibility, and compliance.
Yes, emerging trends include the incorporation of smart technology for safety monitoring, modular designs for flexibility, and a focus on sustainable materials in manufacturing.
The rising trend of recreational boating and yacht charters significantly enhances the demand for reliable and safe gangway solutions, particularly in ports and marinas catering to leisure activities.
6Wresearch actively monitors the Australia Marine and Dock Gangways Market and publishes its comprehensive annual report, highlighting emerging trends, growth drivers, revenue analysis, and forecast outlook. Our insights help businesses to make data-backed strategic decisions with ongoing market dynamics. Our analysts track relevent industries related to the Australia Marine and Dock Gangways Market, allowing our clients with actionable intelligence and reliable forecasts tailored to emerging regional needs.
Yes, we provide customisation as per your requirements. To learn more, feel free to contact us on sales@6wresearch.com
1 Executive Summary |
2 Introduction |
2.1 Key Highlights of the Report |
2.2 Report Description |
2.3 Market Scope & Segmentation |
2.4 Research Methodology |
2.5 Assumptions |
3 Australia Marine and Dock Gangways Market Overview |
3.1 Australia Country Macro Economic Indicators |
3.2 Australia Marine and Dock Gangways Market Revenues & Volume, 2022 & 2032F |
3.3 Australia Marine and Dock Gangways Market - Industry Life Cycle |
3.4 Australia Marine and Dock Gangways Market - Porter's Five Forces |
3.5 Australia Marine and Dock Gangways Market Revenues & Volume Share, By Structure Type, 2022 & 2032F |
3.6 Australia Marine and Dock Gangways Market Revenues & Volume Share, By Material, 2022 & 2032F |
3.7 Australia Marine and Dock Gangways Market Revenues & Volume Share, By Form, 2022 & 2032F |
4 Australia Marine and Dock Gangways Market Dynamics |
4.1 Impact Analysis |
4.2 Market Drivers |
4.2.1 Growth in the marine industry in Australia |
4.2.2 Increasing demand for cruise tourism |
4.2.3 Focus on enhancing safety and efficiency at ports and marinas |
4.3 Market Restraints |
4.3.1 High initial investment costs for installing gangways |
4.3.2 Environmental regulations impacting the design and materials used for gangways |
4.3.3 Economic downturn affecting spending on marine infrastructure projects |
5 Australia Marine and Dock Gangways Market Trends |
6 Australia Marine and Dock Gangways Market, By Types |
6.1 Australia Marine and Dock Gangways Market, By Structure Type |
6.1.1 Overview and Analysis |
6.1.2 Australia Marine and Dock Gangways Market Revenues & Volume, By Structure Type, 2022-2032F |
6.1.3 Australia Marine and Dock Gangways Market Revenues & Volume, By Truss, 2022-2032F |
6.1.4 Australia Marine and Dock Gangways Market Revenues & Volume, By Beam, 2022-2032F |
6.2 Australia Marine and Dock Gangways Market, By Material |
6.2.1 Overview and Analysis |
6.2.2 Australia Marine and Dock Gangways Market Revenues & Volume, By Composite/Wood, 2022-2032F |
6.2.3 Australia Marine and Dock Gangways Market Revenues & Volume, By Aluminium, 2022-2032F |
6.2.4 Australia Marine and Dock Gangways Market Revenues & Volume, By Steel and Metal Alloys, 2022-2032F |
6.2.5 Australia Marine and Dock Gangways Market Revenues & Volume, By Others, 2022-2032F |
6.3 Australia Marine and Dock Gangways Market, By Application |
6.3.1 Overview and Analysis |
6.3.2 Australia Marine and Dock Gangways Market Revenues & Volume, By Vessel, 2022-2032F |
6.3.3 Australia Marine and Dock Gangways Market Revenues & Volume, By Barges, 2022-2032F |
6.3.4 Australia Marine and Dock Gangways Market Revenues & Volume, By Port/Harbor, 2022-2032F |
6.3.5 Australia Marine and Dock Gangways Market Revenues & Volume, By Offshore refineries/exploration plants, 2022-2032F |
6.3.6 Australia Marine and Dock Gangways Market Revenues & Volume, By Others, 2022-2032F |
7 Australia Marine and Dock Gangways Market Import-Export Trade Statistics |
7.1 Australia Marine and Dock Gangways Market Export to Major Countries |
7.2 Australia Marine and Dock Gangways Market Imports from Major Countries |
8 Australia Marine and Dock Gangways Market Key Performance Indicators |
8.1 Number of new marine infrastructure projects initiated |
8.2 Average waiting time for ships at ports/marinas |
8.3 Percentage of ports/marinas compliant with safety standards |
8.4 Average utilization rate of existing gangway installations |
8.5 Number of cruise ship arrivals in Australia |
9 Australia Marine and Dock Gangways Market - Opportunity Assessment |
9.1 Australia Marine and Dock Gangways Market Opportunity Assessment, By Structure Type, 2022 & 2032F |
9.2 Australia Marine and Dock Gangways Market Opportunity Assessment, By Material, 2022 & 2032F |
9.3 Australia Marine and Dock Gangways Market Opportunity Assessment, By Application, 2022 & 2032F |
10 Australia Marine and Dock Gangways Market - Competitive Landscape |
10.1 Australia Marine and Dock Gangways Market Revenue Share, By Companies, 2025 |
10.2 Australia Marine and Dock Gangways Market Competitive Benchmarking, By Operating and Technical Parameters |
11 Company Profiles |
12 Recommendations |
13 Disclaimer |
Global Go To Market Strategy - 2030
Export potential enables firms to identify high-growth global markets with greater confidence by combining advanced trade intelligence with a structured quantitative methodology. The framework analyzes emerging demand trends and country-level import patterns while integrating macroeconomic and trade datasets such as GDP and population forecasts, bilateral import–export flows, tariff structures, elasticity differentials between developed and developing economies, geographic distance, and import demand projections. Using weighted trade values from 2020–2024 as the base period to project country-to-country export potential for 2030, these inputs are operationalized through calculated drivers such as gravity model parameters, tariff impact factors, and projected GDP per-capita growth. Through an analysis of hidden potentials, demand hotspots, and market conditions that are most favorable to success, this method enables firms to focus on target countries, maximize returns, and global expansion with data, backed by accuracy.
By factoring in the projected importer demand gap that is currently unmet and could be potential opportunity, it identifies the potential for the Exporter (Country) among 190 countries, against the general trade analysis, which identifies the biggest importer or exporter.
To discover high-growth global markets and optimize your business strategy:
Click Here
Pricing
- Single User License$ 1,995
- Department License$ 2,400
- Site License$ 3,120
- Global License$ 3,795

Leadership Perspectives from Industry Events
Search
Thought Leadership and Analyst Meet


Our Clients
6WResearch In News
- India Air Conditioner Market Set for Strong Rebound in 2026 After Weather-Led Correction and GST-Driven Recovery: 6Wresearch
- ADAS in India: How Automatic Emergency Braking, Blind Spot Detection & Driver Monitoring are Transforming Road Safety
- Doha a strategic location for EV manufacturing hub: IPA Qatar
- Demand for luxury TVs surging in the GCC, says Samsung
- Empowering Growth: The Thriving Journey of Bangladesh’s Cable Industry
- Demand for luxury TVs surging in the GCC, says Samsung
Latest Reports
- Nicaragua RPG Gaming Market (2026-2032)
- New Zealand RPG Gaming Market (2026-2032)
- Netherlands RPG Gaming Market (2026-2032)
- Nauru RPG Gaming Market (2026-2032)
- Namibia RPG Gaming Market (2026-2032)
- Mozambique RPG Gaming Market (2026-2032)
- Montenegro RPG Gaming Market (2026-2032)
- Mongolia RPG Gaming Market (2026-2032)
- Monaco RPG Gaming Market (2026-2032)
- Micronesia RPG Gaming Market (2026-2032)
Industry Events and Analyst Meet

EV India Expo 2026

HIMTEX 2026

India Refining Summit 2026

India EV Show 2026

EV tech India Expo 2026
Whitepaper
- Middle East & Africa Commercial Security Market Click here to view more.
- Middle East & Africa Fire Safety Systems & Equipment Market Click here to view more.
- GCC Drone Market Click here to view more.
- Middle East Lighting Fixture Market Click here to view more.
- GCC Physical & Perimeter Security Market Click here to view more.