Australia Micro-Irrigation Systems Market (2026-2032) | Analysis, Value, Companies, Forecast, Growth, Share, Outlook, Industry, Trends, Revenue & Size
Market Forecast By Mechanism (Drip Irrigation System, Sprinkler Irrigation System, Other), By Components (Drip Irrigation Components, Sprinkler Irrigation Components), By Cultivation Technology, By Application (Field Crops, Orchards and Vineyards, Vegetables, Plantation Crops, Other) And Competitive Landscape
| Product Code: ETC046035 | Publication Date: Jan 2021 | Updated Date: Jun 2026 | Product Type: Report | |
| Publisher: 6Wresearch | Author: Ravi Bhandari | No. of Pages: 70 | No. of Figures: 35 | No. of Tables: 5 |
Australia Micro-Irrigation Systems Market Summary
The australia micro-irrigation systems market was estimated at USD 213 Million in 2025 and is projected to reach USD 250 Million by 2032, growing at a CAGR of 2.5% from 2026 to 2032.
Australia Micro-Irrigation Systems Market Growth Rate Analysis (2021-2032)
The Australia micro-irrigation systems market experienced a significant rebound from a slight decline of 0.6% in 2021, driven by a growing emphasis on water conservation and efficient agricultural practices. This momentum continued into 2022 with a robust growth of 5.4%, fueled by rising consumer demand for sustainable farming technology and supportive government policies promoting eco-friendly practices. Although growth moderated to 4.8% in 2023, optimism persisted as investments in infrastructure and digitalization enhanced system efficiencies. Projections indicate continued growth, with moderate increases expected through 2032, reflecting a resilient agricultural sector adapting to climate challenges and advancing technologies that optimize resource usage.
Australia Micro-Irrigation Systems Market Year-wise Growth Rate and Key Drivers
This graph highlights how the Australia Micro-Irrigation Systems Market has steadily grown over the past five years, supported by major growth factors.
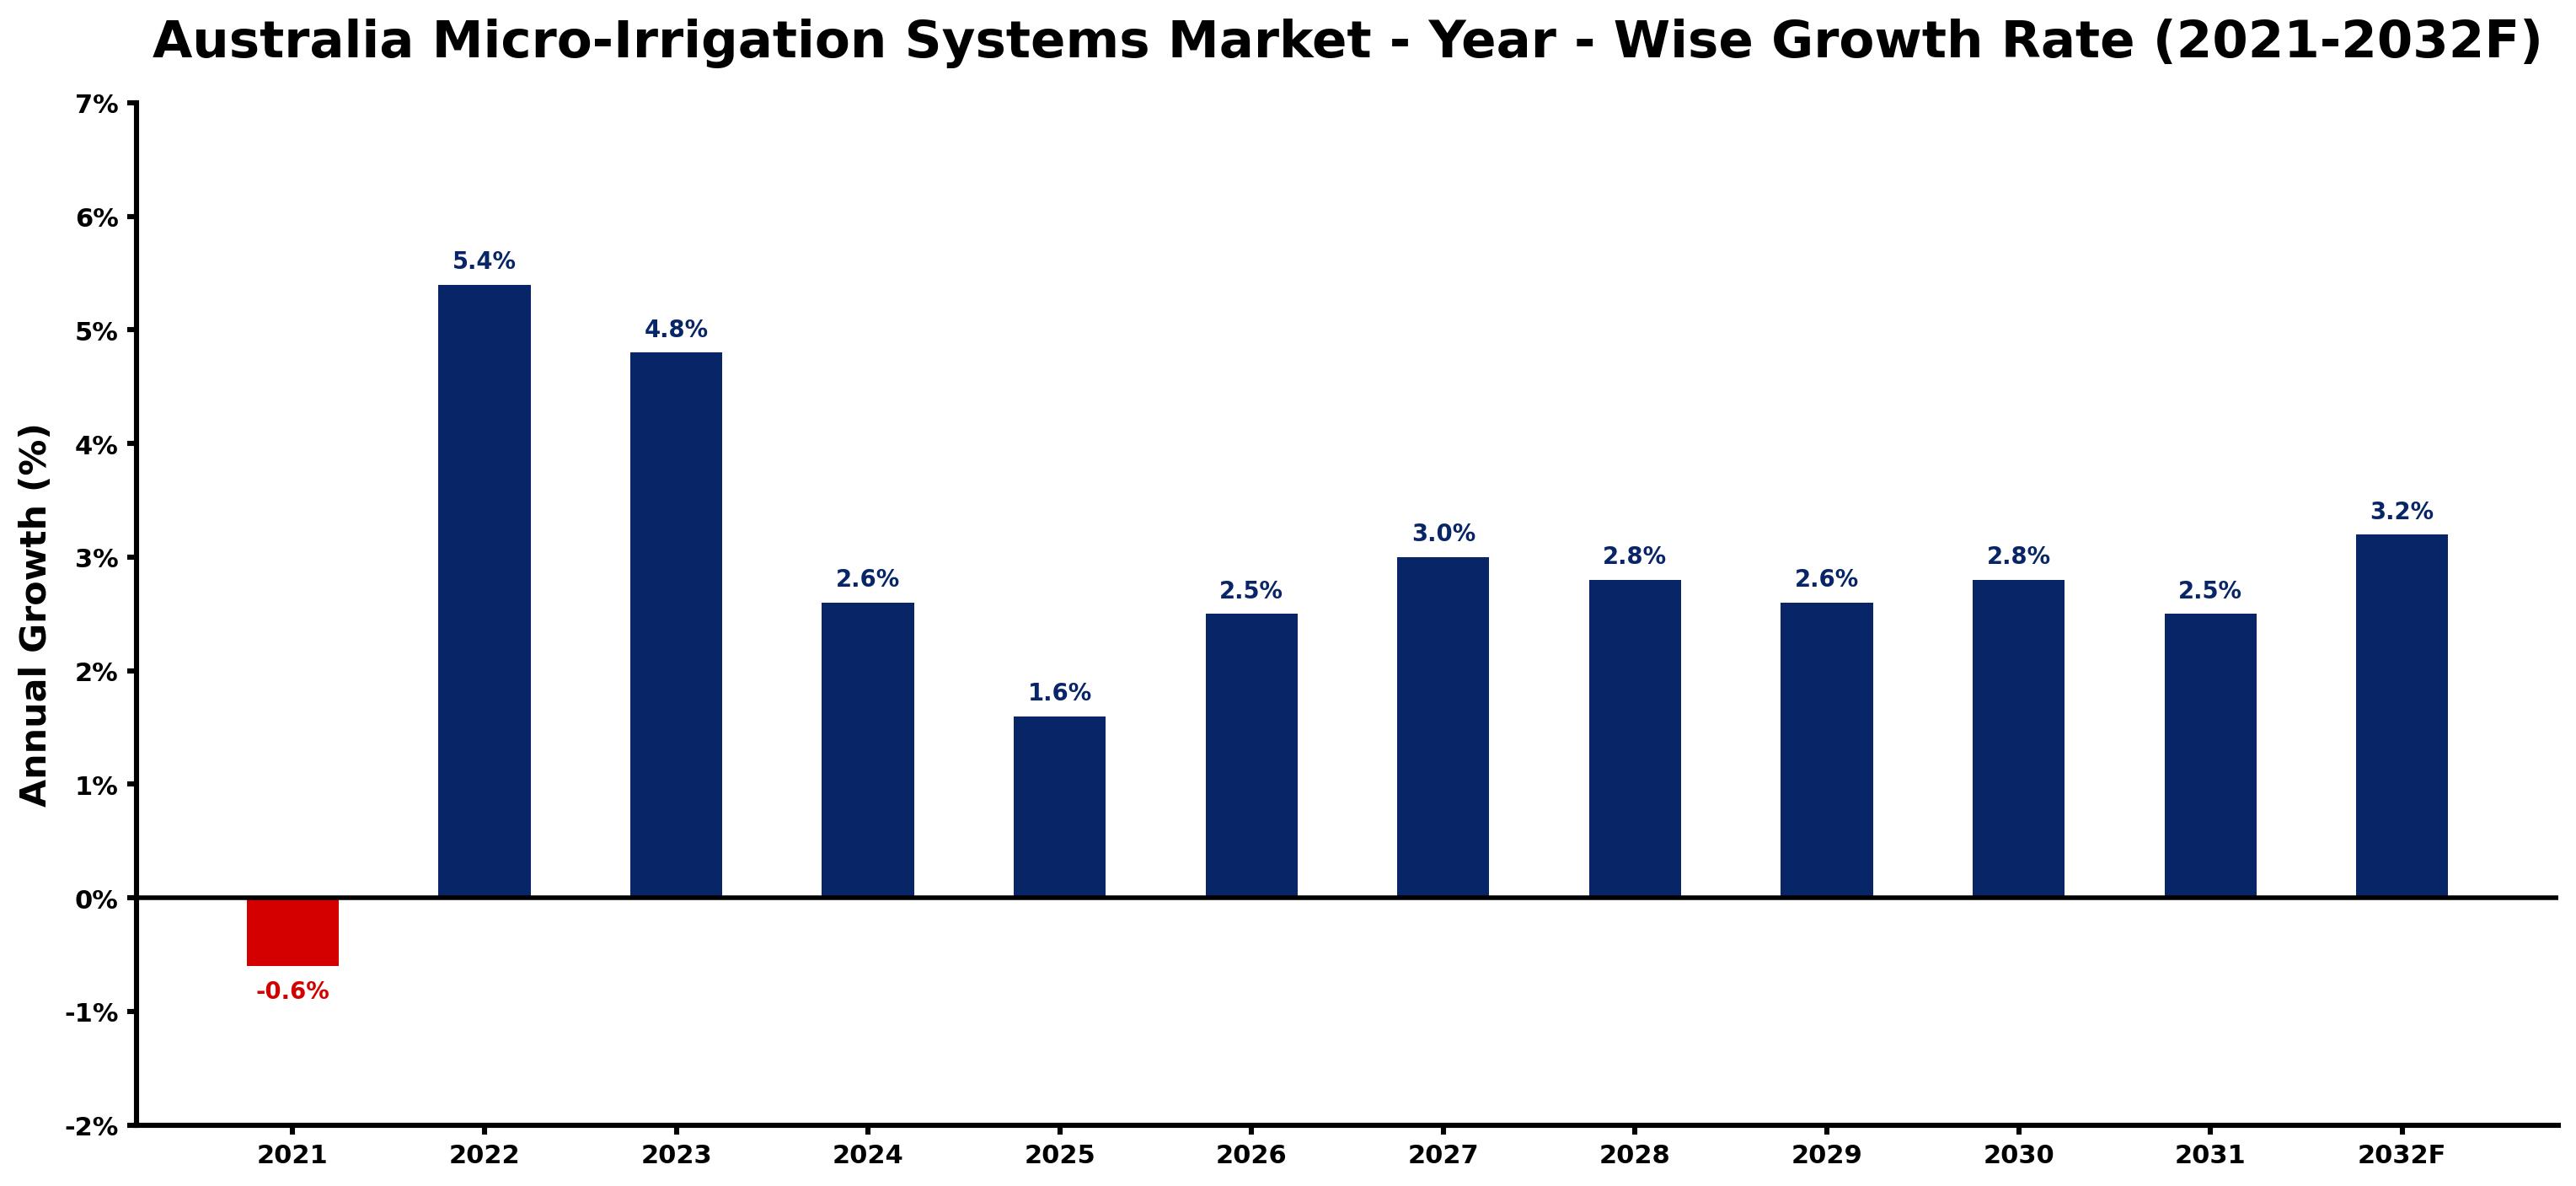
The table below presents the year wise growth rates along with the key drivers influencing the market
| Year | Growth Rate | Major Drivers |
| 2021 | -0.6% | Adverse weather conditions diminished agricultural activity, leading to decreased investment in microirrigation systems. |
| 2022 | 5.4% | Climate change awareness significantly altered irrigation practices across various agricultural sectors. |
| 2023 | 4.8% | Technological innovations improved system efficiency, appealing to cost-conscious farmers significantly. |
| 2024 | 2.6% | Research highlighted soil conservation benefits from micro-irrigation, attracting eco-focused growers. |
| 2025 | 1.6% | Rural investments in technology proliferated, enhancing local farming operations and competitiveness. |
| 2026 | 2.5% | Integration with smart farming technologies offered real-time monitoring and better resource management. |
| 2027 | 3.0% | Increased crop yields reported by users reaffirmed the economic benefits of micro-irrigation systems. |
| 2028 | 2.8% | Partnerships between agricultural tech firms and farmers facilitated widespread system access. |
| 2029 | 2.6% | Urban farming trends prompted interest in micro-irrigation for sustainable urban agriculture. |
| 2030 | 2.8% | Data analytics advancements provided farmers with insights on optimizing water usage effectively. |
| 2031 | 2.5% | Consumer demand for sustainable produce increased, pushing more farmers to adopt modern systems. |
| 2032 | 3.2% | Global supply chain improvements ensured more affordable access to advanced micro-irrigation technology. |
Note - Market size estimations and growth projections presented in this report are based on 6Wresearch's advanced forecasting approach, validated with industry datasets as of June 2026.
Australia Micro-Irrigation Systems Market Synopsis
The Australia Micro-Irrigation Systems Market is projected to reach 2.5% and witness significant growth during the forecast period (2026-2032). Micro irrigation systems are essential for delivering water efficiently to the root zones of crops, thereby minimizing water wastage while enhancing agricultural productivity. In Australia, the increasing demand for these systems is primarily driven by critical factors such as water scarcity, climate variability, and the rising adoption of precision farming techniques. Additionally, government incentives aimed at promoting sustainable agricultural practices further bolster the growth of this market.
Australia Micro-Irrigation Systems Market Growth Drivers
The Australia Micro-Irrigation Systems Market is experiencing robust expansion due to a combination of key growth drivers:
- Increased adoption of precision irrigation practices among Australian farmers is elevating water efficiency and crop yield, making micro irrigation a preferred choice in diverse agricultural sectors.
- Technological advancements such as smart irrigation controllers and soil moisture sensors enhance the functionality and effectiveness of micro irrigation systems, captivating the interest of farmers.
- Growing awareness regarding sustainable farming and climate-resilient practices compels stakeholders towards adopting micro irrigation to mitigate the impact of water scarcity.
- Government initiatives promoting water conservation provide financial incentives and support for implementing micro irrigation systems across various agricultural businesses.
- The rising investment in agricultural technology is facilitating the development of innovative micro irrigation solutions, further stimulating market growth.
Australia Micro-Irrigation Systems Market Challenges and Restraints
Despite its positive outlook, the Australia Micro-Irrigation Systems Market faces several challenges:
- Water scarcity remains a pressing concern, particularly in regions susceptible to drought, which complicates the efficient application of micro irrigation systems.
- Cost-effectiveness remains a significant barrier; farmers often seek assurance of favorable returns on investments associated with installing micro irrigation technology.
- Lack of awareness and technical expertise regarding micro irrigation can hinder adoption rates, particularly in remote or less accessible agricultural areas.
- Investment in infrastructure and maintenance can also pose challenges, as stakeholders must balance initial costs with long-term benefits.
- Regulatory and policy barriers may exist that restrict the widespread implementation of advanced micro irrigation technologies, requiring ongoing advocacy for reform.
Australia Micro-Irrigation Systems Market Government Investment and Initiatives
The Australian government is actively fostering the growth of the micro irrigation systems market through various strategic investments and initiatives. These efforts are aimed at promoting water conservation and enhancing agricultural productivity:
- Government policies often include substantial funding for water infrastructure projects to modernize existing irrigation systems and improve overall efficiency.
- Subsidies and financial incentives are provided to farmers who adopt micro irrigation solutions, encouraging the transition from traditional to modern practices.
- Technical assistance programs are designed to educate farmers on the benefits and implementation of micro irrigation technologies, ensuring proper utilization and maintenance.
- Investment in research and development plays a crucial role, as government support for innovative water-saving technologies expands the capabilities of micro irrigation systems.
- Collaboration between government bodies and agricultural institutions fosters new initiatives that promote resilience against climate variability and enhance sustainable farming practices.
Australia Micro-Irrigation Systems Market Latest Developments (May 2025 - June 2026)
The Australia Micro-Irrigation Systems Market has witnessed several notable developments in recent months, reflecting the industry's evolving landscape:
- There has been a marked uptick in the deployment of smart irrigation technologies, with more farmers integrating real-time data analytics into their irrigation practices to optimize water usage.
- Innovative partnerships between technology developers and agricultural stakeholders aim to enhance the deployment and efficiency of micro irrigation systems.
- Increased emphasis on sustainable agricultural practices has led to a greater focus on environmentally friendly micro irrigation solutions, aligning with government objectives.
- Research initiatives continue to focus on improving soil moisture monitoring techniques, further enhancing the precision of water delivery systems.
- Environmental sustainability campaigns have gained momentum, increasing public awareness and leading to higher adoption rates of micro irrigation technologies among farmers.
Australia Micro-Irrigation Systems Market - Key Attractiveness of the Report
- 10 Years of Market Numbers
- Historical Data Starting from 2022 to 2025
- Base Year: 2025
- Forecast Data until 2032
- Key Performance Indicators Impacting the Market
- Major Upcoming Developments and Projects
Key Highlights of the Report:
- Australia Micro-Irrigation Systems Market Outlook
- Market Size of Australia Micro-Irrigation Systems Market, 2025
- Forecast of Australia Micro-Irrigation Systems Market, 2032
- Historical Data and Forecast of Australia Micro-Irrigation Systems Revenues & Volume for the Period 2022-2032F
- Australia Micro-Irrigation Systems Market Trend Evolution
- Australia Micro-Irrigation Systems Market Drivers and Challenges
- Australia Micro-Irrigation Systems Price Trends
- Australia Micro-Irrigation Systems Porter's Five Forces
- Australia Micro-Irrigation Systems Industry Life Cycle
- Historical Data and Forecast of Australia Micro-Irrigation Systems Market Revenues & Volume By Mechanism for the Period 2022-2032F
- Historical Data and Forecast of Australia Micro-Irrigation Systems Market Revenues & Volume By Drip Irrigation System for the Period 2022-2032F
- Historical Data and Forecast of Australia Micro-Irrigation Systems Market Revenues & Volume By Sprinkler Irrigation System for the Period 2022-2032F
- Historical Data and Forecast of Australia Micro-Irrigation Systems Market Revenues & Volume By Other? for the Period 2022-2032F
- Historical Data and Forecast of Australia Micro-Irrigation Systems Market Revenues & Volume By Components for the Period 2022-2032F
- Historical Data and Forecast of Australia Micro-Irrigation Systems Market Revenues & Volume By Drip Irrigation Components for the Period 2022-2032F
- Historical Data and Forecast of Australia Micro-Irrigation Systems Market Revenues & Volume By Sprinkler Irrigation Components for the Period 2022-2032F
- Historical Data and Forecast of Australia Micro-Irrigation Systems Market Revenues & Volume By Cultivation Technology for the Period 2022-2032F
- Historical Data and Forecast of Australia Micro-Irrigation Systems Market Revenues & Volume By Application for the Period 2022-2032F
- Historical Data and Forecast of Australia Micro-Irrigation Systems Market Revenues & Volume By Field Crops for the Period 2022-2032F
- Historical Data and Forecast of Australia Micro-Irrigation Systems Market Revenues & Volume By Orchards and Vineyards for the Period 2022-2032F
- Historical Data and Forecast of Australia Micro-Irrigation Systems Market Revenues & Volume By Vegetables for the Period 2022-2032F
- Historical Data and Forecast of Australia Micro-Irrigation Systems Market Revenues & Volume By Plantation Crops for the Period 2022-2032F
- Historical Data and Forecast of Australia Micro-Irrigation Systems Market Revenues & Volume By Other for the Period 2022-2032F
- Australia Micro-Irrigation Systems Import Export Trade Statistics
- Market Opportunity Assessment By Mechanism
- Market Opportunity Assessment By Components
- Market Opportunity Assessment By Cultivation Technology
- Market Opportunity Assessment By Application
- Australia Micro-Irrigation Systems Top Companies Market Share
- Australia Micro-Irrigation Systems Competitive Benchmarking By Technical and Operational Parameters
- Australia Micro-Irrigation Systems Company Profiles
- Australia Micro-Irrigation Systems Key Strategic Recommendations
Frequently Asked Questions About the Market Study (FAQs):
Micro irrigation systems enhance water efficiency, reduce wastage, and improve crop yields, making them crucial for addressing water scarcity in agriculture.
The government provides incentives, subsidies, and technical assistance to farmers adopting micro irrigation technologies, promoting sustainable agricultural practices.
Farmers confront challenges related to cost-effectiveness, technological barriers, and insufficient awareness or training, which can hinder widespread adoption.
Emerging trends include the integration of smart technology, increased focus on precision agriculture, and heightened awareness of environmental sustainability among farmers.
6Wresearch actively monitors the Australia Micro-Irrigation Systems Market and publishes its comprehensive annual report, highlighting emerging trends, growth drivers, revenue analysis, and forecast outlook. Our insights help businesses to make data-backed strategic decisions with ongoing market dynamics. Our analysts track relevent industries related to the Australia Micro-Irrigation Systems Market, allowing our clients with actionable intelligence and reliable forecasts tailored to emerging regional needs.
Yes, we provide customisation as per your requirements. To learn more, feel free to contact us on sales@6wresearch.com
1 Executive Summary |
2 Introduction |
2.1 Key Highlights of the Report |
2.2 Report Description |
2.3 Market Scope & Segmentation |
2.4 Research Methodology |
2.5 Assumptions |
3 Australia Micro-Irrigation Systems Market Overview |
3.1 Australia Country Macro Economic Indicators |
3.2 Australia Micro-Irrigation Systems Market Revenues & Volume, 2022 & 2032F |
3.3 Australia Micro-Irrigation Systems Market - Industry Life Cycle |
3.4 Australia Micro-Irrigation Systems Market - Porter's Five Forces |
3.5 Australia Micro-Irrigation Systems Market Revenues & Volume Share, By Mechanism, 2022 & 2032F |
3.6 Australia Micro-Irrigation Systems Market Revenues & Volume Share, By Components, 2022 & 2032F |
3.7 Australia Micro-Irrigation Systems Market Revenues & Volume Share, By Cultivation Technology, 2022 & 2032F |
3.8 Australia Micro-Irrigation Systems Market Revenues & Volume Share, By Application, 2022 & 2032F |
4 Australia Micro-Irrigation Systems Market Dynamics |
4.1 Impact Analysis |
4.2 Market Drivers |
4.2.1 Increasing focus on sustainable agriculture practices in Australia |
4.2.2 Growing adoption of precision farming techniques |
4.2.3 Government initiatives promoting water conservation and efficient irrigation practices |
4.3 Market Restraints |
4.3.1 High initial investment cost of micro-irrigation systems |
4.3.2 Lack of awareness and technical know-how among farmers |
4.3.3 Limited availability of skilled labor for installation and maintenance of micro-irrigation systems |
5 Australia Micro-Irrigation Systems Market Trends |
6 Australia Micro-Irrigation Systems Market, By Types |
6.1 Australia Micro-Irrigation Systems Market, By Mechanism |
6.1.1 Overview and Analysis |
6.1.2 Australia Micro-Irrigation Systems Market Revenues & Volume, By Mechanism, 2022-2032F |
6.1.3 Australia Micro-Irrigation Systems Market Revenues & Volume, By Drip Irrigation System, 2022-2032F |
6.1.4 Australia Micro-Irrigation Systems Market Revenues & Volume, By Sprinkler Irrigation System, 2022-2032F |
6.1.5 Australia Micro-Irrigation Systems Market Revenues & Volume, By Other , 2022-2032F |
6.2 Australia Micro-Irrigation Systems Market, By Components |
6.2.1 Overview and Analysis |
6.2.2 Australia Micro-Irrigation Systems Market Revenues & Volume, By Drip Irrigation Components, 2022-2032F |
6.2.3 Australia Micro-Irrigation Systems Market Revenues & Volume, By Sprinkler Irrigation Components, 2022-2032F |
6.3 Australia Micro-Irrigation Systems Market, By Cultivation Technology |
6.3.1 Overview and Analysis |
6.4 Australia Micro-Irrigation Systems Market, By Application |
6.4.1 Overview and Analysis |
6.4.2 Australia Micro-Irrigation Systems Market Revenues & Volume, By Field Crops, 2022-2032F |
6.4.3 Australia Micro-Irrigation Systems Market Revenues & Volume, By Orchards and Vineyards, 2022-2032F |
6.4.4 Australia Micro-Irrigation Systems Market Revenues & Volume, By Vegetables, 2022-2032F |
6.4.5 Australia Micro-Irrigation Systems Market Revenues & Volume, By Plantation Crops, 2022-2032F |
6.4.6 Australia Micro-Irrigation Systems Market Revenues & Volume, By Other, 2022-2032F |
7 Australia Micro-Irrigation Systems Market Import-Export Trade Statistics |
7.1 Australia Micro-Irrigation Systems Market Export to Major Countries |
7.2 Australia Micro-Irrigation Systems Market Imports from Major Countries |
8 Australia Micro-Irrigation Systems Market Key Performance Indicators |
8.1 Water use efficiency rate |
8.2 Adoption rate of micro-irrigation systems among farmers |
8.3 Growth rate of agricultural output per unit area irrigated |
9 Australia Micro-Irrigation Systems Market - Opportunity Assessment |
9.1 Australia Micro-Irrigation Systems Market Opportunity Assessment, By Mechanism, 2022 & 2032F |
9.2 Australia Micro-Irrigation Systems Market Opportunity Assessment, By Components, 2022 & 2032F |
9.3 Australia Micro-Irrigation Systems Market Opportunity Assessment, By Cultivation Technology, 2022 & 2032F |
9.4 Australia Micro-Irrigation Systems Market Opportunity Assessment, By Application, 2022 & 2032F |
10 Australia Micro-Irrigation Systems Market - Competitive Landscape |
10.1 Australia Micro-Irrigation Systems Market Revenue Share, By Companies, 2025 |
10.2 Australia Micro-Irrigation Systems Market Competitive Benchmarking, By Operating and Technical Parameters |
11 Company Profiles |
12 Recommendations |
13 Disclaimer |
Global Go To Market Strategy - 2030
Export potential enables firms to identify high-growth global markets with greater confidence by combining advanced trade intelligence with a structured quantitative methodology. The framework analyzes emerging demand trends and country-level import patterns while integrating macroeconomic and trade datasets such as GDP and population forecasts, bilateral import–export flows, tariff structures, elasticity differentials between developed and developing economies, geographic distance, and import demand projections. Using weighted trade values from 2020–2024 as the base period to project country-to-country export potential for 2030, these inputs are operationalized through calculated drivers such as gravity model parameters, tariff impact factors, and projected GDP per-capita growth. Through an analysis of hidden potentials, demand hotspots, and market conditions that are most favorable to success, this method enables firms to focus on target countries, maximize returns, and global expansion with data, backed by accuracy.
By factoring in the projected importer demand gap that is currently unmet and could be potential opportunity, it identifies the potential for the Exporter (Country) among 190 countries, against the general trade analysis, which identifies the biggest importer or exporter.
To discover high-growth global markets and optimize your business strategy:
Click Here
Pricing
- Single User License$ 1,995
- Department License$ 2,400
- Site License$ 3,120
- Global License$ 3,795

Leadership Perspectives from Industry Events
Search
Thought Leadership and Analyst Meet


Our Clients
6WResearch In News
- India Air Conditioner Market Set for Strong Rebound in 2026 After Weather-Led Correction and GST-Driven Recovery: 6Wresearch
- ADAS in India: How Automatic Emergency Braking, Blind Spot Detection & Driver Monitoring are Transforming Road Safety
- Doha a strategic location for EV manufacturing hub: IPA Qatar
- Demand for luxury TVs surging in the GCC, says Samsung
- Empowering Growth: The Thriving Journey of Bangladesh’s Cable Industry
- Demand for luxury TVs surging in the GCC, says Samsung
Latest Reports
- Poland Fire Protection Systems Market (2026-2032)
- Cape Verde Portable Hand-Thrown Extinguisher Market (2026-2032)
- Canada Portable Hand-Thrown Extinguisher Market (2026-2032)
- Cameroon Portable Hand-Thrown Extinguisher Market (2026-2032)
- Burundi Portable Hand-Thrown Extinguisher Market (2026-2032)
- Burkina Faso Portable Hand-Thrown Extinguisher Market (2026-2032)
- Bulgaria Portable Hand-Thrown Extinguisher Market (2026-2032)
- Brunei Portable Hand-Thrown Extinguisher Market (2026-2032)
- Botswana Portable Hand-Thrown Extinguisher Market (2026-2032)
- Bosnia and Herzegovina Portable Hand-Thrown Extinguisher Market (2026-2032)
Industry Events and Analyst Meet

HIMTEX 2026

India Refining Summit 2026

India EV Show 2026

EV tech India Expo 2026

Auto Tech Asia 2026
Whitepaper
- Middle East & Africa Commercial Security Market Click here to view more.
- Middle East & Africa Fire Safety Systems & Equipment Market Click here to view more.
- GCC Drone Market Click here to view more.
- Middle East Lighting Fixture Market Click here to view more.
- GCC Physical & Perimeter Security Market Click here to view more.