Australia Micro Turbine Market (2026-2032) Outlook | Analysis, Revenue, Share, Trends, Growth, Companies, Value, Forecast, Size & Industry
Market Forecast By Application (Combined Heat & Power (CHP), Standby Power), By Power Rating (12 kW -50 kW, 50 kW-250 kW, 250 kW-500 kW), By End-use (Industrial, Commercial, Residential) And Competitive Landscape
| Product Code: ETC099174 | Publication Date: Jun 2021 | Updated Date: Mar 2026 | Product Type: Report | |
| Publisher: 6Wresearch | Author: Ravi Bhandari | No. of Pages: 70 | No. of Figures: 35 | No. of Tables: 5 |
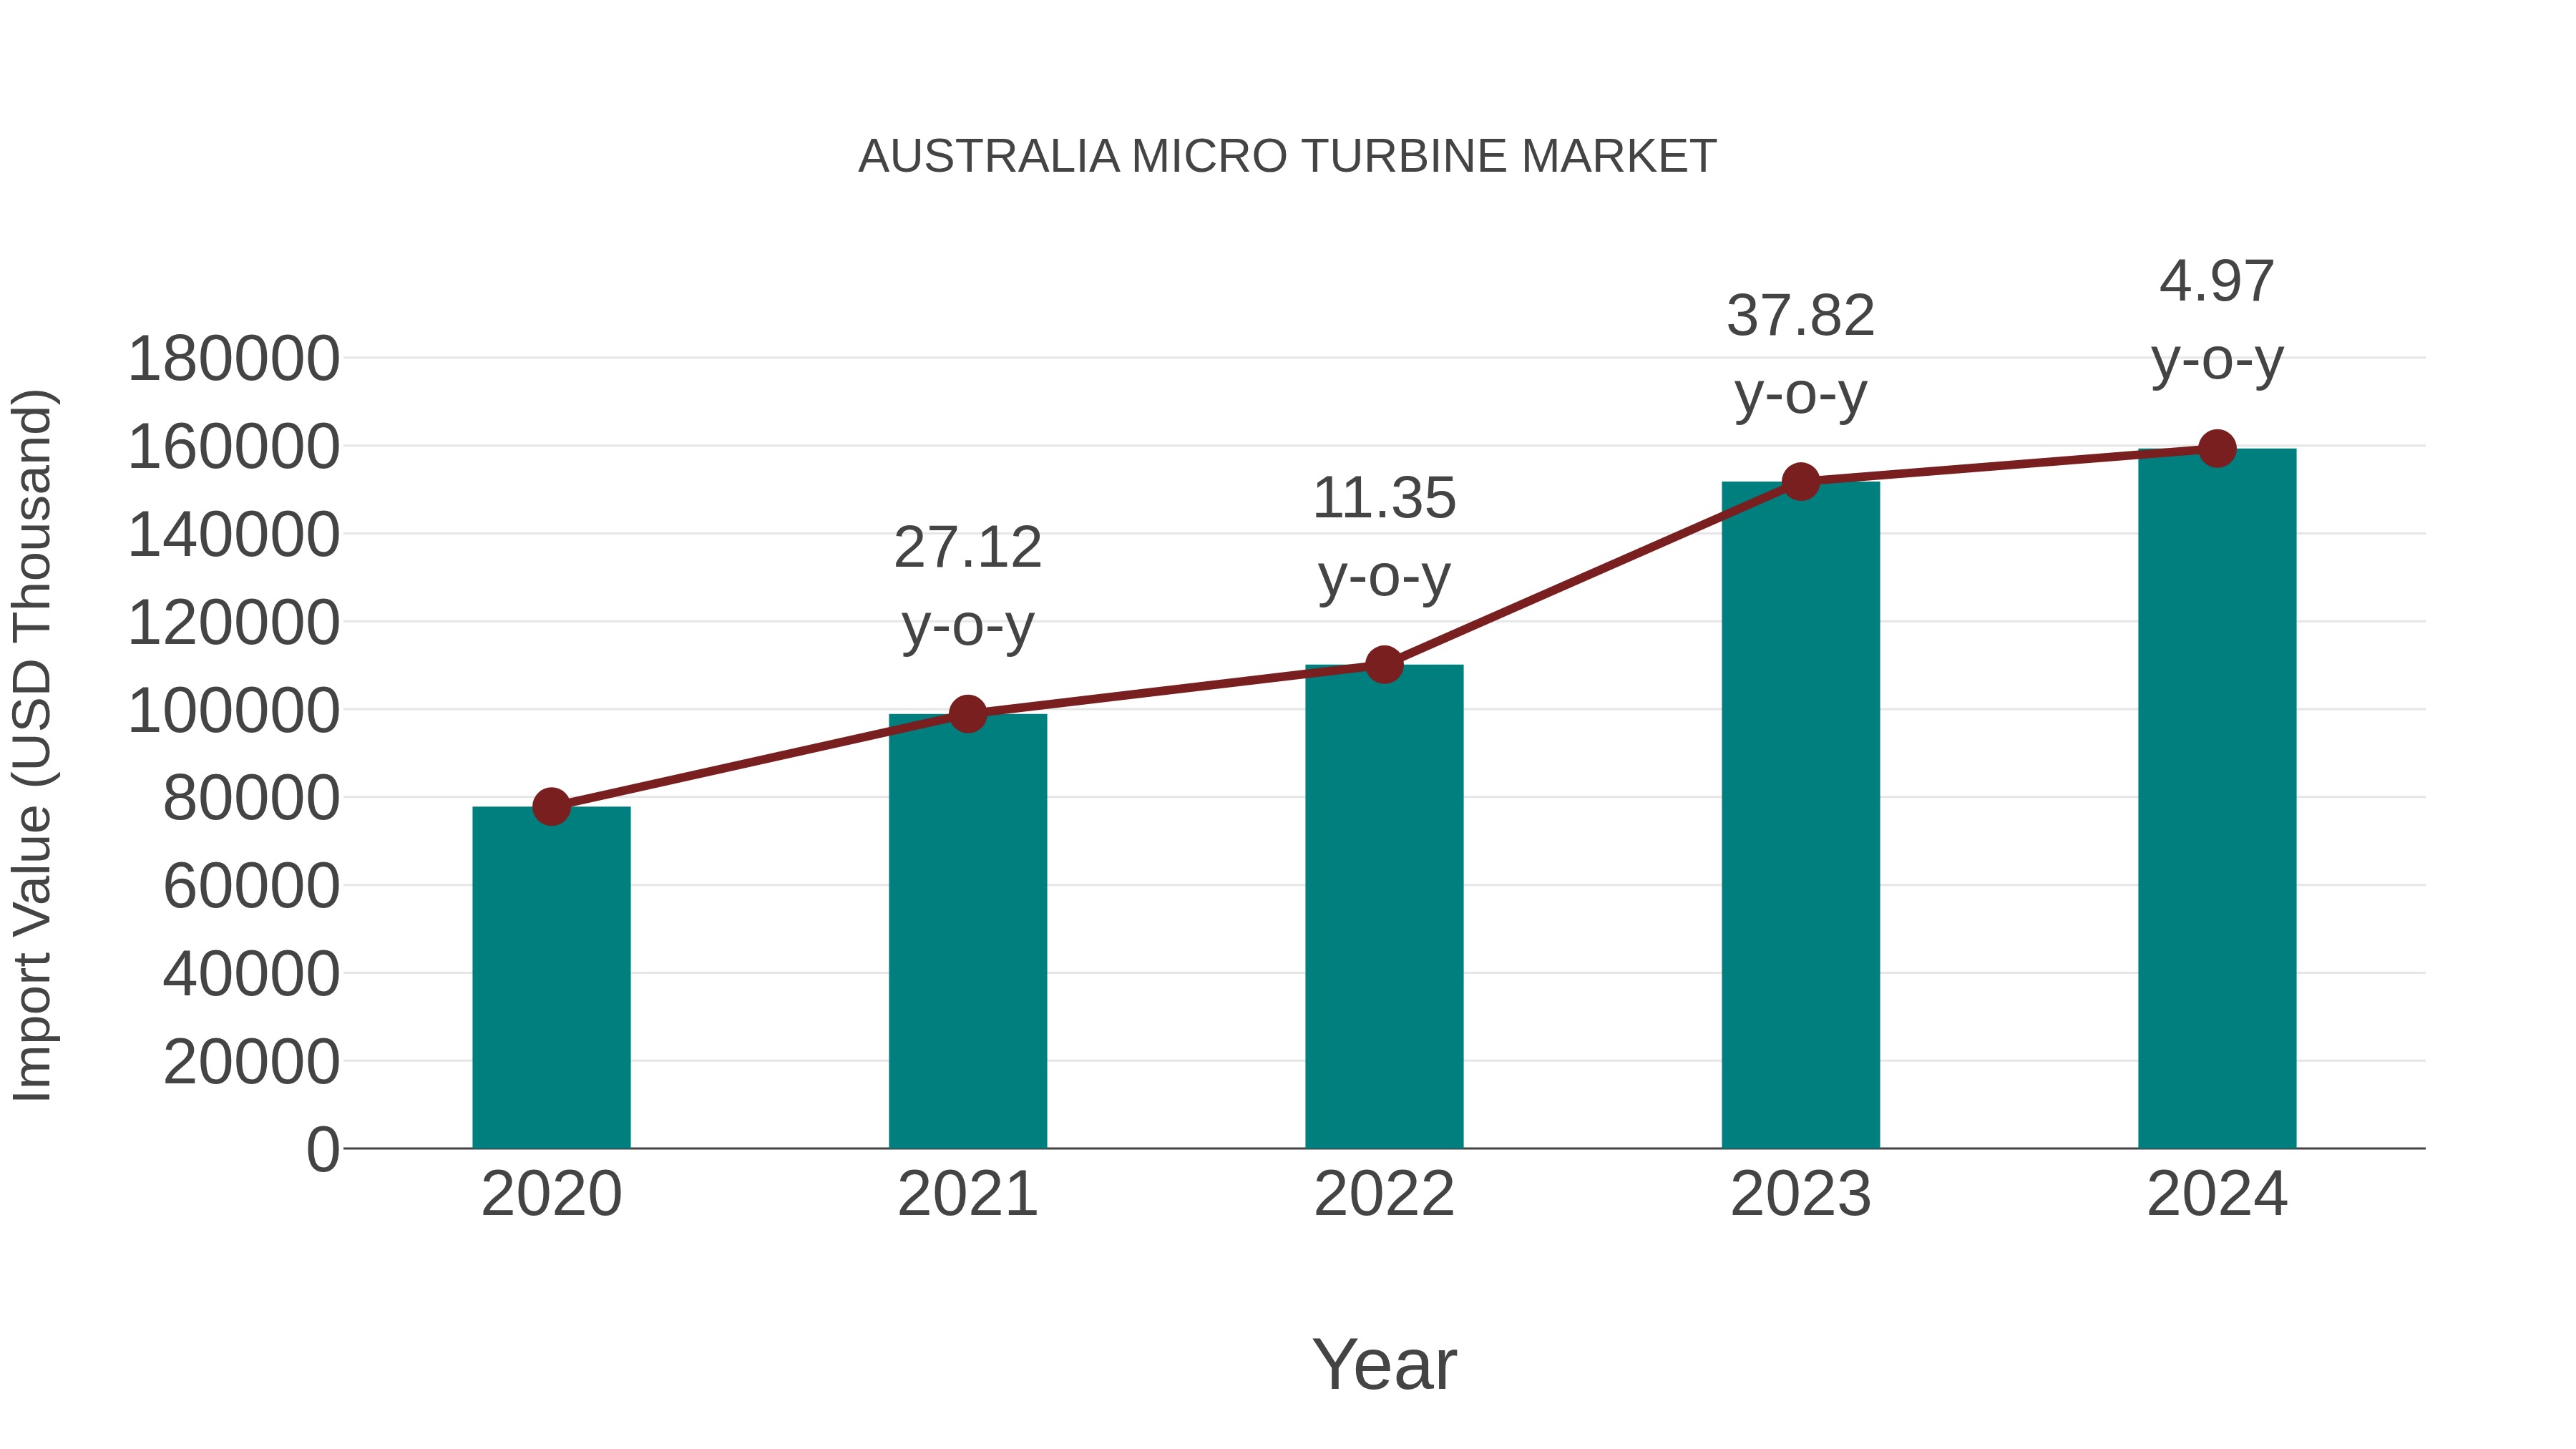
Australia Micro Turbine Market: Import Trend Analysis
Australia`s import trend for the micro turbine market showed a growth rate of 4.97% from 2023 to 2024, with a compound annual growth rate (CAGR) of 19.63% from 2020 to 2024. This substantial increase in imports can be attributed to a growing demand for energy-efficient solutions and a shift towards sustainable energy sources in the market.
Australia Micro Turbine Market Overview
Micro turbines are small-scale power generation systems that use combustion or renewable fuels to produce electricity and heat for distributed energy applications. In Australia, the micro turbine market serves sectors such as commercial and industrial facilities, remote communities, and off-grid installations, driven by factors such as energy security, decentralization of power generation, and environmental sustainability goals.
Drivers of the market
The Australia micro turbine market is witnessing growth driven by several drivers. Micro turbines, compact and lightweight gas turbines, offer advantages such as high efficiency, low emissions, and fuel flexibility, making them suitable for distributed power generation and combined heat and power (CHP) applications. The market growth is propelled by increasing demand for decentralized energy solutions in industries such as oil and gas, healthcare, and residential sectors. Additionally, advancements in turbine design, materials, and control systems are driving innovation and expanding the application scope of micro turbines in the Australia market. Moreover, government incentives promoting renewable energy adoption and energy efficiency measures are further stimulating market demand for micro turbine technology.
Challenges of the market
The Australia micro turbine market confronts challenges related to technology maturity, regulatory barriers, and market adoption. Micro turbines, small-scale power generation devices, offer advantages in terms of fuel flexibility, low emissions, and distributed energy generation. However, achieving technology maturity and reliability in micro turbine systems, particularly in harsh operating conditions and remote environments, poses challenges for manufacturers in terms of turbine design, materials selection, and performance optimization. Moreover, regulatory barriers and grid integration challenges, such as interconnection standards and permitting requirements, may hinder the widespread adoption of micro turbine systems in Australia. Additionally, addressing market adoption and customer education about the benefits and applications of micro turbine technology is essential for market growth and expansion. To address these challenges, companies in the Australia micro turbine market must focus on research and development, regulatory advocacy, and market outreach to drive technology advancement.
Government Policy of the market
The Australia micro turbine market is influenced by government policies aimed at promoting renewable energy adoption, decentralization, and energy independence. Regulatory frameworks may include incentives, subsidies, and mandates to accelerate the deployment of micro turbines in distributed energy systems, including microgrids, cogeneration, and combined heat and power applications. Additionally, government support for research and development of advanced turbine technologies, fuel flexibility, and grid integration solutions fosters innovation and competitiveness in the micro turbine market. Government investment in renewable energy infrastructure, energy storage, and grid modernization further drives market growth and sustainability in Australia.
Key Highlights of the Report:
- Australia Micro Turbine Market Outlook
- Market Size of Australia Micro Turbine Market, 2025
- Forecast of Australia Micro Turbine Market, 2032
- Historical Data and Forecast of Australia Micro Turbine Revenues & Volume for the Period 2022-2032F
- Australia Micro Turbine Market Trend Evolution
- Australia Micro Turbine Market Drivers and Challenges
- Australia Micro Turbine Price Trends
- Australia Micro Turbine Porter's Five Forces
- Australia Micro Turbine Industry Life Cycle
- Historical Data and Forecast of Australia Micro Turbine Market Revenues & Volume By Application for the Period 2022-2032F
- Historical Data and Forecast of Australia Micro Turbine Market Revenues & Volume By Combined Heat & Power (CHP) for the Period 2022-2032F
- Historical Data and Forecast of Australia Micro Turbine Market Revenues & Volume By Standby Power for the Period 2022-2032F
- Historical Data and Forecast of Australia Micro Turbine Market Revenues & Volume By Power Rating for the Period 2022-2032F
- Historical Data and Forecast of Australia Micro Turbine Market Revenues & Volume By 12 kW -50 kW for the Period 2022-2032F
- Historical Data and Forecast of Australia Micro Turbine Market Revenues & Volume By 50 kW-250 kW for the Period 2022-2032F
- Historical Data and Forecast of Australia Micro Turbine Market Revenues & Volume By 250 kW-500 kW for the Period 2022-2032F
- Historical Data and Forecast of Australia Micro Turbine Market Revenues & Volume By End-use for the Period 2022-2032F
- Historical Data and Forecast of Australia Micro Turbine Market Revenues & Volume By Industrial for the Period 2022-2032F
- Historical Data and Forecast of Australia Micro Turbine Market Revenues & Volume By Commercial for the Period 2022-2032F
- Historical Data and Forecast of Australia Micro Turbine Market Revenues & Volume By Residential for the Period 2022-2032F
- Australia Micro Turbine Import Export Trade Statistics
- Market Opportunity Assessment By Application
- Market Opportunity Assessment By Power Rating
- Market Opportunity Assessment By End-use
- Australia Micro Turbine Top Companies Market Share
- Australia Micro Turbine Competitive Benchmarking By Technical and Operational Parameters
- Australia Micro Turbine Company Profiles
- Australia Micro Turbine Key Strategic Recommendations
Australia Micro Turbine Market (2026-2032): FAQs
6Wresearch actively monitors the Australia Micro Turbine Market and publishes its comprehensive annual report, highlighting emerging trends, growth drivers, revenue analysis, and forecast outlook. Our insights help businesses to make data-backed strategic decisions with ongoing market dynamics. Our analysts track relevent industries related to the Australia Micro Turbine Market, allowing our clients with actionable intelligence and reliable forecasts tailored to emerging regional needs.
Yes, we provide customisation as per your requirements. To learn more, feel free to contact us on sales@6wresearch.com
1 Executive Summary |
2 Introduction |
2.1 Key Highlights of the Report |
2.2 Report Description |
2.3 Market Scope & Segmentation |
2.4 Research Methodology |
2.5 Assumptions |
3 Australia Micro Turbine Market Overview |
3.1 Australia Country Macro Economic Indicators |
3.2 Australia Micro Turbine Market Revenues & Volume, 2022 & 2032F |
3.3 Australia Micro Turbine Market - Industry Life Cycle |
3.4 Australia Micro Turbine Market - Porter's Five Forces |
3.5 Australia Micro Turbine Market Revenues & Volume Share, By Form, 2022 & 2032F |
3.6 Australia Micro Turbine Market Revenues & Volume Share, By Power Rating, 2022 & 2032F |
3.7 Australia Micro Turbine Market Revenues & Volume Share, By End-use, 2022 & 2032F |
4 Australia Micro Turbine Market Dynamics |
4.1 Impact Analysis |
4.2 Market Drivers |
4.2.1 Increasing focus on renewable energy sources in Australia |
4.2.2 Government initiatives and incentives promoting clean energy solutions |
4.2.3 Growing demand for distributed energy generation |
4.2.4 Technological advancements in micro turbine technology |
4.3 Market Restraints |
4.3.1 High initial investment costs for micro turbines |
4.3.2 Limited awareness and understanding of micro turbine technology |
4.3.3 Regulatory challenges and grid integration issues |
4.3.4 Competition from other renewable energy sources |
5 Australia Micro Turbine Market Trends |
6 Australia Micro Turbine Market, By Types |
6.1 Australia Micro Turbine Market, By Application |
6.1.1 Overview and Analysis |
6.1.2 Australia Micro Turbine Market Revenues & Volume, By Application, 2022-2032F |
6.1.3 Australia Micro Turbine Market Revenues & Volume, By Combined Heat & Power (CHP), 2022-2032F |
6.1.4 Australia Micro Turbine Market Revenues & Volume, By Standby Power, 2022-2032F |
6.2 Australia Micro Turbine Market, By Power Rating |
6.2.1 Overview and Analysis |
6.2.2 Australia Micro Turbine Market Revenues & Volume, By 12 kW -50 kW, 2022-2032F |
6.2.3 Australia Micro Turbine Market Revenues & Volume, By 50 kW-250 kW, 2022-2032F |
6.2.4 Australia Micro Turbine Market Revenues & Volume, By 250 kW-500 kW, 2022-2032F |
6.3 Australia Micro Turbine Market, By End-use |
6.3.1 Overview and Analysis |
6.3.2 Australia Micro Turbine Market Revenues & Volume, By Industrial, 2022-2032F |
6.3.3 Australia Micro Turbine Market Revenues & Volume, By Commercial, 2022-2032F |
6.3.4 Australia Micro Turbine Market Revenues & Volume, By Residential, 2022-2032F |
7 Australia Micro Turbine Market Import-Export Trade Statistics |
7.1 Australia Micro Turbine Market Export to Major Countries |
7.2 Australia Micro Turbine Market Imports from Major Countries |
8 Australia Micro Turbine Market Key Performance Indicators |
8.1 Number of new installations of micro turbines in Australia |
8.2 Growth rate of renewable energy adoption in the country |
8.3 Investment flow into clean energy projects |
8.4 Level of government support and policies favoring micro turbine adoption |
8.5 Rate of improvement in micro turbine efficiency and reliability |
9 Australia Micro Turbine Market - Opportunity Assessment |
9.1 Australia Micro Turbine Market Opportunity Assessment, By Application, 2022 & 2032F |
9.2 Australia Micro Turbine Market Opportunity Assessment, By Power Rating, 2022 & 2032F |
9.3 Australia Micro Turbine Market Opportunity Assessment, By End-use, 2022 & 2032F |
10 Australia Micro Turbine Market - Competitive Landscape |
10.1 Australia Micro Turbine Market Revenue Share, By Companies, 2025 |
10.2 Australia Micro Turbine Market Competitive Benchmarking, By Operating and Technical Parameters |
11 Company Profiles |
12 Recommendations |
13 Disclaimer |
Global Go To Market Strategy - 2030
Export potential enables firms to identify high-growth global markets with greater confidence by combining advanced trade intelligence with a structured quantitative methodology. The framework analyzes emerging demand trends and country-level import patterns while integrating macroeconomic and trade datasets such as GDP and population forecasts, bilateral import–export flows, tariff structures, elasticity differentials between developed and developing economies, geographic distance, and import demand projections. Using weighted trade values from 2020–2024 as the base period to project country-to-country export potential for 2030, these inputs are operationalized through calculated drivers such as gravity model parameters, tariff impact factors, and projected GDP per-capita growth. Through an analysis of hidden potentials, demand hotspots, and market conditions that are most favorable to success, this method enables firms to focus on target countries, maximize returns, and global expansion with data, backed by accuracy.
By factoring in the projected importer demand gap that is currently unmet and could be potential opportunity, it identifies the potential for the Exporter (Country) among 190 countries, against the general trade analysis, which identifies the biggest importer or exporter.
To discover high-growth global markets and optimize your business strategy:
Click Here
Pricing
- Single User License$ 1,995
- Department License$ 2,400
- Site License$ 3,120
- Global License$ 3,795

Leadership Perspectives from Industry Events
Search
Thought Leadership and Analyst Meet


Our Clients
6WResearch In News
- India Air Conditioner Market Set for Strong Rebound in 2026 After Weather-Led Correction and GST-Driven Recovery: 6Wresearch
- ADAS in India: How Automatic Emergency Braking, Blind Spot Detection & Driver Monitoring are Transforming Road Safety
- Doha a strategic location for EV manufacturing hub: IPA Qatar
- Demand for luxury TVs surging in the GCC, says Samsung
- Empowering Growth: The Thriving Journey of Bangladesh’s Cable Industry
- Demand for luxury TVs surging in the GCC, says Samsung
Latest Reports
- Nicaragua RPG Gaming Market (2026-2032)
- New Zealand RPG Gaming Market (2026-2032)
- Netherlands RPG Gaming Market (2026-2032)
- Nauru RPG Gaming Market (2026-2032)
- Namibia RPG Gaming Market (2026-2032)
- Mozambique RPG Gaming Market (2026-2032)
- Montenegro RPG Gaming Market (2026-2032)
- Mongolia RPG Gaming Market (2026-2032)
- Monaco RPG Gaming Market (2026-2032)
- Micronesia RPG Gaming Market (2026-2032)
Industry Events and Analyst Meet

EV India Expo 2026

HIMTEX 2026

India Refining Summit 2026

India EV Show 2026

EV tech India Expo 2026
Whitepaper
- Middle East & Africa Commercial Security Market Click here to view more.
- Middle East & Africa Fire Safety Systems & Equipment Market Click here to view more.
- GCC Drone Market Click here to view more.
- Middle East Lighting Fixture Market Click here to view more.
- GCC Physical & Perimeter Security Market Click here to view more.