Brazil Micro Turbine Market (2025-2031) Outlook | Analysis, Revenue, Forecast, Value, Companies, Share, Growth, Industry, Size & Trends
Market Forecast By Application (Combined Heat & Power (CHP), Standby Power), By Power Rating (12 kW -50 kW, 50 kW-250 kW, 250 kW-500 kW), By End-use (Industrial, Commercial, Residential) And Competitive Landscape
| Product Code: ETC099141 | Publication Date: Jun 2021 | Updated Date: Oct 2025 | Product Type: Report | |
| Publisher: 6Wresearch | Author: Ravi Bhandari | No. of Pages: 70 | No. of Figures: 35 | No. of Tables: 5 |
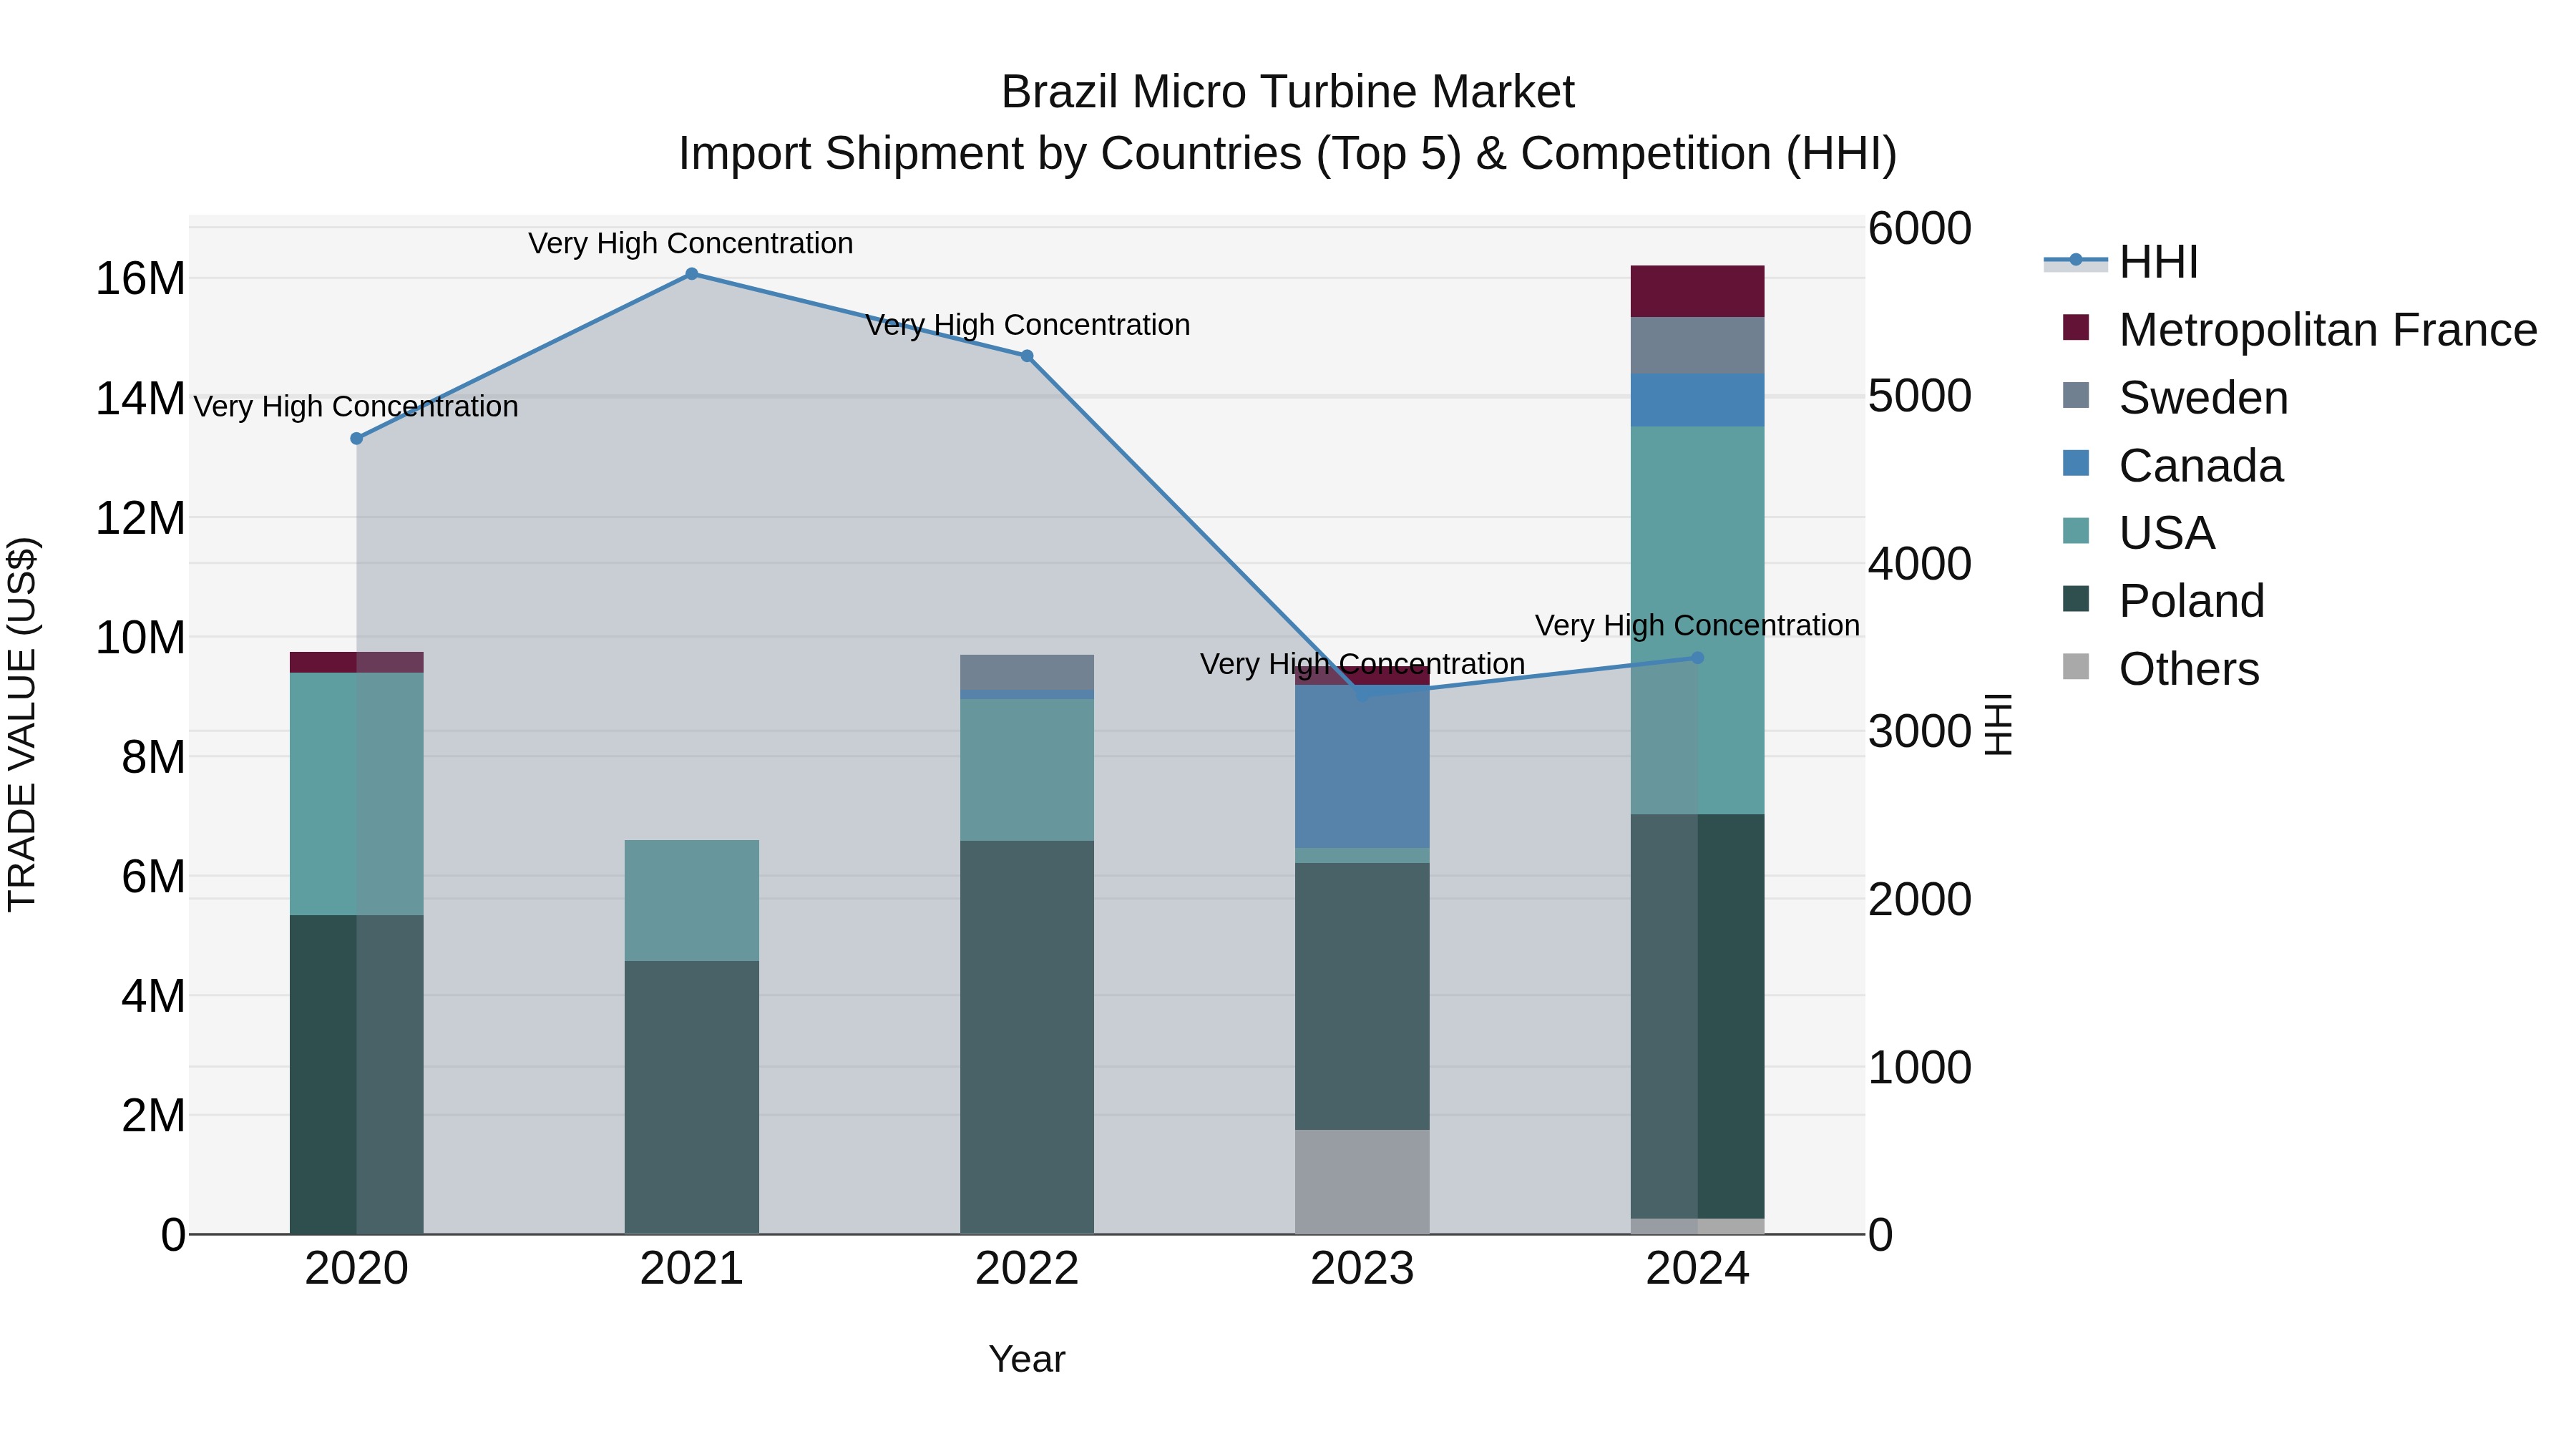
Brazil Micro Turbine Market Top 5 Importing Countries and Market Competition (HHI) Analysis
Brazil continues to see a significant increase in the import of micro turbines, with top exporting countries including Poland, USA, Sweden, Canada, and Metropolitan France. The high Herfindahl-Hirschman Index (HHI) in 2024 indicates a concentrated market. The compound annual growth rate (CAGR) from 2020 to 2024 stands at an impressive 13.55%, with a rapid growth rate of 70.42% from 2023 to 2024. This trend signals a growing demand for micro turbines in Brazil and highlights the competitive landscape among key exporters.
Brazil Micro Turbine Market Overview
The Brazil Micro Turbine market has witnessed increased adoption in distributed energy generation systems. Challenges include the need for continuous technological advancements, regulatory frameworks for distributed energy, and market competition from conventional power sources. Adapting to evolving energy policies and ensuring product reliability will be crucial for sustained growth in the micro turbine market.
Drivers of the market
The Brazil Micro Turbine market is experiencing growth as a result of the increasing demand for distributed energy generation solutions. Micro turbines offer compact and efficient power generation, making them suitable for various applications, including remote locations and distributed energy systems. The emphasis on clean and sustainable energy sources, coupled with advancements in micro turbine technology, contributes to the positive trajectory of the market in Brazil. The need for reliable and decentralized power generation solutions further drives the adoption of micro turbines.
Challenges of the market
The Brazil Micro Turbine market, driven by its applications in distributed power generation, faces challenges related to grid integration, market awareness, and competition from traditional power sources. Overcoming these challenges involves collaboration with utilities, educating the market about micro turbine benefits, and adapting to the evolving energy landscape.
Government Policy of the market
Government policies in the Brazil Micro Turbine market may include incentives for renewable energy adoption, emission reduction targets, and grid integration standards. Market players must stay abreast of these policies to align their products with the country`s energy goals. Understanding and incorporating these regulations into business strategies are essential for sustained growth in the micro turbine sector.
Key Highlights of the Report:
- Brazil Micro Turbine Market Outlook
- Market Size of Brazil Micro Turbine Market, 2024
- Forecast of Brazil Micro Turbine Market, 2031
- Historical Data and Forecast of Brazil Micro Turbine Revenues & Volume for the Period 2021-2031
- Brazil Micro Turbine Market Trend Evolution
- Brazil Micro Turbine Market Drivers and Challenges
- Brazil Micro Turbine Price Trends
- Brazil Micro Turbine Porter's Five Forces
- Brazil Micro Turbine Industry Life Cycle
- Historical Data and Forecast of Brazil Micro Turbine Market Revenues & Volume By Application for the Period 2021-2031
- Historical Data and Forecast of Brazil Micro Turbine Market Revenues & Volume By Combined Heat & Power (CHP) for the Period 2021-2031
- Historical Data and Forecast of Brazil Micro Turbine Market Revenues & Volume By Standby Power for the Period 2021-2031
- Historical Data and Forecast of Brazil Micro Turbine Market Revenues & Volume By Power Rating for the Period 2021-2031
- Historical Data and Forecast of Brazil Micro Turbine Market Revenues & Volume By 12 kW -50 kW for the Period 2021-2031
- Historical Data and Forecast of Brazil Micro Turbine Market Revenues & Volume By 50 kW-250 kW for the Period 2021-2031
- Historical Data and Forecast of Brazil Micro Turbine Market Revenues & Volume By 250 kW-500 kW for the Period 2021-2031
- Historical Data and Forecast of Brazil Micro Turbine Market Revenues & Volume By End-use for the Period 2021-2031
- Historical Data and Forecast of Brazil Micro Turbine Market Revenues & Volume By Industrial for the Period 2021-2031
- Historical Data and Forecast of Brazil Micro Turbine Market Revenues & Volume By Commercial for the Period 2021-2031
- Historical Data and Forecast of Brazil Micro Turbine Market Revenues & Volume By Residential for the Period 2021-2031
- Brazil Micro Turbine Import Export Trade Statistics
- Market Opportunity Assessment By Application
- Market Opportunity Assessment By Power Rating
- Market Opportunity Assessment By End-use
- Brazil Micro Turbine Top Companies Market Share
- Brazil Micro Turbine Competitive Benchmarking By Technical and Operational Parameters
- Brazil Micro Turbine Company Profiles
- Brazil Micro Turbine Key Strategic Recommendations
Frequently Asked Questions About the Market Study (FAQs):
6Wresearch actively monitors the Brazil Micro Turbine Market and publishes its comprehensive annual report, highlighting emerging trends, growth drivers, revenue analysis, and forecast outlook. Our insights help businesses to make data-backed strategic decisions with ongoing market dynamics. Our analysts track relevent industries related to the Brazil Micro Turbine Market, allowing our clients with actionable intelligence and reliable forecasts tailored to emerging regional needs.
Yes, we provide customisation as per your requirements. To learn more, feel free to contact us on sales@6wresearch.com
1 Executive Summary |
2 Introduction |
2.1 Key Highlights of the Report |
2.2 Report Description |
2.3 Market Scope & Segmentation |
2.4 Research Methodology |
2.5 Assumptions |
3 Brazil Micro Turbine Market Overview |
3.1 Brazil Country Macro Economic Indicators |
3.2 Brazil Micro Turbine Market Revenues & Volume, 2021 & 2031F |
3.3 Brazil Micro Turbine Market - Industry Life Cycle |
3.4 Brazil Micro Turbine Market - Porter's Five Forces |
3.5 Brazil Micro Turbine Market Revenues & Volume Share, By Form, 2021 & 2031F |
3.6 Brazil Micro Turbine Market Revenues & Volume Share, By Power Rating, 2021 & 2031F |
3.7 Brazil Micro Turbine Market Revenues & Volume Share, By End-use, 2021 & 2031F |
4 Brazil Micro Turbine Market Dynamics |
4.1 Impact Analysis |
4.2 Market Drivers |
4.2.1 Increasing focus on renewable energy sources in Brazil |
4.2.2 Government initiatives and incentives to promote clean energy technologies |
4.2.3 Growing demand for reliable and efficient energy solutions in remote areas |
4.3 Market Restraints |
4.3.1 High initial investment costs for micro turbine installations |
4.3.2 Limited awareness and understanding of micro turbine technology among consumers |
4.3.3 Regulatory challenges and grid integration issues |
5 Brazil Micro Turbine Market Trends |
6 Brazil Micro Turbine Market, By Types |
6.1 Brazil Micro Turbine Market, By Application |
6.1.1 Overview and Analysis |
6.1.2 Brazil Micro Turbine Market Revenues & Volume, By Application, 2021-2031F |
6.1.3 Brazil Micro Turbine Market Revenues & Volume, By Combined Heat & Power (CHP), 2021-2031F |
6.1.4 Brazil Micro Turbine Market Revenues & Volume, By Standby Power, 2021-2031F |
6.2 Brazil Micro Turbine Market, By Power Rating |
6.2.1 Overview and Analysis |
6.2.2 Brazil Micro Turbine Market Revenues & Volume, By 12 kW -50 kW, 2021-2031F |
6.2.3 Brazil Micro Turbine Market Revenues & Volume, By 50 kW-250 kW, 2021-2031F |
6.2.4 Brazil Micro Turbine Market Revenues & Volume, By 250 kW-500 kW, 2021-2031F |
6.3 Brazil Micro Turbine Market, By End-use |
6.3.1 Overview and Analysis |
6.3.2 Brazil Micro Turbine Market Revenues & Volume, By Industrial, 2021-2031F |
6.3.3 Brazil Micro Turbine Market Revenues & Volume, By Commercial, 2021-2031F |
6.3.4 Brazil Micro Turbine Market Revenues & Volume, By Residential, 2021-2031F |
7 Brazil Micro Turbine Market Import-Export Trade Statistics |
7.1 Brazil Micro Turbine Market Export to Major Countries |
7.2 Brazil Micro Turbine Market Imports from Major Countries |
8 Brazil Micro Turbine Market Key Performance Indicators |
8.1 Average capacity utilization rate of micro turbines in Brazil |
8.2 Percentage increase in the number of micro turbine installations annually |
8.3 Renewable energy penetration rate in the overall energy mix in Brazil |
9 Brazil Micro Turbine Market - Opportunity Assessment |
9.1 Brazil Micro Turbine Market Opportunity Assessment, By Application, 2021 & 2031F |
9.2 Brazil Micro Turbine Market Opportunity Assessment, By Power Rating, 2021 & 2031F |
9.3 Brazil Micro Turbine Market Opportunity Assessment, By End-use, 2021 & 2031F |
10 Brazil Micro Turbine Market - Competitive Landscape |
10.1 Brazil Micro Turbine Market Revenue Share, By Companies, 2024 |
10.2 Brazil Micro Turbine Market Competitive Benchmarking, By Operating and Technical Parameters |
11 Company Profiles |
12 Recommendations |
13 Disclaimer |
Global Go To Market Strategy - 2030
Export potential enables firms to identify high-growth global markets with greater confidence by combining advanced trade intelligence with a structured quantitative methodology. The framework analyzes emerging demand trends and country-level import patterns while integrating macroeconomic and trade datasets such as GDP and population forecasts, bilateral import–export flows, tariff structures, elasticity differentials between developed and developing economies, geographic distance, and import demand projections. Using weighted trade values from 2020–2024 as the base period to project country-to-country export potential for 2030, these inputs are operationalized through calculated drivers such as gravity model parameters, tariff impact factors, and projected GDP per-capita growth. Through an analysis of hidden potentials, demand hotspots, and market conditions that are most favorable to success, this method enables firms to focus on target countries, maximize returns, and global expansion with data, backed by accuracy.
By factoring in the projected importer demand gap that is currently unmet and could be potential opportunity, it identifies the potential for the Exporter (Country) among 190 countries, against the general trade analysis, which identifies the biggest importer or exporter.
To discover high-growth global markets and optimize your business strategy:
Click Here
Pricing
- Single User License$ 1,995
- Department License$ 2,400
- Site License$ 3,120
- Global License$ 3,795

Leadership Perspectives from Industry Events
Search
Thought Leadership and Analyst Meet


Our Clients
6WResearch In News
- India Air Conditioner Market Set for Strong Rebound in 2026 After Weather-Led Correction and GST-Driven Recovery: 6Wresearch
- ADAS in India: How Automatic Emergency Braking, Blind Spot Detection & Driver Monitoring are Transforming Road Safety
- Doha a strategic location for EV manufacturing hub: IPA Qatar
- Demand for luxury TVs surging in the GCC, says Samsung
- Empowering Growth: The Thriving Journey of Bangladesh’s Cable Industry
- Demand for luxury TVs surging in the GCC, says Samsung
Latest Reports
- Nicaragua RPG Gaming Market (2026-2032)
- New Zealand RPG Gaming Market (2026-2032)
- Netherlands RPG Gaming Market (2026-2032)
- Nauru RPG Gaming Market (2026-2032)
- Namibia RPG Gaming Market (2026-2032)
- Mozambique RPG Gaming Market (2026-2032)
- Montenegro RPG Gaming Market (2026-2032)
- Mongolia RPG Gaming Market (2026-2032)
- Monaco RPG Gaming Market (2026-2032)
- Micronesia RPG Gaming Market (2026-2032)
Industry Events and Analyst Meet

EV India Expo 2026

HIMTEX 2026

India Refining Summit 2026

India EV Show 2026

EV tech India Expo 2026
Whitepaper
- Middle East & Africa Commercial Security Market Click here to view more.
- Middle East & Africa Fire Safety Systems & Equipment Market Click here to view more.
- GCC Drone Market Click here to view more.
- Middle East Lighting Fixture Market Click here to view more.
- GCC Physical & Perimeter Security Market Click here to view more.