Australia Mineral Products Market (2026-2032) Outlook | Analysis, Value, Companies, Revenue, Trends, Growth, Forecast, Size, Industry & Share
Market Forecast By Types (Cement and Concrete Product, Glass and Glass Product, Other Non-Metallic Mineral Product, Clay Product and Refractory, Lime and Gypsum Product), By Applications (Architecture, Industry, Manufacture, Others) And Competitive Landscape
| Product Code: ETC275195 | Publication Date: Aug 2022 | Updated Date: Jul 2026 | Product Type: Market Research Report | |
| Publisher: 6Wresearch | Author: Ravi Bhandari | No. of Pages: 75 | No. of Figures: 35 | No. of Tables: 20 |
Australia Mineral Products Market Size, Share & Growth Rate
The Australia Mineral Products Market was estimated at USD 157 Million in 2025 and is projected to reach USD 185 Million by 2032, growing at a CAGR of 2.4% from 2026 to 2032. This growth trajectory is primarily driven by robust infrastructure development initiatives and a surge in urbanization trends across the country. The burgeoning demand for mineral-based products, particularly in construction and manufacturing, underscores the sectors integral role in supporting Australia's economic expansion.
Australia Mineral Products Market Year-wise Growth Rate and Key Drivers
This graph highlights how the Australia Mineral Products Market has steadily grown over the years, supported by major growth factors.
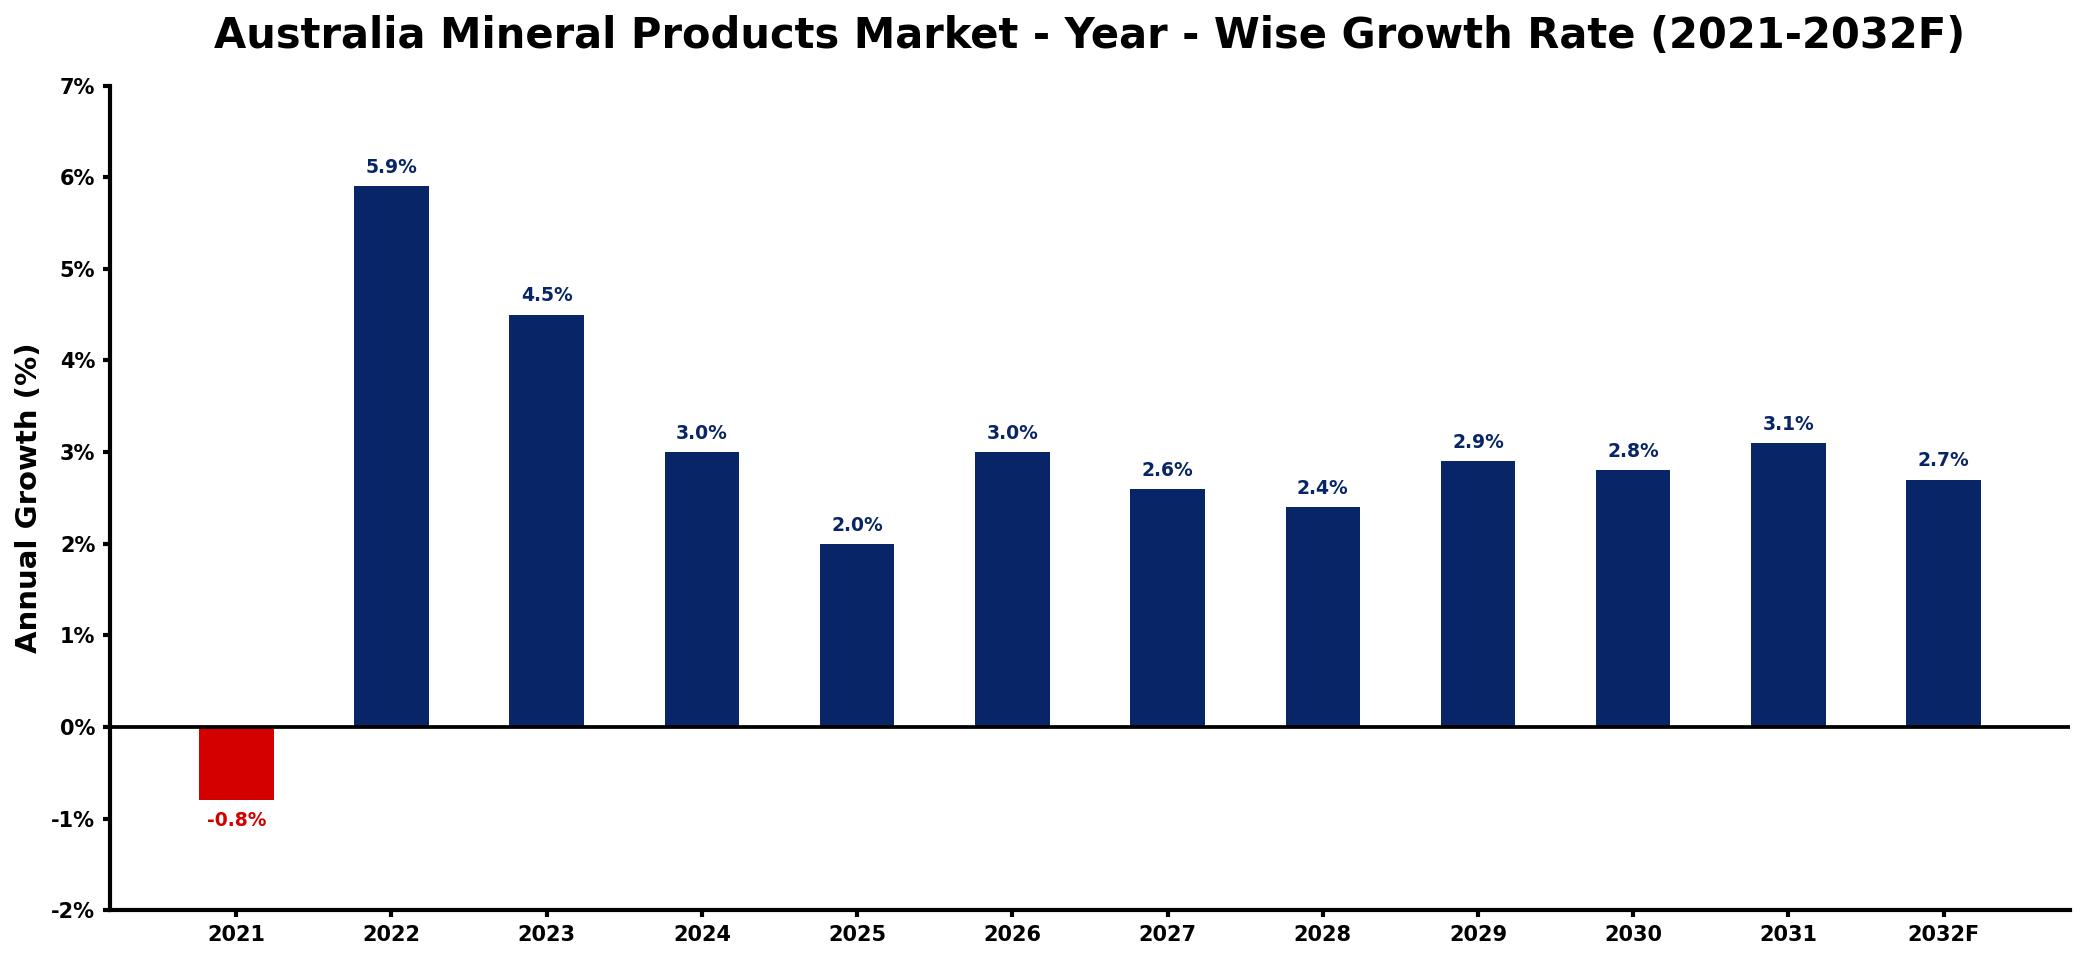
The table below presents the year‑wise growth rates along with the key drivers influencing the market
| Year | Growth Rate | Major Drivers |
| 2021 | -0.8% | Decreased construction sector investments |
| 2022 | 5.9% | Increased infrastructure spending initiatives |
| 2023 | 4.5% | Rising demand for renewable energy |
| 2024 | 3.0% | Expansion in housing construction projects |
| 2025 | 2.0% | Growth in industrial manufacturing output |
| 2026 | 3.0% | Surge in urban development activities |
| 2027 | 2.6% | Increased investments in mining technologies |
| 2028 | 2.4% | growing commercial sector adoption |
| 2029 | 2.9% | Rising consumer interest in sustainability |
| 2030 | 2.8% | Expansion of transportation infrastructure projects |
| 2031 | 3.1% | Increased focus on resource efficiency |
| 2032 | 2.7% | Growing demand for innovative applications |
Note: Market size estimations and growth projections presented in this report are based on 6Wresearch's proprietary forecasting methodology, utilizing the latest available industry data, government publications, and primary research inputs.
Australia Mineral Products Market Synopsis
A significant force reshaping the Australia Mineral Products Market is the increasing construction activity fueled by government investments in infrastructure. This momentum not only supports demand for essential materials like cement and aggregates but also enhances the capacity of various manufacturing sectors that rely on mineral products.
Moreover, the rising need for environmentally sustainable practices in production processes is steering innovation in mineral processing technologies. This trend aids in creating advanced applications for mineral-based products, meeting the diverse requirements of various end-users while fostering market growth.
Australia Mineral Products Market Key Takeaways
- The market is poised for steady growth driven by increased construction activities.
- Technological advancements in mineral processing are facilitating product innovation.
- Urbanization trends significantly boost demand across multiple sectors.
- Regulatory compliance remains essential for maintaining quality standards.
- Investment in sustainable practices is becoming a key differentiator for companies.
Evaluation of Restraints in Australia Mineral Products Market
While the Australia Mineral Products Market presents numerous opportunities, it is not without its constraints. Fluctuations in demand, often influenced by broader economic conditions, pose a risk to consistent sales and profitability. Supply chain disruptions, including delays in transportation and labor shortages, further complicate the timely delivery of products. Additionally, the burden of adhering to stringent regulatory compliance can create additional operational complexities, necessitating strategic approaches to mitigate these challenges.
Australia Mineral Products Market Trends
A notable trend in the Australia Mineral Products Market is the increasing integration of sustainable practices within production processes. Companies are investing in eco-friendly technologies that not only comply with regulatory demands but also appeal to environmentally conscious consumers. Furthermore, the growth of smart construction methods incorporating advanced materials and technologies is reshaping how mineral products are utilized in the industry.
Australia Mineral Products Market Opportunities
Investment opportunities lie in the development of innovative mineral-based applications tailored to the needs of emerging sectors, such as renewable energy. There is also potential for enhanced cooperation between industry players to streamline supply chains and improve resilience against disruptions. By focusing on sustainable practices and cutting-edge technology, stakeholders can position themselves favorably within this evolving market landscape.
Government Initiatives in the Australia Mineral Products Market
The Australian government actively promotes quality assurance in the mineral products market through various policies and regulations aimed at safeguarding consumer interests. Investments in infrastructure projects reflect a commitment to enhancing the industry while ensuring that manufacturers adhere to health and safety standards. Additionally, government inspections and certification programs bolster compliance, fostering consumer confidence in the quality of mineral products.
Future Insights of the Australia Mineral Products Market
Looking ahead to the 2026-2032 period, the Australia Mineral Products Market is anticipated to evolve significantly. With an enduring focus on infrastructure development and sustainable practices, the market is set to expand its capacity to meet both domestic and international demands. As technological advancements continue to reshape production methods, companies that embrace innovation are likely to thrive, positioning themselves at the forefront of this dynamic landscape.
Australia Mineral Products Market Latest Developments (2025 - 2026)
In recent months, the Australia Mineral Products Market has witnessed a surge in initiatives aimed at fostering innovation and sustainability. Industry stakeholders are increasingly collaborating on research and development projects that prioritize eco-friendly materials and processes. Meanwhile, there is a growing emphasis on adhering to evolving regulatory frameworks, ensuring that products meet the highest standards of safety and quality. This momentum suggests a commitment to adapting to both market demands and environmental responsibilities.
Australia Mineral Products Market - Key Attractiveness of the Report
- 10 Years of Market Numbers
- Historical Data Starting from 2022 to 2025
- Base Year: 2025
- Forecast Data until 2032
- Key Performance Indicators Impacting the Market
- Major Upcoming Developments and Projects
Key Highlights of the Report:
- Australia Mineral Products Market Outlook
- Market Size of Australia Mineral Products Market, 2025
- Forecast of Australia Mineral Products Market, 2032
- Historical Data and Forecast of Australia Mineral Products Revenues & Volume for the Period 2022-2032F
- Australia Mineral Products Market Trend Evolution
- Australia Mineral Products Market Drivers and Challenges
- Australia Mineral Products Price Trends
- Australia Mineral Products Porter's Five Forces
- Australia Mineral Products Industry Life Cycle
- Historical Data and Forecast of Australia Mineral Products Market Revenues & Volume By Types for the Period 2022-2032F
- Historical Data and Forecast of Australia Mineral Products Market Revenues & Volume By Cement and Concrete Product for the Period 2022-2032F
- Historical Data and Forecast of Australia Mineral Products Market Revenues & Volume By Glass and Glass Product for the Period 2022-2032F
- Historical Data and Forecast of Australia Mineral Products Market Revenues & Volume By Other Non-Metallic Mineral Product for the Period 2022-2032F
- Historical Data and Forecast of Australia Mineral Products Market Revenues & Volume By Clay Product and Refractory for the Period 2022-2032F
- Historical Data and Forecast of Australia Mineral Products Market Revenues & Volume By Lime and Gypsum Product for the Period 2022-2032F
- Historical Data and Forecast of Australia Mineral Products Market Revenues & Volume By Applications for the Period 2022-2032F
- Historical Data and Forecast of Australia Mineral Products Market Revenues & Volume By Architecture for the Period 2022-2032F
- Historical Data and Forecast of Australia Mineral Products Market Revenues & Volume By Industry for the Period 2022-2032F
- Historical Data and Forecast of Australia Mineral Products Market Revenues & Volume By Manufacture for the Period 2022-2032F
- Historical Data and Forecast of Australia Mineral Products Market Revenues & Volume By Others for the Period 2022-2032F
- Australia Mineral Products Import Export Trade Statistics
- Market Opportunity Assessment By Types
- Market Opportunity Assessment By Applications
- Australia Mineral Products Top Companies Market Share
- Australia Mineral Products Competitive Benchmarking By Technical and Operational Parameters
- Australia Mineral Products Company Profiles
- Australia Mineral Products Key Strategic Recommendations
Frequently Asked Questions About the Market Study (FAQs):
The Australia Mineral Products Market was estimated at USD 157 Million in 2025, with projections indicating a growth to USD 185 Million by 2032.
Regulatory frameworks ensure product quality and safety, compelling manufacturers to adhere to strict compliance standards, which ultimately enhances consumer confidence.
Urbanization drives demand for construction materials, thereby significantly boosting the market for mineral products, particularly in infrastructure development projects.
Yes, advancements in mineral processing technologies are paving the way for innovative applications, thereby expanding the range of mineral products used across various industries.
Growth is primarily propelled by increased construction activities and the rising demand for mineral-based materials in sectors such as ceramics and manufacturing.
6Wresearch actively monitors the Australia Mineral Products Market and publishes its comprehensive annual report, highlighting emerging trends, growth drivers, revenue analysis, and forecast outlook. Our insights help businesses to make data-backed strategic decisions with ongoing market dynamics. Our analysts track relevent industries related to the Australia Mineral Products Market, allowing our clients with actionable intelligence and reliable forecasts tailored to emerging regional needs.
Yes, we provide customisation as per your requirements. To learn more, feel free to contact us on sales@6wresearch.com
1 Executive Summary |
2 Introduction |
2.1 Key Highlights of the Report |
2.2 Report Description |
2.3 Market Scope & Segmentation |
2.4 Research Methodology |
2.5 Assumptions |
3 Australia Mineral Products Market Overview |
3.1 Australia Country Macro Economic Indicators |
3.2 Australia Mineral Products Market Revenues & Volume, 2022 & 2032F |
3.3 Australia Mineral Products Market - Industry Life Cycle |
3.4 Australia Mineral Products Market - Porter's Five Forces |
3.5 Australia Mineral Products Market Revenues & Volume Share, By Types, 2022 & 2032F |
3.6 Australia Mineral Products Market Revenues & Volume Share, By Applications, 2022 & 2032F |
4 Australia Mineral Products Market Dynamics |
4.1 Impact Analysis |
4.2 Market Drivers |
4.2.1 Increasing demand for minerals in various industries such as construction, manufacturing, and technology. |
4.2.2 Growing investments in mining infrastructure and technology to enhance productivity and efficiency. |
4.2.3 Favorable government policies and regulations supporting the exploration and extraction of mineral resources. |
4.3 Market Restraints |
4.3.1 Environmental concerns and regulations impacting mining operations and exploration activities. |
4.3.2 Volatility in commodity prices affecting the profitability of mineral products. |
4.3.3 Competition from other mineral-producing countries impacting market share and pricing. |
5 Australia Mineral Products Market Trends |
6 Australia Mineral Products Market, By Types |
6.1 Australia Mineral Products Market, By Types |
6.1.1 Overview and Analysis |
6.1.2 Australia Mineral Products Market Revenues & Volume, By Types, 2022-2032F |
6.1.3 Australia Mineral Products Market Revenues & Volume, By Cement and Concrete Product, 2022-2032F |
6.1.4 Australia Mineral Products Market Revenues & Volume, By Glass and Glass Product, 2022-2032F |
6.1.5 Australia Mineral Products Market Revenues & Volume, By Other Non-Metallic Mineral Product, 2022-2032F |
6.1.6 Australia Mineral Products Market Revenues & Volume, By Clay Product and Refractory, 2022-2032F |
6.1.7 Australia Mineral Products Market Revenues & Volume, By Lime and Gypsum Product, 2022-2032F |
6.2 Australia Mineral Products Market, By Applications |
6.2.1 Overview and Analysis |
6.2.2 Australia Mineral Products Market Revenues & Volume, By Architecture, 2022-2032F |
6.2.3 Australia Mineral Products Market Revenues & Volume, By Industry, 2022-2032F |
6.2.4 Australia Mineral Products Market Revenues & Volume, By Manufacture, 2022-2032F |
6.2.5 Australia Mineral Products Market Revenues & Volume, By Others, 2022-2032F |
7 Australia Mineral Products Market Import-Export Trade Statistics |
7.1 Australia Mineral Products Market Export to Major Countries |
7.2 Australia Mineral Products Market Imports from Major Countries |
8 Australia Mineral Products Market Key Performance Indicators |
8.1 Exploration expenditure in mineral resources. |
8.2 Investment in mining technology and innovation. |
8.3 Number of mining projects approved and initiated in Australia. |
9 Australia Mineral Products Market - Opportunity Assessment |
9.1 Australia Mineral Products Market Opportunity Assessment, By Types, 2022 & 2032F |
9.2 Australia Mineral Products Market Opportunity Assessment, By Applications, 2022 & 2032F |
10 Australia Mineral Products Market - Competitive Landscape |
10.1 Australia Mineral Products Market Revenue Share, By Companies, 2025 |
10.2 Australia Mineral Products Market Competitive Benchmarking, By Operating and Technical Parameters |
11 Company Profiles |
12 Recommendations |
13 Disclaimer |
Global Go To Market Strategy - 2030
Export potential enables firms to identify high-growth global markets with greater confidence by combining advanced trade intelligence with a structured quantitative methodology. The framework analyzes emerging demand trends and country-level import patterns while integrating macroeconomic and trade datasets such as GDP and population forecasts, bilateral import–export flows, tariff structures, elasticity differentials between developed and developing economies, geographic distance, and import demand projections. Using weighted trade values from 2020–2024 as the base period to project country-to-country export potential for 2030, these inputs are operationalized through calculated drivers such as gravity model parameters, tariff impact factors, and projected GDP per-capita growth. Through an analysis of hidden potentials, demand hotspots, and market conditions that are most favorable to success, this method enables firms to focus on target countries, maximize returns, and global expansion with data, backed by accuracy.
By factoring in the projected importer demand gap that is currently unmet and could be potential opportunity, it identifies the potential for the Exporter (Country) among 190 countries, against the general trade analysis, which identifies the biggest importer or exporter.
To discover high-growth global markets and optimize your business strategy:
Click Here
Pricing
- Single User License$ 1,995
- Department License$ 2,400
- Site License$ 3,120
- Global License$ 3,795

Leadership Perspectives from Industry Events
Search
Thought Leadership and Analyst Meet


Our Clients
6WResearch In News
- India Air Conditioner Market Set for Strong Rebound in 2026 After Weather-Led Correction and GST-Driven Recovery: 6Wresearch
- ADAS in India: How Automatic Emergency Braking, Blind Spot Detection & Driver Monitoring are Transforming Road Safety
- Doha a strategic location for EV manufacturing hub: IPA Qatar
- Demand for luxury TVs surging in the GCC, says Samsung
- Empowering Growth: The Thriving Journey of Bangladesh’s Cable Industry
- Demand for luxury TVs surging in the GCC, says Samsung
Latest Reports
- Nicaragua RPG Gaming Market (2026-2032)
- New Zealand RPG Gaming Market (2026-2032)
- Netherlands RPG Gaming Market (2026-2032)
- Nauru RPG Gaming Market (2026-2032)
- Namibia RPG Gaming Market (2026-2032)
- Mozambique RPG Gaming Market (2026-2032)
- Montenegro RPG Gaming Market (2026-2032)
- Mongolia RPG Gaming Market (2026-2032)
- Monaco RPG Gaming Market (2026-2032)
- Micronesia RPG Gaming Market (2026-2032)
Industry Events and Analyst Meet

EV India Expo 2026

HIMTEX 2026

India Refining Summit 2026

India EV Show 2026

EV tech India Expo 2026
Whitepaper
- Middle East & Africa Commercial Security Market Click here to view more.
- Middle East & Africa Fire Safety Systems & Equipment Market Click here to view more.
- GCC Drone Market Click here to view more.
- Middle East Lighting Fixture Market Click here to view more.
- GCC Physical & Perimeter Security Market Click here to view more.