Australia Motorcycle Drive Chain Market (2026-2032) | Companies, Share, Outlook, Value, Trends, Size & Revenue, Analysis, Competitive Landscape, Forecast, Growth, Segmentation, Industry
Market Forecast By Types (Standard, Cruiser, Sports, Off-Road), By Chain type (Standard Rolling Chain, O Ring Chain, X Ring Chain), By Engine Capacity (Up to 150 CC, 151-300 CC, 301-500 CC, Above 500 CC), By Material Type (Mild Steel, Cast Steel, Cast Iron), By Distribution Channel (Online, Offline) And Competitive Landscape
| Product Code: ETC6185616 | Publication Date: Sep 2024 | Updated Date: Mar 2026 | Product Type: Market Research Report | |
| Publisher: 6Wresearch | Author: Shubham Padhi | No. of Pages: 75 | No. of Figures: 35 | No. of Tables: 20 |
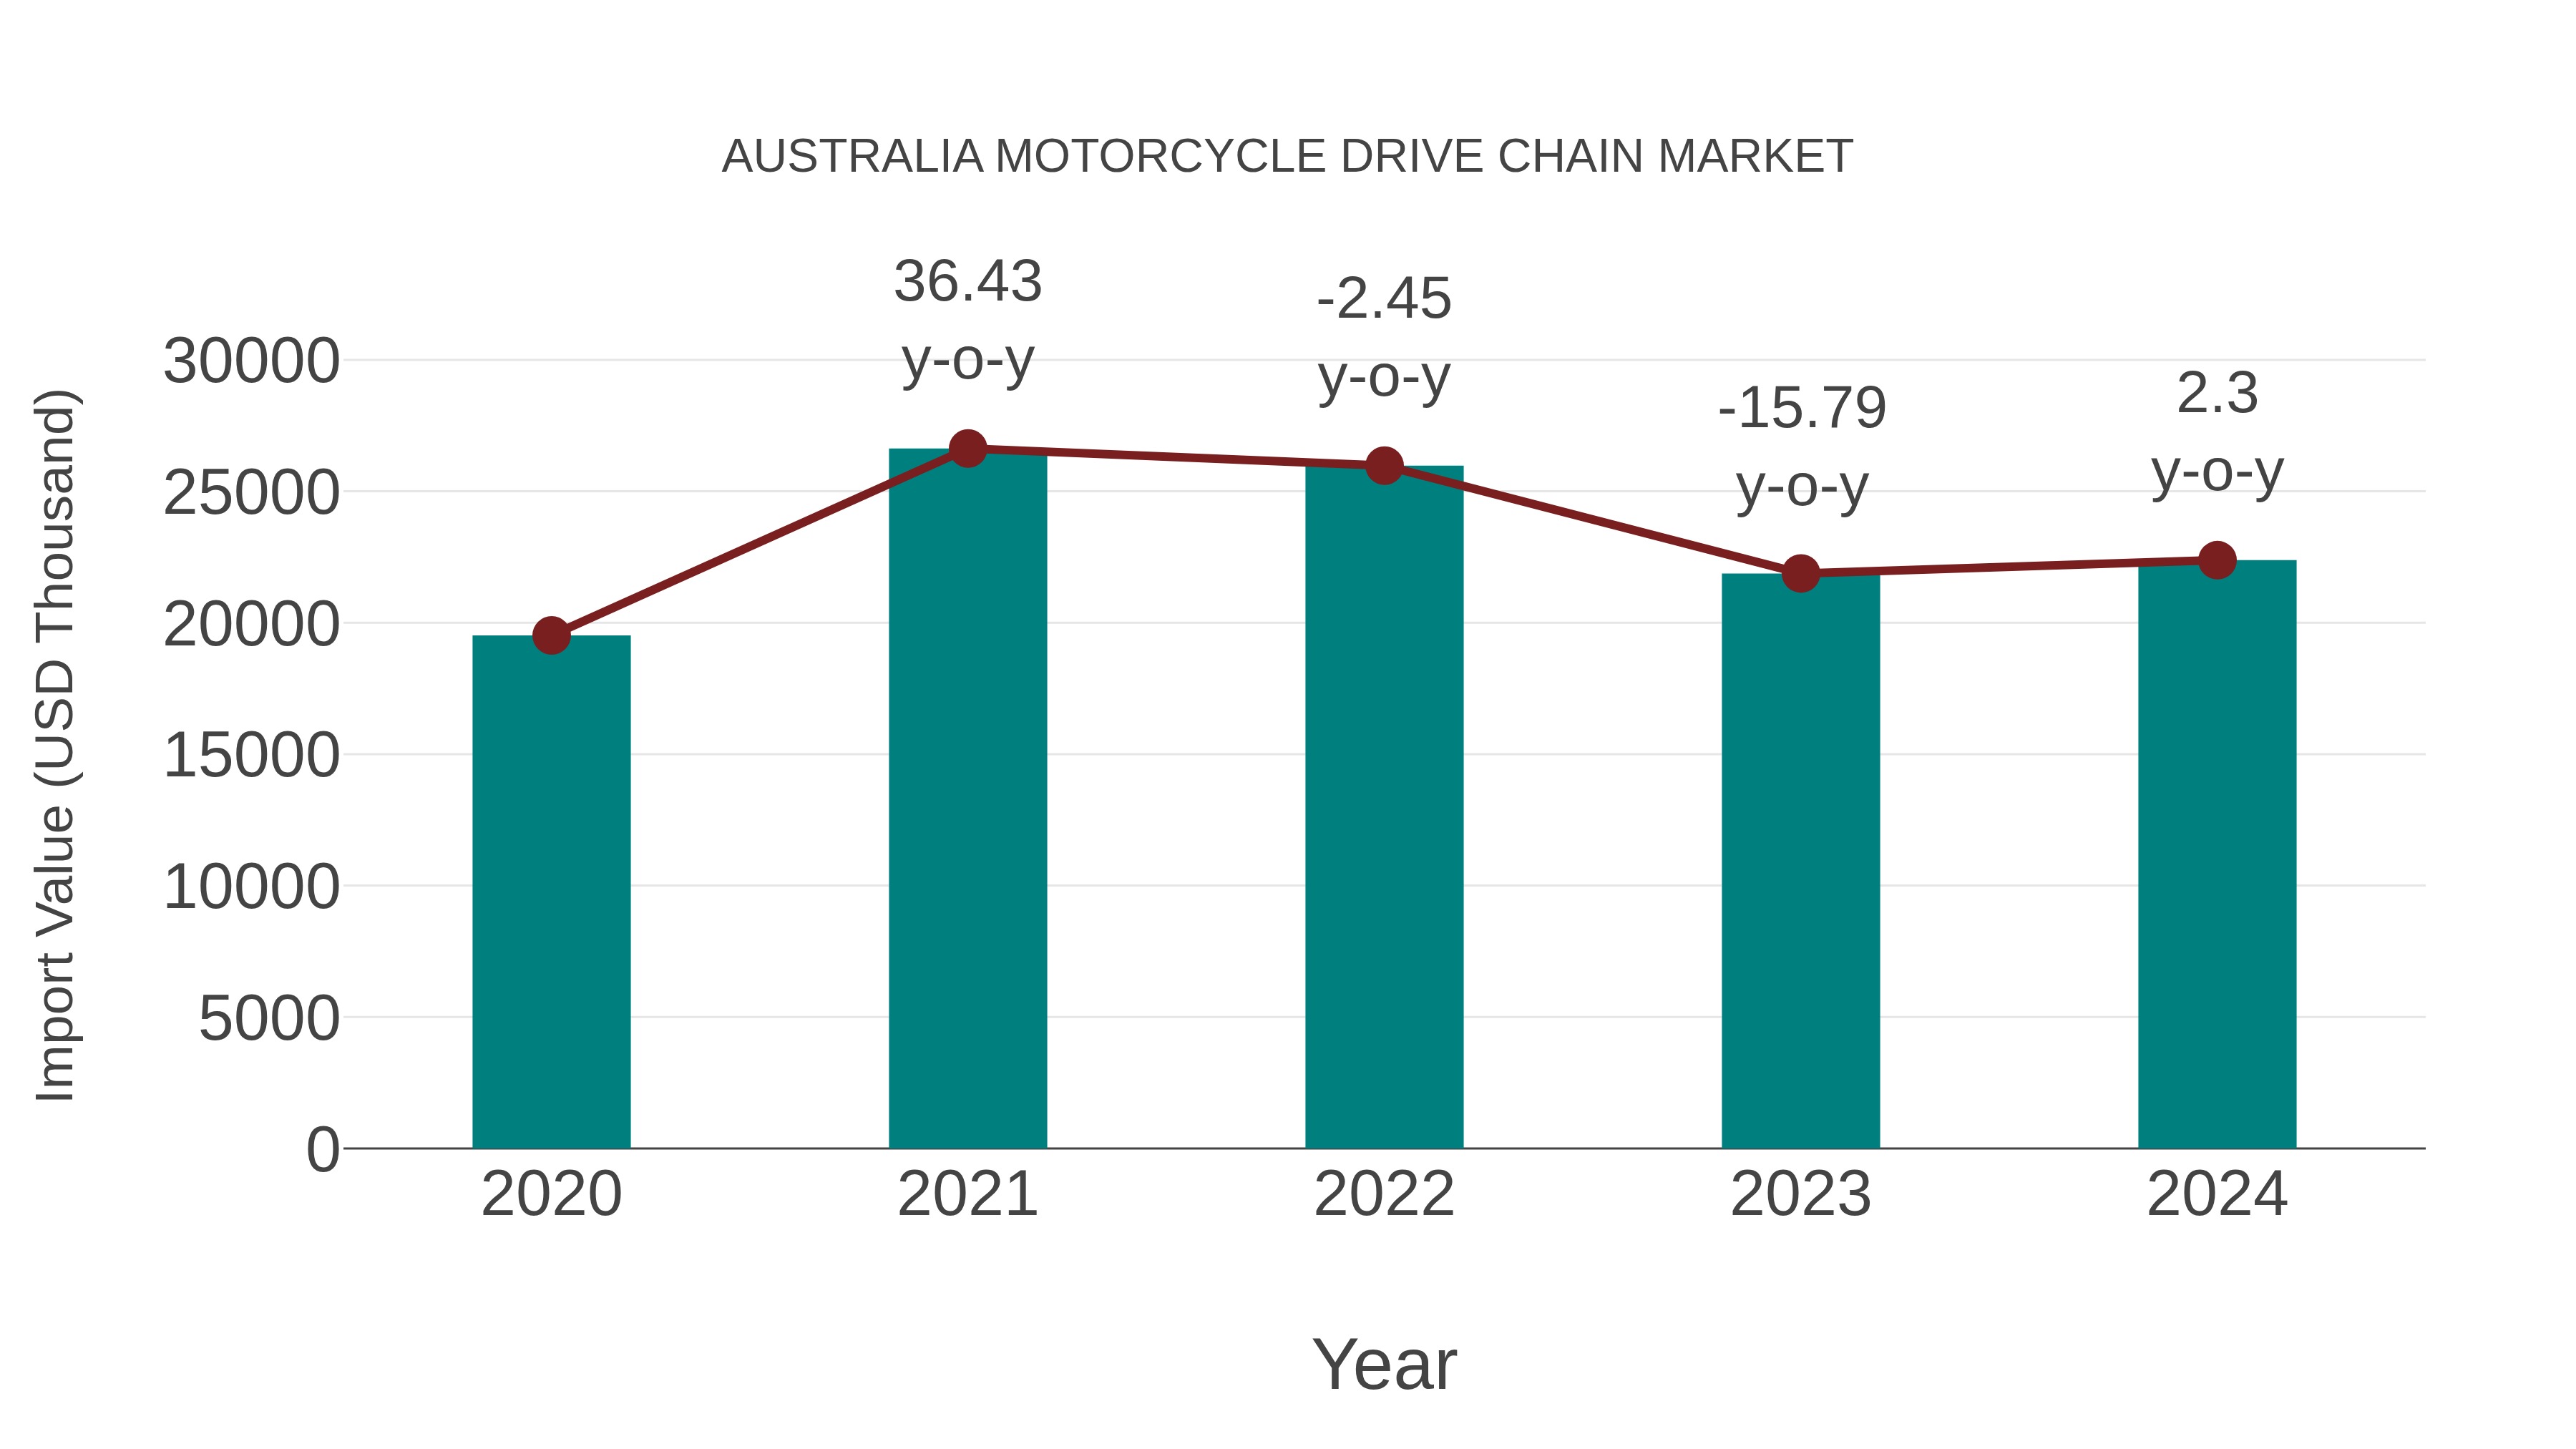
Australia Motorcycle Drive Chain Market: Import Trend Analysis
In the Australia motorcycle drive chain market, the import trend experienced a growth rate of 2.3% from 2023 to 2024, with a compound annual growth rate (CAGR) of 3.48% for the period 2020-2024. This growth can be attributed to a steady demand shift towards higher-quality drive chains, reflecting market stability and consumer preference for durable products.
Australia Motorcycle Drive Chain Market Overview
The motorcycle drive chain market in Australia parallels the sprocket market, emphasizing power transmission, performance, and longevity. Riders in Australia, especially those using motorcycles for long-distance touring or off-road purposes, demand high-quality drive chains. Technological developments in sealed chains (like O-ring and X-ring types) are gaining traction, offering reduced maintenance and extended lifespan. Aftermarket customization and brand loyalty also influence consumer purchasing behavior in this sector.
Trends of the market
This market is benefiting from the increase in commuter and recreational motorcycle usage. Innovations in chain coatings (such as X-ring and O-ring chains) to extend durability and reduce maintenance are key trends. DIY culture is growing, with riders performing their own maintenance and upgrades. The market also sees a demand for drive chains compatible with electric motorcycles, aligning with the slow but rising adoption of EV bikes in urban centers.
Challenges of the market
The motorcycle drive chain market in Australia contends with issues similar to the chain sprocket market, including product longevity and growing competition from belt and shaft drive alternatives. Fluctuations in raw material prices impact manufacturing costs, while aftermarket sales are limited by low consumer engagement and understanding. Maintenance requirements and proper installation challenges often lead consumers to seek professional services rather than making regular purchases themselves, limiting DIY market growth.
Investment opportunities in the Market
The motorcycle drive chain market invites investment in both OEM and aftermarket segments. Setting up local manufacturing or assembly plants to reduce import dependency is a key opportunity. With rising consumer interest in motorcycle customization, companies offering premium or color-custom drive chains can carve out a niche. E-commerce platforms specializing in two-wheeler parts also provide a high-growth, low-capex investment route.
Government Policy of the market
The Australian government`s regulations surrounding vehicle safety and maintenance also impact the motorcycle drive chain market. There are specific standards for vehicle parts that ensure they meet safety criteria, including drive chains. The governments policies on environmental protection may lead to increased scrutiny of the manufacturing and disposal processes of vehicle components. The market also faces challenges due to import duties and taxes that increase the cost of replacement parts for consumers. Regulations regarding the durability and performance of these components may influence manufacturers production standards.
Key Highlights of the Report:
- Australia Motorcycle Drive Chain Market Outlook
- Market Size of Australia Motorcycle Drive Chain Market, 2025
- Forecast of Australia Motorcycle Drive Chain Market, 2032
- Historical Data and Forecast of Australia Motorcycle Drive Chain Revenues & Volume for the Period 2022 - 2032F
- Australia Motorcycle Drive Chain Market Trend Evolution
- Australia Motorcycle Drive Chain Market Drivers and Challenges
- Australia Motorcycle Drive Chain Price Trends
- Australia Motorcycle Drive Chain Porter's Five Forces
- Australia Motorcycle Drive Chain Industry Life Cycle
- Historical Data and Forecast of Australia Motorcycle Drive Chain Market Revenues & Volume By Types for the Period 2022 - 2032F
- Historical Data and Forecast of Australia Motorcycle Drive Chain Market Revenues & Volume By Standard for the Period 2022 - 2032F
- Historical Data and Forecast of Australia Motorcycle Drive Chain Market Revenues & Volume By Cruiser for the Period 2022 - 2032F
- Historical Data and Forecast of Australia Motorcycle Drive Chain Market Revenues & Volume By Sports for the Period 2022 - 2032F
- Historical Data and Forecast of Australia Motorcycle Drive Chain Market Revenues & Volume By Off-Road for the Period 2022 - 2032F
- Historical Data and Forecast of Australia Motorcycle Drive Chain Market Revenues & Volume By Chain type for the Period 2022 - 2032F
- Historical Data and Forecast of Australia Motorcycle Drive Chain Market Revenues & Volume By Standard Rolling Chain for the Period 2022 - 2032F
- Historical Data and Forecast of Australia Motorcycle Drive Chain Market Revenues & Volume By O Ring Chain for the Period 2022 - 2032F
- Historical Data and Forecast of Australia Motorcycle Drive Chain Market Revenues & Volume By X Ring Chain for the Period 2022 - 2032F
- Historical Data and Forecast of Australia Motorcycle Drive Chain Market Revenues & Volume By Engine Capacity for the Period 2022 - 2032F
- Historical Data and Forecast of Australia Motorcycle Drive Chain Market Revenues & Volume By Up to 150 CC for the Period 2022 - 2032F
- Historical Data and Forecast of Australia Motorcycle Drive Chain Market Revenues & Volume By 151-300 CC for the Period 2022 - 2032F
- Historical Data and Forecast of Australia Motorcycle Drive Chain Market Revenues & Volume By 301-500 CC for the Period 2022 - 2032F
- Historical Data and Forecast of Australia Motorcycle Drive Chain Market Revenues & Volume By Above 500 CC for the Period 2022 - 2032F
- Historical Data and Forecast of Australia Motorcycle Drive Chain Market Revenues & Volume By Material Type for the Period 2022 - 2032F
- Historical Data and Forecast of Australia Motorcycle Drive Chain Market Revenues & Volume By Mild Steel for the Period 2022 - 2032F
- Historical Data and Forecast of Australia Motorcycle Drive Chain Market Revenues & Volume By Cast Steel for the Period 2022 - 2032F
- Historical Data and Forecast of Australia Motorcycle Drive Chain Market Revenues & Volume By Cast Iron for the Period 2022 - 2032F
- Historical Data and Forecast of Australia Motorcycle Drive Chain Market Revenues & Volume By Distribution Channel for the Period 2022 - 2032F
- Historical Data and Forecast of Australia Motorcycle Drive Chain Market Revenues & Volume By Online for the Period 2022 - 2032F
- Historical Data and Forecast of Australia Motorcycle Drive Chain Market Revenues & Volume By Offline for the Period 2022 - 2032F
- Australia Motorcycle Drive Chain Import Export Trade Statistics
- Market Opportunity Assessment By Types
- Market Opportunity Assessment By Chain type
- Market Opportunity Assessment By Engine Capacity
- Market Opportunity Assessment By Material Type
- Market Opportunity Assessment By Distribution Channel
- Australia Motorcycle Drive Chain Top Companies Market Share
- Australia Motorcycle Drive Chain Competitive Benchmarking By Technical and Operational Parameters
- Australia Motorcycle Drive Chain Company Profiles
- Australia Motorcycle Drive Chain Key Strategic Recommendations
Australia Motorcycle Drive Chain Market (2026-2032): FAQs
6Wresearch actively monitors the Australia Motorcycle Drive Chain Market and publishes its comprehensive annual report, highlighting emerging trends, growth drivers, revenue analysis, and forecast outlook. Our insights help businesses to make data-backed strategic decisions with ongoing market dynamics. Our analysts track relevent industries related to the Australia Motorcycle Drive Chain Market, allowing our clients with actionable intelligence and reliable forecasts tailored to emerging regional needs.
Yes, we provide customisation as per your requirements. To learn more, feel free to contact us on sales@6wresearch.com
1 Executive Summary |
2 Introduction |
2.1 Key Highlights of the Report |
2.2 Report Description |
2.3 Market Scope & Segmentation |
2.4 Research Methodology |
2.5 Assumptions |
3 Australia Motorcycle Drive Chain Market Overview |
3.1 Australia Country Macro Economic Indicators |
3.2 Australia Motorcycle Drive Chain Market Revenues & Volume, 2022 & 2032F |
3.3 Australia Motorcycle Drive Chain Market - Industry Life Cycle |
3.4 Australia Motorcycle Drive Chain Market - Porter's Five Forces |
3.5 Australia Motorcycle Drive Chain Market Revenues & Volume Share, By Types, 2022 & 2032F |
3.6 Australia Motorcycle Drive Chain Market Revenues & Volume Share, By Chain type, 2022 & 2032F |
3.7 Australia Motorcycle Drive Chain Market Revenues & Volume Share, By Engine Capacity, 2022 & 2032F |
3.8 Australia Motorcycle Drive Chain Market Revenues & Volume Share, By Material Type, 2022 & 2032F |
3.9 Australia Motorcycle Drive Chain Market Revenues & Volume Share, By Distribution Channel, 2022 & 2032F |
4 Australia Motorcycle Drive Chain Market Dynamics |
4.1 Impact Analysis |
4.2 Market Drivers |
4.2.1 Increasing demand for motorcycles in Australia |
4.2.2 Growing popularity of motorcycling as a recreational activity |
4.2.3 Technological advancements in drive chain materials and design |
4.3 Market Restraints |
4.3.1 Fluctuating raw material prices affecting production costs |
4.3.2 Competition from alternative technologies like belt drives |
4.3.3 Regulatory changes impacting manufacturing processes |
5 Australia Motorcycle Drive Chain Market Trends |
6 Australia Motorcycle Drive Chain Market, By Types |
6.1 Australia Motorcycle Drive Chain Market, By Types |
6.1.1 Overview and Analysis |
6.1.2 Australia Motorcycle Drive Chain Market Revenues & Volume, By Types, 2022 - 2032F |
6.1.3 Australia Motorcycle Drive Chain Market Revenues & Volume, By Standard, 2022 - 2032F |
6.1.4 Australia Motorcycle Drive Chain Market Revenues & Volume, By Cruiser, 2022 - 2032F |
6.1.5 Australia Motorcycle Drive Chain Market Revenues & Volume, By Sports, 2022 - 2032F |
6.1.6 Australia Motorcycle Drive Chain Market Revenues & Volume, By Off-Road, 2022 - 2032F |
6.2 Australia Motorcycle Drive Chain Market, By Chain type |
6.2.1 Overview and Analysis |
6.2.2 Australia Motorcycle Drive Chain Market Revenues & Volume, By Standard Rolling Chain, 2022 - 2032F |
6.2.3 Australia Motorcycle Drive Chain Market Revenues & Volume, By O Ring Chain, 2022 - 2032F |
6.2.4 Australia Motorcycle Drive Chain Market Revenues & Volume, By X Ring Chain, 2022 - 2032F |
6.3 Australia Motorcycle Drive Chain Market, By Engine Capacity |
6.3.1 Overview and Analysis |
6.3.2 Australia Motorcycle Drive Chain Market Revenues & Volume, By Up to 150 CC, 2022 - 2032F |
6.3.3 Australia Motorcycle Drive Chain Market Revenues & Volume, By 151-300 CC, 2022 - 2032F |
6.3.4 Australia Motorcycle Drive Chain Market Revenues & Volume, By 301-500 CC, 2022 - 2032F |
6.3.5 Australia Motorcycle Drive Chain Market Revenues & Volume, By Above 500 CC, 2022 - 2032F |
6.4 Australia Motorcycle Drive Chain Market, By Material Type |
6.4.1 Overview and Analysis |
6.4.2 Australia Motorcycle Drive Chain Market Revenues & Volume, By Mild Steel, 2022 - 2032F |
6.4.3 Australia Motorcycle Drive Chain Market Revenues & Volume, By Cast Steel, 2022 - 2032F |
6.4.4 Australia Motorcycle Drive Chain Market Revenues & Volume, By Cast Iron, 2022 - 2032F |
6.5 Australia Motorcycle Drive Chain Market, By Distribution Channel |
6.5.1 Overview and Analysis |
6.5.2 Australia Motorcycle Drive Chain Market Revenues & Volume, By Online, 2022 - 2032F |
6.5.3 Australia Motorcycle Drive Chain Market Revenues & Volume, By Offline, 2022 - 2032F |
7 Australia Motorcycle Drive Chain Market Import-Export Trade Statistics |
7.1 Australia Motorcycle Drive Chain Market Export to Major Countries |
7.2 Australia Motorcycle Drive Chain Market Imports from Major Countries |
8 Australia Motorcycle Drive Chain Market Key Performance Indicators |
8.1 Average lifespan of motorcycle drive chains in Australia |
8.2 Adoption rate of innovative drive chain technologies in the market |
8.3 Percentage of motorcycles in Australia using drive chains vs. other transmission systems |
9 Australia Motorcycle Drive Chain Market - Opportunity Assessment |
9.1 Australia Motorcycle Drive Chain Market Opportunity Assessment, By Types, 2022 & 2032F |
9.2 Australia Motorcycle Drive Chain Market Opportunity Assessment, By Chain type, 2022 & 2032F |
9.3 Australia Motorcycle Drive Chain Market Opportunity Assessment, By Engine Capacity, 2022 & 2032F |
9.4 Australia Motorcycle Drive Chain Market Opportunity Assessment, By Material Type, 2022 & 2032F |
9.5 Australia Motorcycle Drive Chain Market Opportunity Assessment, By Distribution Channel, 2022 & 2032F |
10 Australia Motorcycle Drive Chain Market - Competitive Landscape |
10.1 Australia Motorcycle Drive Chain Market Revenue Share, By Companies, 2025 |
10.2 Australia Motorcycle Drive Chain Market Competitive Benchmarking, By Operating and Technical Parameters |
11 Company Profiles |
12 Recommendations |
13 Disclaimer |
Export potential assessment - trade Analytics for 2030
Export potential enables firms to identify high-growth global markets with greater confidence by combining advanced trade intelligence with a structured quantitative methodology. The framework analyzes emerging demand trends and country-level import patterns while integrating macroeconomic and trade datasets such as GDP and population forecasts, bilateral import–export flows, tariff structures, elasticity differentials between developed and developing economies, geographic distance, and import demand projections. Using weighted trade values from 2020–2024 as the base period to project country-to-country export potential for 2030, these inputs are operationalized through calculated drivers such as gravity model parameters, tariff impact factors, and projected GDP per-capita growth. Through an analysis of hidden potentials, demand hotspots, and market conditions that are most favorable to success, this method enables firms to focus on target countries, maximize returns, and global expansion with data, backed by accuracy.
By factoring in the projected importer demand gap that is currently unmet and could be potential opportunity, it identifies the potential for the Exporter (Country) among 190 countries, against the general trade analysis, which identifies the biggest importer or exporter.
To discover high-growth global markets and optimize your business strategy:
Click Here
Pricing
- Single User License$ 1,995
- Department License$ 2,400
- Site License$ 3,120
- Global License$ 3,795

Search
Thought Leadership and Analyst Meet


Our Clients
Latest Reports
- India Electromagnetic Bulk Flow Meter Market (2026-2032) | Analysis, Challenges, Strategic Insights, Supply, Forecast, Growth, Share, Consumer Insights, Competitive, Value, Outlook, Size & Demand,
- India Battery Powered Bulk Flow Meter Market (2026-2032) | Outlook, Analysis, Competitive Landscape, Growth, Size, Trends, Value, Revenue, Companies, Segmentation, Share & Forecast
- Bosnia and Herzegovina Fuel-Efficient Winglets Market (2026-2032) | Growth, Competition, Strategy, Restraints, Trends, Challenges, segmentation, Value, Outlook, Investment Opportunities, Analysis, Revenue, Companies, Insights, Pricing, Size, Drivers, Demand, Share, Forecast
- Canada Cloud CFD Market (2026-2032) | Size & Revenue, Industry, Growth, Competitive Landscape, Forecast, Segmentation, Value, Outlook, Trends, Share, Analysis, Companies
- Taiwan Food Delivery Platform Market (2026-2032) | Companies, Outlook, Analysis, Trends, Value, Revenue, Segmentation, Share, Forecast, Competitive Landscape, Growth, Size & Forecast
- United Kingdom (UK) Long-term Care Insurance Market (2026-2032) | Growth, Share, Consumer Insights, Drivers, Opportunities, Competition, Pricing Analysis, Segments, Restraints, Companies, Competitive, Value, Outlook, Size, Demand, Analysis, Challenges, Strategic Insights, Investment Trends, Revenue, Trends, Supply, Forecast
- United Kingdom (UK) Long Term Care Market (2026-2032) | Companies, Outlook, Analysis, Trends, Value, Revenue, Segmentation, Share, Forecast, Competitive Landscape, Growth, Size & Forecast
- Iraq Insulation and Waterproofing Market (2026-2032) | Outlook, Drivers, Growth, Size, Share, Industry, Revenue, Trends, Demand, Competitive, Strategic Insights, Opportunities, Segments, Companies, Challenges, Strategy, Consumer Insights, Analysis, Investment Trends, Value, Segmentation, Forecast, Restraints
- India Switchgear Market Outlook (2026-2032) | Size, Share, Trends, Growth, Revenue, Forecast, Analysis, Value, Outlook
- Pakistan Contraceptive Implants Market (2025-2031) | Demand, Growth, Size, Share, Industry, Pricing Analysis, Competitive, Strategic Insights, Strategy, Consumer Insights, Analysis, Investment Trends, Opportunities, Revenue, Segments, Value, Segmentation, Supply, Forecast, Restraints, Outlook, Competition, Drivers, Trends, Companies, Challenges
Industry Events and Analyst Meet

India EV Show 2026

EV tech India Expo 2026

Auto Tech Asia 2026

Battery Tech India 2026

Smart Production Solutions Guangzhou 2026
Whitepaper
- Middle East & Africa Commercial Security Market Click here to view more.
- Middle East & Africa Fire Safety Systems & Equipment Market Click here to view more.
- GCC Drone Market Click here to view more.
- Middle East Lighting Fixture Market Click here to view more.
- GCC Physical & Perimeter Security Market Click here to view more.
6WResearch In News
- Doha a strategic location for EV manufacturing hub: IPA Qatar
- Demand for luxury TVs surging in the GCC, says Samsung
- Empowering Growth: The Thriving Journey of Bangladesh’s Cable Industry
- Demand for luxury TVs surging in the GCC, says Samsung
- Video call with a traditional healer? Once unthinkable, it’s now common in South Africa
- Intelligent Buildings To Smooth GCC’s Path To Net Zero