Australia Oily Waste Can Market (2026-2032) | Outlook, Growth, Segmentation, Forecast, Analysis, Industry, Size & Revenue, Trends, Share, Competitive Landscape, Value, Companies
Market Forecast By Material Type (Steel, Plastic), By Lid Type (Foot Operated Self Closing, Hand Operated Self Closing), By Capacity (Up to 10 Gallon, 11 to 15 Gallon, 16 to 20 Gallon, Above 20 Gallon), By End User (Auto Repairs Shops, Warehouse Facilities, Construction Site, Marinas, Machine Shops, Printing Operations, Furniture Refinishers, Manufacturing Plants) And Competitive Landscape
| Product Code: ETC6186709 | Publication Date: Sep 2024 | Updated Date: Mar 2026 | Product Type: Market Research Report | |
| Publisher: 6Wresearch | Author: Sachin Kumar Rai | No. of Pages: 75 | No. of Figures: 35 | No. of Tables: 20 |
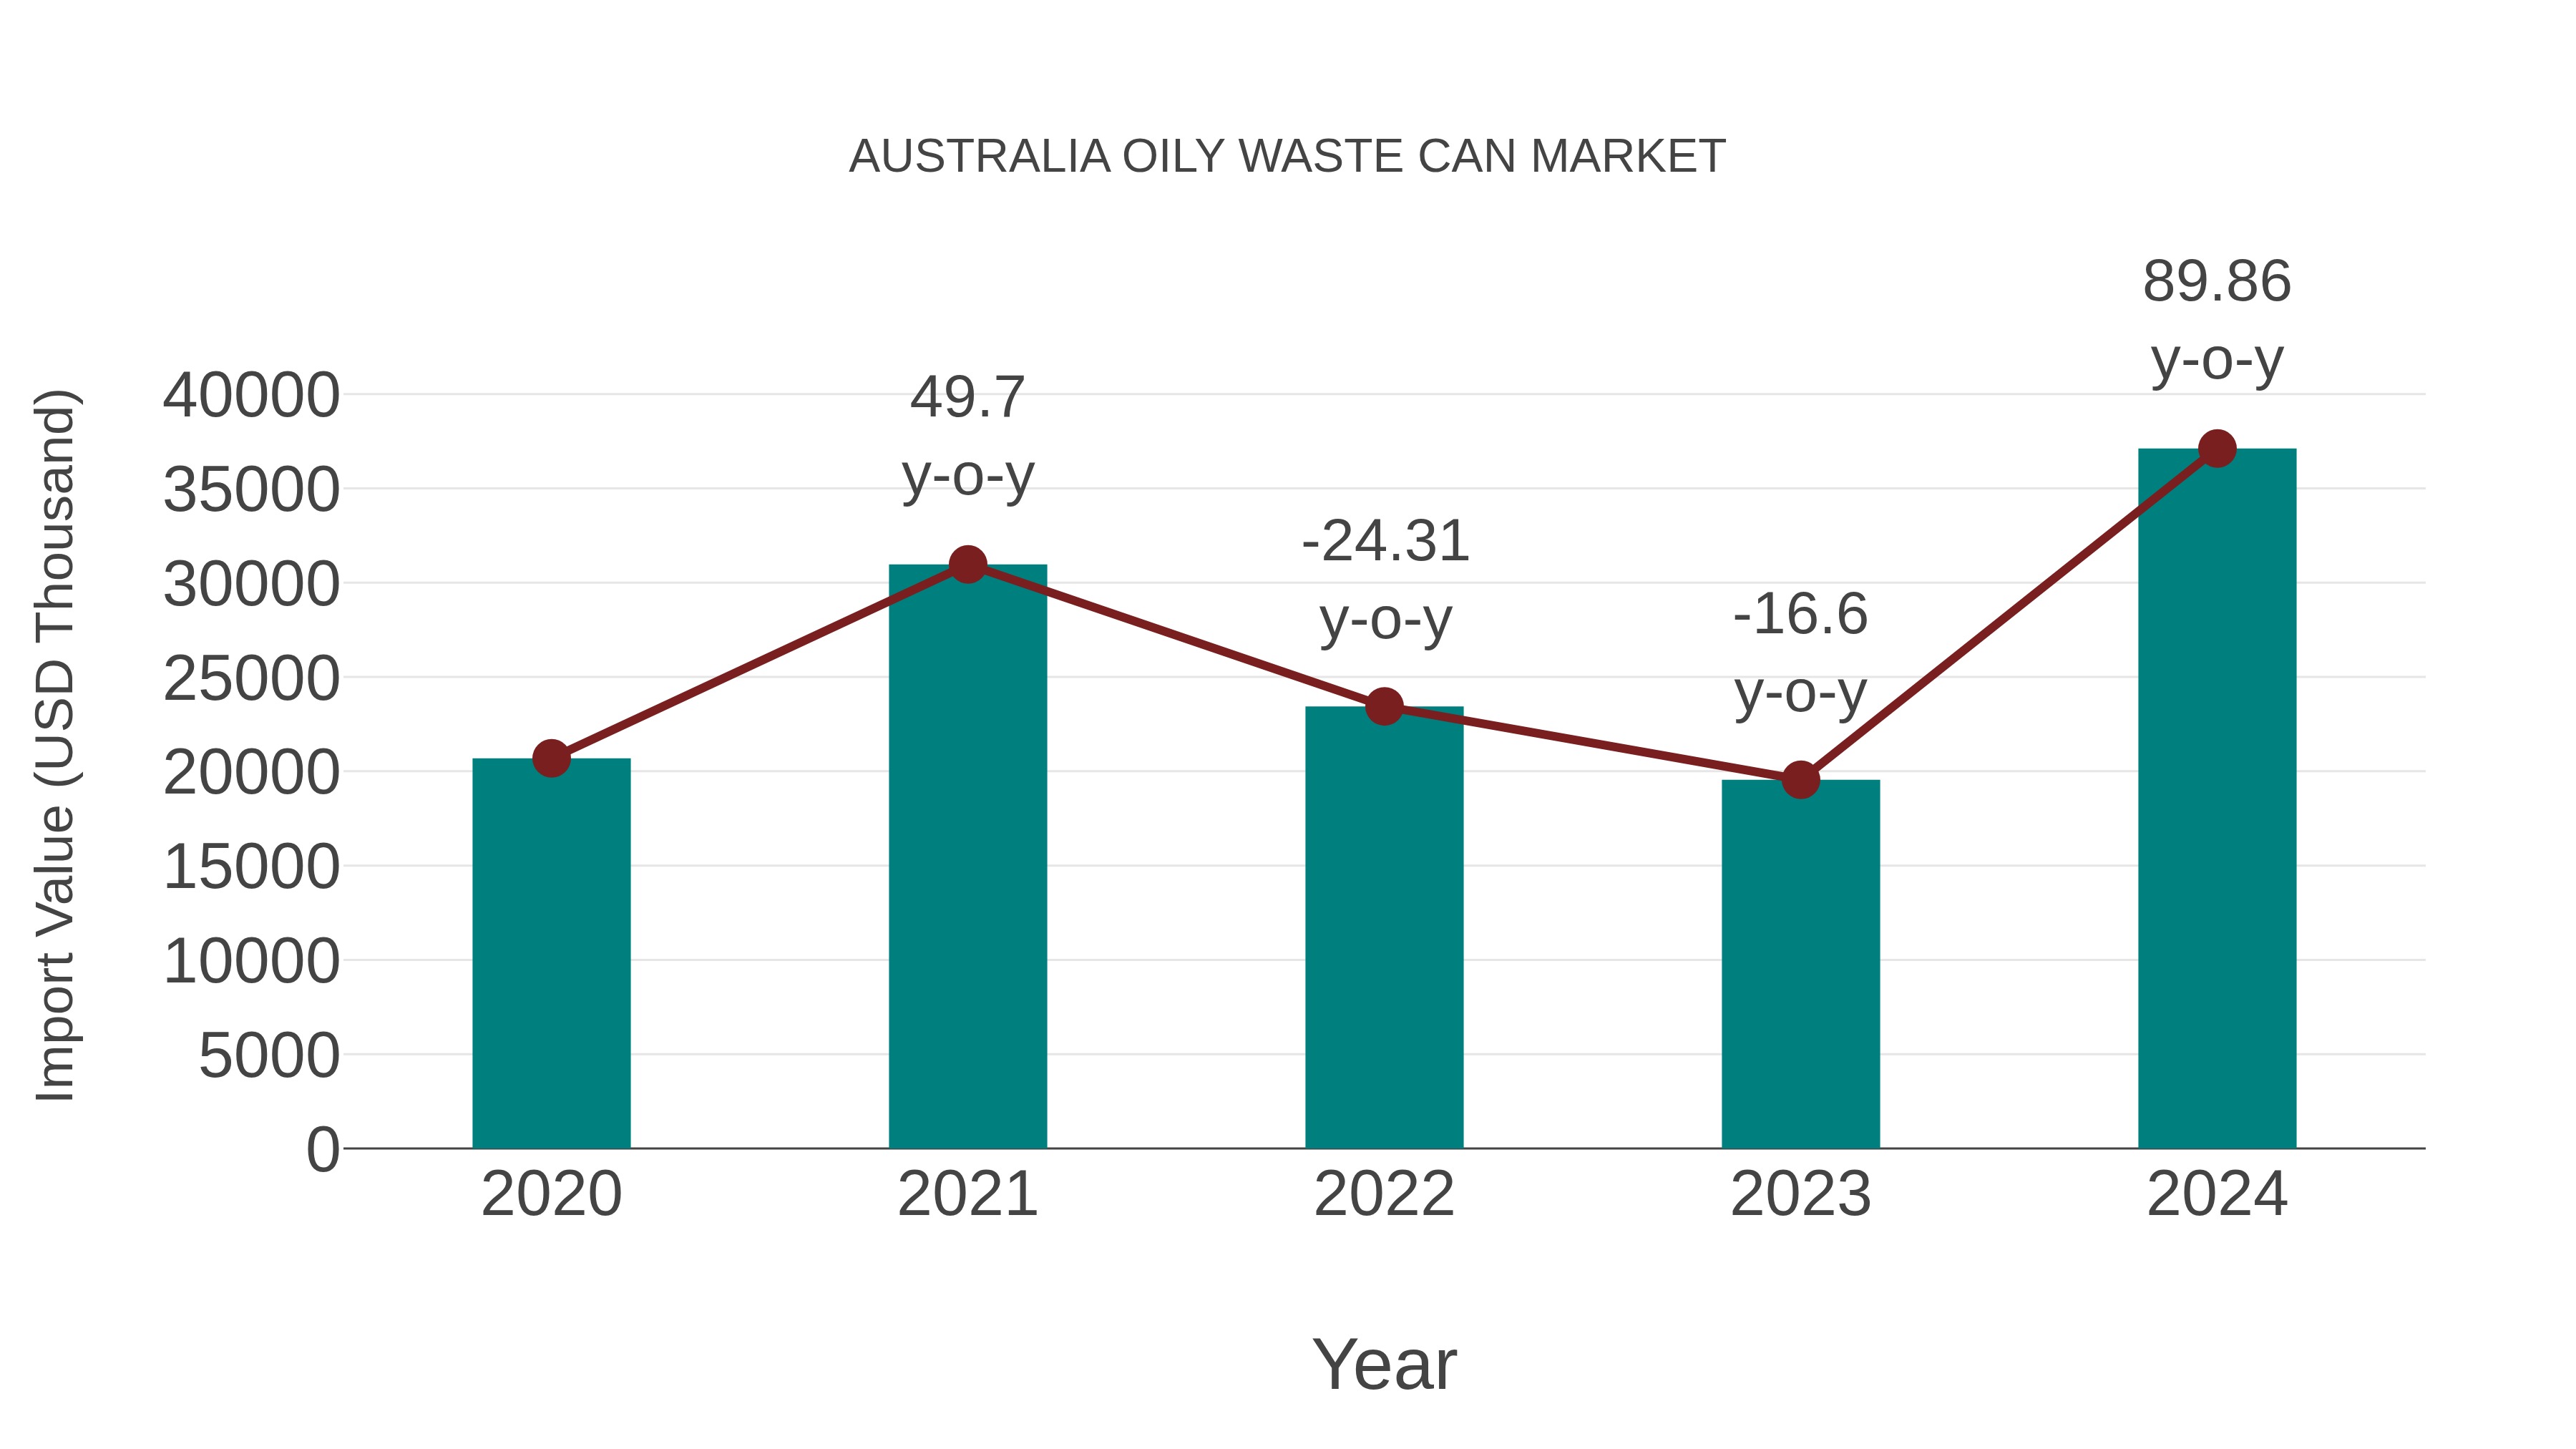
Australia Oily Waste Can Market: Import Trend Analysis
Australia`s import trend for the Australian oily waste can market showed significant growth from 2023 to 2024, with a growth rate of 89.86%. The compound annual growth rate (CAGR) for the period 2020-2024 stood at 15.73%. This surge in import momentum can be attributed to increased demand for sustainable packaging solutions and a shift towards environmentally friendly practices in the market.
Australia Oily Waste Can Market Overview
The oily waste can market in Australia serves a crucial role in workplace safety and hazardous waste management, especially in industries like manufacturing, automotive, and oil & gas. These cans are designed to reduce fire risks by safely storing cloths, rags, or materials soaked in flammable liquids. Demand is driven by regulatory compliance under occupational safety standards, encouraging businesses to maintain clean and safe environments. The market includes both industrial-grade and compact solutions for commercial use. There is a gradual shift towards more durable and corrosion-resistant materials such as galvanized steel and powder-coated finishes. Sustainability goals are also influencing manufacturers to offer recyclable or eco-friendly alternatives.
Trends of the market
The oily waste can market in Australia is experiencing growth as industries that generate oil waste, such as automotive, manufacturing, and oil and gas sectors, seek safe and efficient ways to dispose of or store hazardous waste. Oily waste cans are essential for managing used oils, solvents, and other industrial liquids, ensuring that they are disposed of in an environmentally friendly manner. With increasing regulatory pressures on waste management and environmental safety, industries are turning to specialized containers that are designed to prevent leakage and contamination. The market is also witnessing innovations in waste storage materials, with a focus on durability, ease of use, and compliance with stringent waste disposal regulations.
Challenges of the market
Australias oily waste can market must navigate increasingly strict workplace safety and environmental regulations. Manufacturing cans that are both affordable and compliant with new fire safety standards is technically demanding. Public and industrial awareness about the importance of safe oily waste disposal remains low, limiting market expansion. Cheaper imported alternatives put pricing pressure on domestic manufacturers. Furthermore, fluctuating steel prices affect production costs and margins.
Investment opportunities in the Market
As environmental regulations tighten across Australia, the demand for compliant oily waste containment solutions is increasing, especially in manufacturing, automotive, and industrial sectors. Oily waste cans help manage hazardous materials and fire risks, creating an essential niche for safety equipment suppliers. Investors can explore opportunities in manufacturing high-durability, regulatory-compliant containment units and supplying them to industries with waste management needs. There is also potential for integrating smart monitoring systems for full-service waste management solutions. Partnerships with waste management firms can help scale operations across multiple industries. The rise in industrial safety awareness makes this a practical investment with growing necessity.
Government Policy of the market
The Australian government enforces stringent regulations on the management of oily waste to ensure environmental safety and workplace health. Facilities handling oily waste are required to comply with the Environment Protection and Biodiversity Conservation Act 1999, which mandates proper storage and disposal to prevent soil and water contamination. Workplace safety standards, under the Work Health and Safety Act 2011, dictate the use of certified containers for storing oily waste to minimize fire hazards and exposure risks. The National Waste Policy provides a framework for waste reduction and promotes the use of reusable and safe containers for hazardous waste. Additionally, the government encourages industries to adopt best practices in waste segregation and recycling to align with sustainability goals. Regular inspections and audits are conducted to ensure compliance, and non-adherence can lead to significant penalties. These policies collectively aim to mitigate environmental risks and promote a culture of safety and responsibility in waste management.?
Key Highlights of the Report:
- Australia Oily Waste Can Market Outlook
- Market Size of Australia Oily Waste Can Market, 2025
- Forecast of Australia Oily Waste Can Market, 2032
- Historical Data and Forecast of Australia Oily Waste Can Revenues & Volume for the Period 2022 - 2032F
- Australia Oily Waste Can Market Trend Evolution
- Australia Oily Waste Can Market Drivers and Challenges
- Australia Oily Waste Can Price Trends
- Australia Oily Waste Can Porter's Five Forces
- Australia Oily Waste Can Industry Life Cycle
- Historical Data and Forecast of Australia Oily Waste Can Market Revenues & Volume By Material Type for the Period 2022 - 2032F
- Historical Data and Forecast of Australia Oily Waste Can Market Revenues & Volume By Steel for the Period 2022 - 2032F
- Historical Data and Forecast of Australia Oily Waste Can Market Revenues & Volume By Plastic for the Period 2022 - 2032F
- Historical Data and Forecast of Australia Oily Waste Can Market Revenues & Volume By Lid Type for the Period 2022 - 2032F
- Historical Data and Forecast of Australia Oily Waste Can Market Revenues & Volume By Foot Operated Self Closing for the Period 2022 - 2032F
- Historical Data and Forecast of Australia Oily Waste Can Market Revenues & Volume By Hand Operated Self Closing for the Period 2022 - 2032F
- Historical Data and Forecast of Australia Oily Waste Can Market Revenues & Volume By Capacity for the Period 2022 - 2032F
- Historical Data and Forecast of Australia Oily Waste Can Market Revenues & Volume By Up to 10 Gallon for the Period 2022 - 2032F
- Historical Data and Forecast of Australia Oily Waste Can Market Revenues & Volume By 11 to 15 Gallon for the Period 2022 - 2032F
- Historical Data and Forecast of Australia Oily Waste Can Market Revenues & Volume By 16 to 20 Gallon for the Period 2022 - 2032F
- Historical Data and Forecast of Australia Oily Waste Can Market Revenues & Volume By Above 20 Gallon for the Period 2022 - 2032F
- Historical Data and Forecast of Australia Oily Waste Can Market Revenues & Volume By End User for the Period 2022 - 2032F
- Historical Data and Forecast of Australia Oily Waste Can Market Revenues & Volume By Auto Repairs Shops for the Period 2022 - 2032F
- Historical Data and Forecast of Australia Oily Waste Can Market Revenues & Volume By Warehouse Facilities for the Period 2022 - 2032F
- Historical Data and Forecast of Australia Oily Waste Can Market Revenues & Volume By Construction Site for the Period 2022 - 2032F
- Historical Data and Forecast of Australia Oily Waste Can Market Revenues & Volume By Marinas for the Period 2022 - 2032F
- Historical Data and Forecast of Australia Oily Waste Can Market Revenues & Volume By Machine Shops for the Period 2022 - 2032F
- Historical Data and Forecast of Australia Oily Waste Can Market Revenues & Volume By Printing Operations for the Period 2022 - 2032F
- Historical Data and Forecast of Australia Oily Waste Can Market Revenues & Volume By Furniture Refinishers for the Period 2022 - 2032F
- Historical Data and Forecast of Australia Oily Waste Can Market Revenues & Volume By Manufacturing Plants for the Period 2022 - 2032F
- Australia Oily Waste Can Import Export Trade Statistics
- Market Opportunity Assessment By Material Type
- Market Opportunity Assessment By Lid Type
- Market Opportunity Assessment By Capacity
- Market Opportunity Assessment By End User
- Australia Oily Waste Can Top Companies Market Share
- Australia Oily Waste Can Competitive Benchmarking By Technical and Operational Parameters
- Australia Oily Waste Can Company Profiles
- Australia Oily Waste Can Key Strategic Recommendations
Australia Oily Waste Can Market (2026-2032): FAQs
6Wresearch actively monitors the Australia Oily Waste Can Market and publishes its comprehensive annual report, highlighting emerging trends, growth drivers, revenue analysis, and forecast outlook. Our insights help businesses to make data-backed strategic decisions with ongoing market dynamics. Our analysts track relevent industries related to the Australia Oily Waste Can Market, allowing our clients with actionable intelligence and reliable forecasts tailored to emerging regional needs.
Yes, we provide customisation as per your requirements. To learn more, feel free to contact us on sales@6wresearch.com
1 Executive Summary |
2 Introduction |
2.1 Key Highlights of the Report |
2.2 Report Description |
2.3 Market Scope & Segmentation |
2.4 Research Methodology |
2.5 Assumptions |
3 Australia Oily Waste Can Market Overview |
3.1 Australia Country Macro Economic Indicators |
3.2 Australia Oily Waste Can Market Revenues & Volume, 2022 & 2032F |
3.3 Australia Oily Waste Can Market - Industry Life Cycle |
3.4 Australia Oily Waste Can Market - Porter's Five Forces |
3.5 Australia Oily Waste Can Market Revenues & Volume Share, By Material Type, 2022 & 2032F |
3.6 Australia Oily Waste Can Market Revenues & Volume Share, By Lid Type, 2022 & 2032F |
3.7 Australia Oily Waste Can Market Revenues & Volume Share, By Capacity, 2022 & 2032F |
3.8 Australia Oily Waste Can Market Revenues & Volume Share, By End User, 2022 & 2032F |
4 Australia Oily Waste Can Market Dynamics |
4.1 Impact Analysis |
4.2 Market Drivers |
4.2.1 Stringent environmental regulations in Australia promoting proper disposal of oily waste |
4.2.2 Increasing awareness among industries about the importance of sustainable waste management practices |
4.2.3 Growth in industries generating oily waste such as automotive, manufacturing, and mining |
4.3 Market Restraints |
4.3.1 High initial investment required for setting up proper oily waste management systems |
4.3.2 Limited availability of advanced technology for efficient oily waste treatment |
4.3.3 Lack of skilled professionals for handling and managing oily waste |
5 Australia Oily Waste Can Market Trends |
6 Australia Oily Waste Can Market, By Types |
6.1 Australia Oily Waste Can Market, By Material Type |
6.1.1 Overview and Analysis |
6.1.2 Australia Oily Waste Can Market Revenues & Volume, By Material Type, 2022 - 2032F |
6.1.3 Australia Oily Waste Can Market Revenues & Volume, By Steel, 2022 - 2032F |
6.1.4 Australia Oily Waste Can Market Revenues & Volume, By Plastic, 2022 - 2032F |
6.2 Australia Oily Waste Can Market, By Lid Type |
6.2.1 Overview and Analysis |
6.2.2 Australia Oily Waste Can Market Revenues & Volume, By Foot Operated Self Closing, 2022 - 2032F |
6.2.3 Australia Oily Waste Can Market Revenues & Volume, By Hand Operated Self Closing, 2022 - 2032F |
6.3 Australia Oily Waste Can Market, By Capacity |
6.3.1 Overview and Analysis |
6.3.2 Australia Oily Waste Can Market Revenues & Volume, By Up to 10 Gallon, 2022 - 2032F |
6.3.3 Australia Oily Waste Can Market Revenues & Volume, By 11 to 15 Gallon, 2022 - 2032F |
6.3.4 Australia Oily Waste Can Market Revenues & Volume, By 16 to 20 Gallon, 2022 - 2032F |
6.3.5 Australia Oily Waste Can Market Revenues & Volume, By Above 20 Gallon, 2022 - 2032F |
6.4 Australia Oily Waste Can Market, By End User |
6.4.1 Overview and Analysis |
6.4.2 Australia Oily Waste Can Market Revenues & Volume, By Auto Repairs Shops, 2022 - 2032F |
6.4.3 Australia Oily Waste Can Market Revenues & Volume, By Warehouse Facilities, 2022 - 2032F |
6.4.4 Australia Oily Waste Can Market Revenues & Volume, By Construction Site, 2022 - 2032F |
6.4.5 Australia Oily Waste Can Market Revenues & Volume, By Marinas, 2022 - 2032F |
6.4.6 Australia Oily Waste Can Market Revenues & Volume, By Machine Shops, 2022 - 2032F |
6.4.7 Australia Oily Waste Can Market Revenues & Volume, By Printing Operations, 2022 - 2032F |
6.4.8 Australia Oily Waste Can Market Revenues & Volume, By Manufacturing Plants, 2022 - 2032F |
6.4.9 Australia Oily Waste Can Market Revenues & Volume, By Manufacturing Plants, 2022 - 2032F |
7 Australia Oily Waste Can Market Import-Export Trade Statistics |
7.1 Australia Oily Waste Can Market Export to Major Countries |
7.2 Australia Oily Waste Can Market Imports from Major Countries |
8 Australia Oily Waste Can Market Key Performance Indicators |
8.1 Percentage increase in the adoption of eco-friendly oily waste can solutions |
8.2 Average reduction in oily waste disposal costs for businesses using specialized oily waste cans |
8.3 Number of government initiatives supporting sustainable waste management practices in Australia |
9 Australia Oily Waste Can Market - Opportunity Assessment |
9.1 Australia Oily Waste Can Market Opportunity Assessment, By Material Type, 2022 & 2032F |
9.2 Australia Oily Waste Can Market Opportunity Assessment, By Lid Type, 2022 & 2032F |
9.3 Australia Oily Waste Can Market Opportunity Assessment, By Capacity, 2022 & 2032F |
9.4 Australia Oily Waste Can Market Opportunity Assessment, By End User, 2022 & 2032F |
10 Australia Oily Waste Can Market - Competitive Landscape |
10.1 Australia Oily Waste Can Market Revenue Share, By Companies, 2025 |
10.2 Australia Oily Waste Can Market Competitive Benchmarking, By Operating and Technical Parameters |
11 Company Profiles |
12 Recommendations |
13 Disclaimer |
Export potential assessment - trade Analytics for 2030
Export potential enables firms to identify high-growth global markets with greater confidence by combining advanced trade intelligence with a structured quantitative methodology. The framework analyzes emerging demand trends and country-level import patterns while integrating macroeconomic and trade datasets such as GDP and population forecasts, bilateral import–export flows, tariff structures, elasticity differentials between developed and developing economies, geographic distance, and import demand projections. Using weighted trade values from 2020–2024 as the base period to project country-to-country export potential for 2030, these inputs are operationalized through calculated drivers such as gravity model parameters, tariff impact factors, and projected GDP per-capita growth. Through an analysis of hidden potentials, demand hotspots, and market conditions that are most favorable to success, this method enables firms to focus on target countries, maximize returns, and global expansion with data, backed by accuracy.
By factoring in the projected importer demand gap that is currently unmet and could be potential opportunity, it identifies the potential for the Exporter (Country) among 190 countries, against the general trade analysis, which identifies the biggest importer or exporter.
To discover high-growth global markets and optimize your business strategy:
Click Here
Pricing
- Single User License$ 1,995
- Department License$ 2,400
- Site License$ 3,120
- Global License$ 3,795

Search
Thought Leadership and Analyst Meet


Our Clients
Latest Reports
- United Kingdom (UK) Long-term Care Insurance Market (2026-2032) | Growth, Share, Consumer Insights, Drivers, Opportunities, Competition, Pricing Analysis, Segments, Restraints, Companies, Competitive, Value, Outlook, Size, Demand, Analysis, Challenges, Strategic Insights, Investment Trends, Revenue, Trends, Supply, Forecast
- United Kingdom (UK) Long Term Care Market (2026-2032) | Companies, Outlook, Analysis, Trends, Value, Revenue, Segmentation, Share, Forecast, Competitive Landscape, Growth, Size & Forecast
- Iraq Insulation and Waterproofing Market (2026-2032) | Outlook, Drivers, Growth, Size, Share, Industry, Revenue, Trends, Demand, Competitive, Strategic Insights, Opportunities, Segments, Companies, Challenges, Strategy, Consumer Insights, Analysis, Investment Trends, Value, Segmentation, Forecast, Restraints
- India Switchgear Market Outlook (2026 - 2032) | Size, Share, Trends, Growth, Revenue, Forecast, Analysis, Value, Outlook
- Pakistan Contraceptive Implants Market (2025-2031) | Demand, Growth, Size, Share, Industry, Pricing Analysis, Competitive, Strategic Insights, Strategy, Consumer Insights, Analysis, Investment Trends, Opportunities, Revenue, Segments, Value, Segmentation, Supply, Forecast, Restraints, Outlook, Competition, Drivers, Trends, Companies, Challenges
- Sri Lanka Packaging Market (2026-2032) | Outlook, Competition, Drivers, Trends, Demand, Pricing Analysis, Competitive, Strategic Insights, Companies, Challenges, Strategy, Consumer Insights, Analysis, Investment Trends, Opportunities, Growth, Size, Share, Industry, Revenue, Segments, Value, Segmentation, Supply, Forecast, Restraints
- India Kids Watches Market (2026-2032) | Strategy, Consumer Insights, Analysis, Investment Trends, Opportunities, Growth, Size, Share, Industry, Revenue, Segments, Value, Segmentation, Supply, Forecast, Restraints, Outlook, Competition, Drivers, Trends, Demand, Pricing Analysis, Competitive, Strategic Insights, Companies, Challenges
- Saudi Arabia Core Assurance Service Market (2025-2031) | Strategy, Consumer Insights, Analysis, Investment Trends, Opportunities, Growth, Size, Share, Industry, Revenue, Segments, Value, Segmentation, Supply, Forecast, Restraints, Outlook, Competition, Drivers, Trends, Demand, Pricing Analysis, Competitive, Strategic Insights, Companies, Challenges
- Romania Uninterruptible Power Supply (UPS) Market (2026-2032) | Industry, Analysis, Revenue, Size, Forecast, Outlook, Value, Trends, Share, Growth & Companies
- Saudi Arabia Car Window Tinting Film, Paint Protection Film (PPF), and Ceramic Coating Market (2025-2031) | Strategy, Consumer Insights, Analysis, Investment Trends, Opportunities, Growth, Size, Share, Industry, Revenue, Segments, Value, Segmentation, Supply, Forecast, Restraints, Outlook, Competition, Drivers, Trends, Demand, Pricing Analysis, Competitive, Strategic Insights, Companies, Challenges
Industry Events and Analyst Meet

India EV Show 2026

EV tech India Expo 2026

Auto Tech Asia 2026

Battery Tech India 2026

Smart Production Solutions Guangzhou 2026
Whitepaper
- Middle East & Africa Commercial Security Market Click here to view more.
- Middle East & Africa Fire Safety Systems & Equipment Market Click here to view more.
- GCC Drone Market Click here to view more.
- Middle East Lighting Fixture Market Click here to view more.
- GCC Physical & Perimeter Security Market Click here to view more.
6WResearch In News
- Doha a strategic location for EV manufacturing hub: IPA Qatar
- Demand for luxury TVs surging in the GCC, says Samsung
- Empowering Growth: The Thriving Journey of Bangladesh’s Cable Industry
- Demand for luxury TVs surging in the GCC, says Samsung
- Video call with a traditional healer? Once unthinkable, it’s now common in South Africa
- Intelligent Buildings To Smooth GCC’s Path To Net Zero