Australia Optical Instruments Market (2026-2032) | Outlook, Growth, Industry, Share, Revenue, Trends, Companies, Size, Forecast, Analysis & Value
Market Forecast By Types (Microscopes, Contact Lenses, Binoculars, Camera Lenses, Telescopes), By Applications (Commercial, Residential, Industrial, Defense and surveillance ) And Competitive Landscape
| Product Code: ETC021715 | Publication Date: Oct 2020 | Updated Date: Jun 2026 | Product Type: Report | |
| Publisher: 6Wresearch | Author: Ravi Bhandari | No. of Pages: 70 | No. of Figures: 35 | No. of Tables: 5 |
Australia Optical Instruments Market Summary
The australia optical instruments market was estimated at USD 83 Million in 2025 and is projected to reach USD 97 Million by 2032, growing at a CAGR of 2.8% from 2026 to 2032.
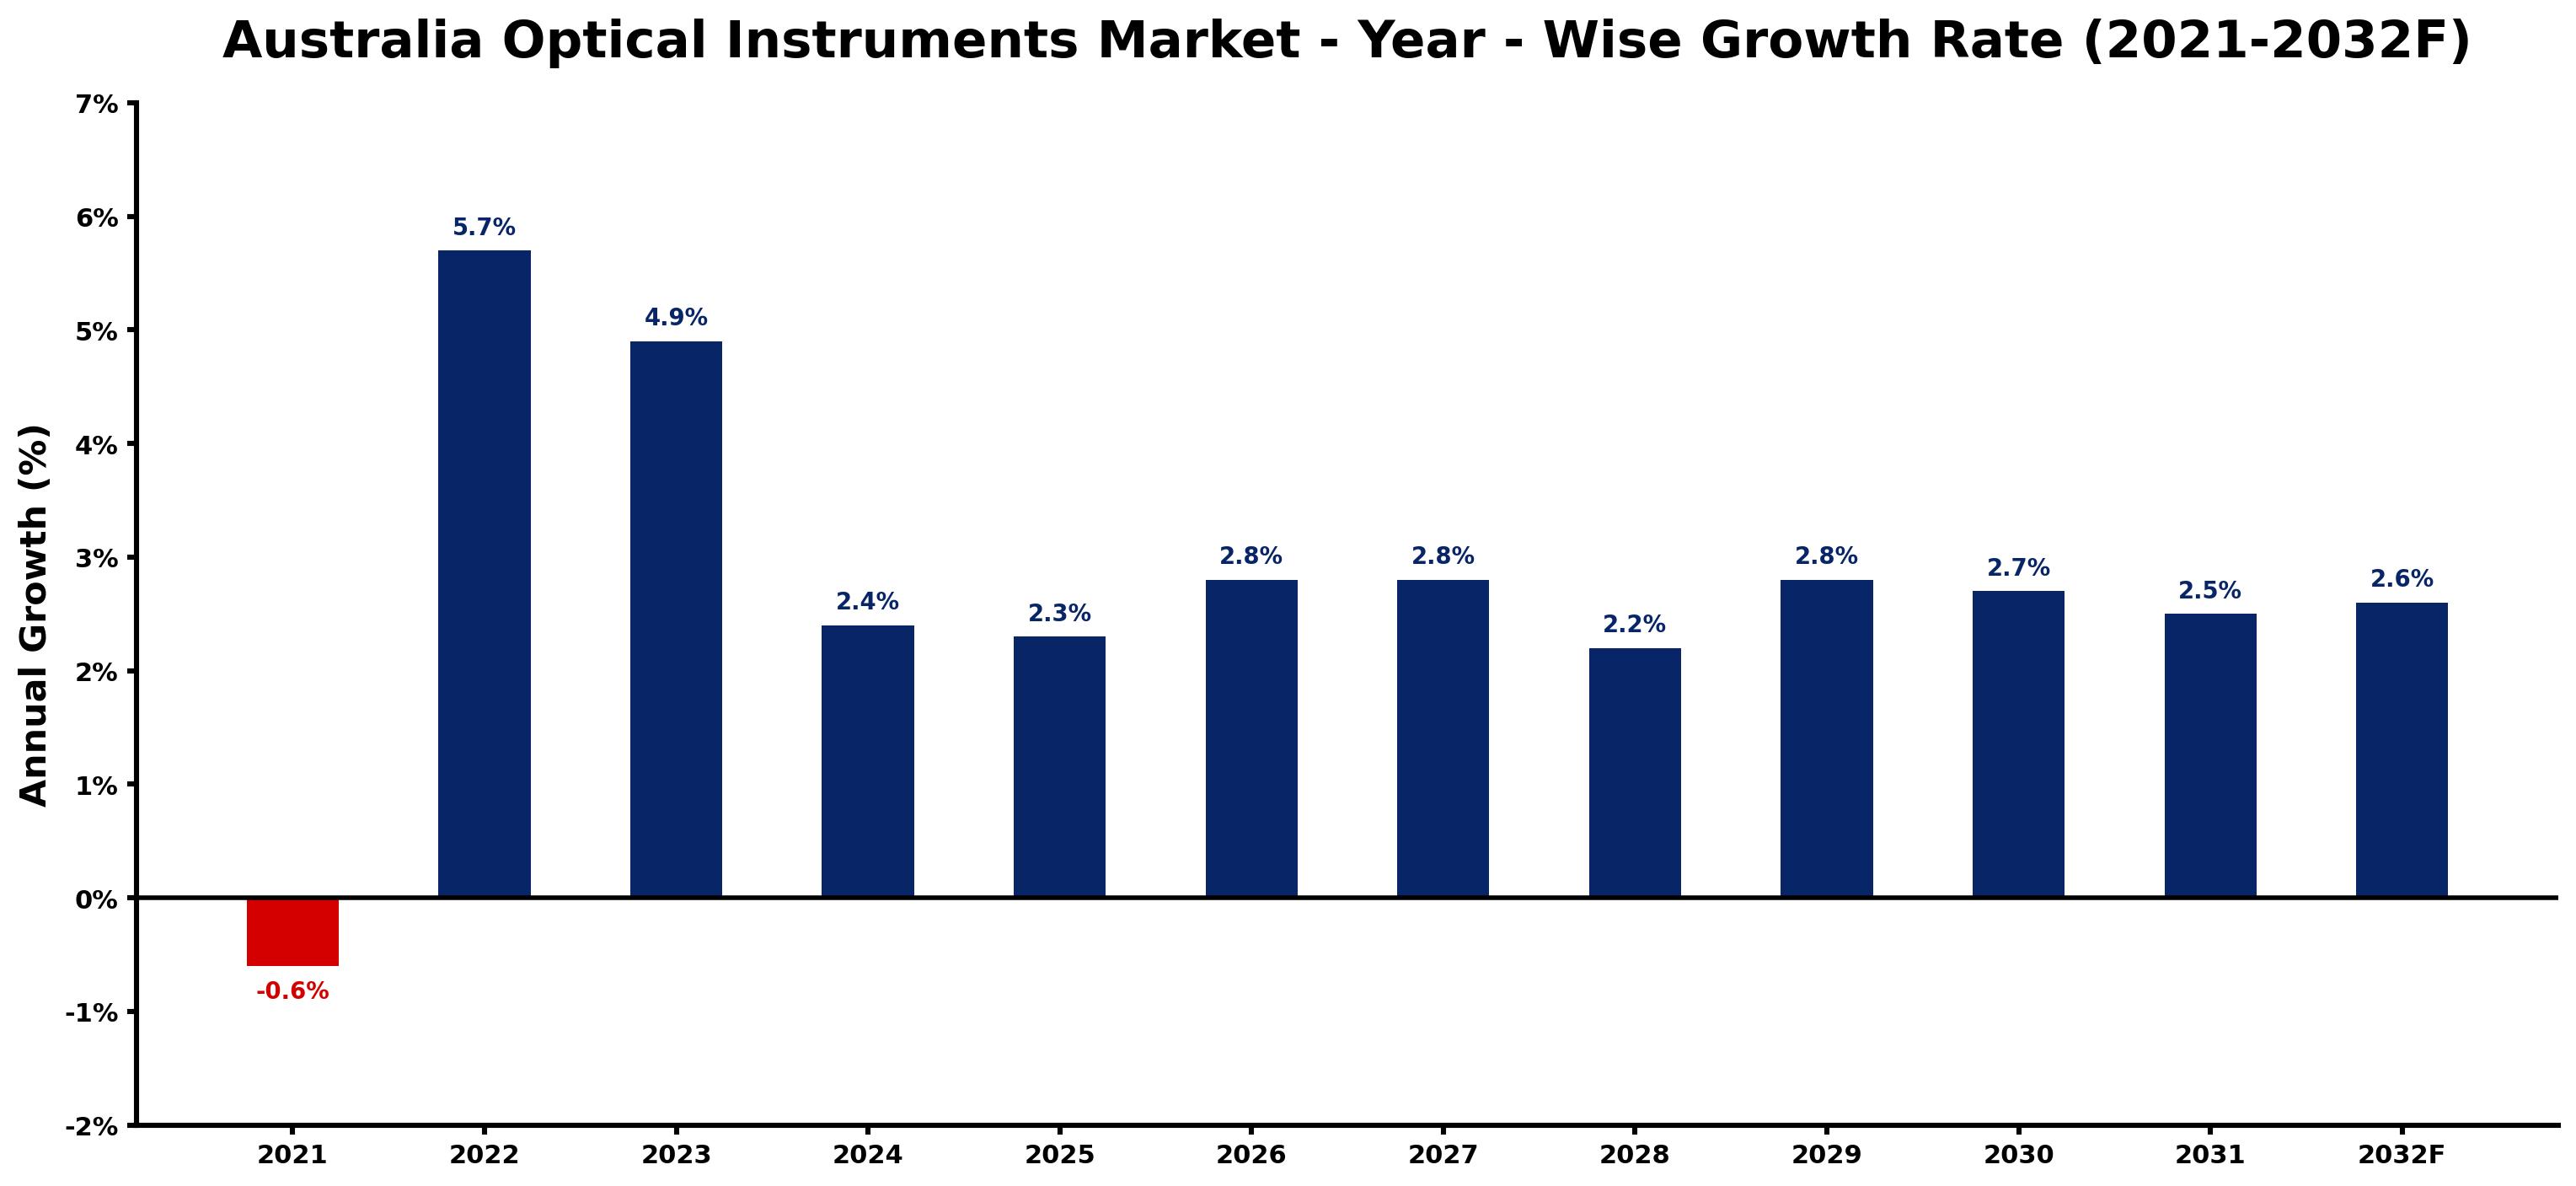
Australia Optical Instruments Market Growth Rate Analysis (2021-2032)
The Australian optical instruments market experienced a notable recovery following a decline of 0.6% in 2021, largely attributed to supply chain disruptions and decreased consumer demand during the pandemic. The sector rebounded strongly in 2022, with a growth of 5.7%, driven by enhanced investments in research and development, alongside a rise in consumer interest for high-tech instruments, including microscopes and binoculars. Growth continued into 2023 at 4.9%, supported by technological advancements and increased applications in healthcare and environmental monitoring. Though growth is projected to stabilize at around 2.4% to 2.8% from 2024 to 2032, sustained demand and a shift towards digitalization in imaging technologies will underpin this steady progress, reflecting a robust market in the longer term.
Australia Optical Instruments Market Year-wise Growth Rate and Key Drivers
This graph highlights how the Australia Optical Instruments Market has steadily grown over the past five years, supported by major growth factors.
The table below presents the year wise growth rates along with the key drivers influencing the market
| Year | Growth Rate | Major Drivers |
| 2021 | -0.6% | Lingering pandemic effects limited retail foot traffic, suppressing sales of optical instruments across Australia. |
| 2022 | 5.7% | Increased consumer interest in high-quality visuals boosts demand for optical solutions. |
| 2023 | 4.9% | Technological innovations enhance precision in the production of optical instruments. |
| 2024 | 2.4% | The expanding e-commerce sector necessitates improved optical quality for product displays. |
| 2025 | 2.3% | Emerging applications in healthcare drive investment in optical imaging technologies. |
| 2026 | 2.8% | Corporate budgets prioritize optical instruments for enhanced operational efficiency benefits. |
| 2027 | 2.8% | Sustainability trends push optical companies toward eco-friendly manufacturing processes. |
| 2028 | 2.2% | Rising interest in augmented reality creates new markets for optical device integration. |
| 2029 | 2.8% | Educational institutions increasingly adopt advanced optics for immersive learning experiences. |
| 2030 | 2.7% | The demand for personalized eyecare solutions leads to innovation in optical products. |
| 2031 | 2.5% | Technological collaborations enhance the quality and variety of optical instruments available. |
| 2032 | 2.6% | Global competition encourages continuous improvement and diversification in the optical sector. |
Note - Market size estimations and growth projections presented in this report are based on 6Wresearch's advanced forecasting approach, validated with industry datasets as of June 2026.
Australia Optical Instruments Market Synopsis
The Australia Optical Instruments Market is projected to reach 2.8% and witness significant growth during the forecast period (2026-2032). This growth is primarily driven by increasing applications in healthcare, research, and industrial sectors. The demand for products such as microscopes, telescopes, and ophthalmic instruments is rising due to advancements in optical technology and a heightened investment in scientific research. Furthermore, the evolution of digital imaging and automation technologies is shaping the trajectory of the industry.
Australia Optical Instruments Market Growth Drivers
The growth of the Australia Optical Instruments Market can be attributed to several key factors:
- The healthcare sector's adoption of advanced imaging technologies is significantly driving the demand for optical instruments. Enhanced medical diagnostics and surgical procedures rely on high-quality optical devices.
- In the telecommunications industry, optical instruments are crucial for fiber optics and high-bandwidth communication systems, contributing to the market's expansion.
- The defense and aerospace sectors require high-precision optical components, further propelling market growth through sophisticated applications.
- Research and development investments in optical innovations are continuously introducing new technologies and applications, creating a favorable environment for market expansion.
- The integration of automation and digital imaging technology in industrial applications enhances efficiency and opens new avenues for optical instrument utilization.
Australia Optical Instruments Market Challenges and Restraints
Despite the apparent growth potential, the Australia Optical Instruments Market faces certain challenges:
- The industry's heavy reliance on imports poses a significant challenge, as fluctuations in international supply chains can impact availability and pricing of critical optical instruments.
- High costs associated with advanced optical instruments create barriers for local buyers, especially for emerging businesses that may lack the capital for investment in cutting-edge technologies.
- The rapid pace of optical technology advancements necessitates ongoing investment in research and development, which can strain resources for smaller firms.
- Precision engineering requirements for the manufacturing and assembly of optical instruments can lead to higher production costs, limiting competitiveness.
- Market participants must navigate a complex regulatory environment that mandates compliance with stringent safety and performance standards.
Australia Optical Instruments Market Investment Opportunities
Investment opportunities within the Australia Optical Instruments Market are robust, fueled by several key sectors:
- Healthcare innovation continues to drive investment as institutions seek advanced imaging systems and ophthalmic devices, leveraging new technologies to improve patient outcomes.
- The burgeoning demand for optical instruments in defense applications is generating avenues for investment, particularly in high-precision optics for surveillance and reconnaissance.
- Scientific research funding is increasingly prioritizing optical advancements, offering opportunities for partnerships and grants aimed at developing new optical technologies.
- Government initiatives aimed at fostering innovation in optical instrument production can yield financial incentives and support for local manufacturers.
- The growth in automation across industries creates demand for optical sensing and imaging technologies, inviting ventures focused on developing precision optical devices.
Australia Optical Instruments Market Government Investment and Initiatives
The regulatory landscape surrounding the Australia Optical Instruments Market is shaped by government policies that promote safety and innovation:
- The Australian Competition and Consumer Commission (ACCC) ensures that all optical devices meet stringent quality and performance standards, aiming to protect consumer interests.
- Medical optical instruments such as ophthalmic devices are required to receive approval from the Therapeutic Goods Administration (TGA) before they can be marketed, ensuring safety and efficacy.
- Import regulations are in place to prevent substandard optical instruments from entering the market, emphasizing the importance of quality in this sector.
- Significant government investments focus on enhancing research capabilities, particularly in medical and space research, which often incorporates advanced optical technologies.
- Various grants and funding programs are available to support the development of innovative optical instruments, fostering growth in local manufacturing capabilities.
Australia Optical Instruments Market Latest Developments (May 2025 - June 2026)
The period from May 2025 to June 2026 has witnessed notable developments in the Australia Optical Instruments Market, reflecting the dynamic nature of the sector:
- Increased collaborations between universities and industry have emerged, focusing on R&D initiatives aimed at advancing optical technology applications.
- Emerging startups are leveraging advancements in artificial intelligence to enhance the functionality of optical instruments, fostering innovation across various applications.
- Government announcements regarding funding for space exploration initiatives are likely to increase demand for high-performance optical instruments designed for aerospace applications.
- There has been a noticeable shift towards sustainable production practices among manufacturers, with many seeking to minimize their environmental impact.
- Conferences and exhibitions have highlighted significant strides in optical imaging technology, showcasing local innovations that are set to influence future market trends.
Australia Optical Instruments Market - Key Attractiveness of the Report
- 10 Years of Market Numbers
- Historical Data Starting from 2022 to 2025
- Base Year: 2025
- Forecast Data until 2032
- Key Performance Indicators Impacting the Market
- Major Upcoming Developments and Projects
Key Highlights of the Report:
- Australia Optical Instruments Market Outlook
- Market Size of Australia Optical Instruments Market, 2025
- Forecast of Australia Optical Instruments Market, 2032
- Historical Data and Forecast of Australia Optical Instruments Revenues & Volume for the Period 2022-2032F
- Australia Optical Instruments Market Trend Evolution
- Australia Optical Instruments Market Drivers and Challenges
- Australia Optical Instruments Price Trends
- Australia Optical Instruments Porter's Five Forces
- Australia Optical Instruments Industry Life Cycle
- Historical Data and Forecast of Australia Optical Instruments Market Revenues & Volume By Types for the Period 2022-2032F
- Historical Data and Forecast of Australia Optical Instruments Market Revenues & Volume By Microscopes for the Period 2022-2032F
- Historical Data and Forecast of Australia Optical Instruments Market Revenues & Volume By Contact Lenses for the Period 2022-2032F
- Historical Data and Forecast of Australia Optical Instruments Market Revenues & Volume By Binoculars for the Period 2022-2032F
- Historical Data and Forecast of Australia Optical Instruments Market Revenues & Volume By Camera Lenses for the Period 2022-2032F
- Historical Data and Forecast of Australia Optical Instruments Market Revenues & Volume By Telescopes for the Period 2022-2032F
- Historical Data and Forecast of Australia Optical Instruments Market Revenues & Volume By Applications for the Period 2022-2032F
- Historical Data and Forecast of Australia Optical Instruments Market Revenues & Volume By Commercial for the Period 2022-2032F
- Historical Data and Forecast of Australia Optical Instruments Market Revenues & Volume By Residential for the Period 2022-2032F
- Historical Data and Forecast of Australia Optical Instruments Market Revenues & Volume By Industrial for the Period 2022-2032F
- Historical Data and Forecast of Australia Optical Instruments Market Revenues & Volume By Defense and surveillance for the Period 2022-2032F
- Australia Optical Instruments Import Export Trade Statistics
- Market Opportunity Assessment By Types
- Market Opportunity Assessment By Applications
- Australia Optical Instruments Top Companies Market Share
- Australia Optical Instruments Competitive Benchmarking By Technical and Operational Parameters
- Australia Optical Instruments Company Profiles
- Australia Optical Instruments Key Strategic Recommendations
Frequently Asked Questions About the Market Study (FAQs):
The primary applications driving this market include healthcare diagnostics, defense, telecommunications, and scientific research, all of which rely heavily on advanced optical technologies.
Challenges include high import dependency, significant costs for advanced instruments, and the need for continual investment in R&D to keep pace with technological advancements.
Government policies are focused on ensuring quality and safety through stringent regulations, promoting innovation through funding, and regulating imports to maintain market standards.
Key trends include increased automation, the integration of AI in optical devices, and a focus on sustainability in manufacturing processes, which are expected to drive future market growth.
6Wresearch actively monitors the Australia Optical Instruments Market and publishes its comprehensive annual report, highlighting emerging trends, growth drivers, revenue analysis, and forecast outlook. Our insights help businesses to make data-backed strategic decisions with ongoing market dynamics. Our analysts track relevent industries related to the Australia Optical Instruments Market, allowing our clients with actionable intelligence and reliable forecasts tailored to emerging regional needs.
Yes, we provide customisation as per your requirements. To learn more, feel free to contact us on sales@6wresearch.com
1 Executive Summary |
2 Introduction |
2.1 Key Highlights of the Report |
2.2 Report Description |
2.3 Market Scope & Segmentation |
2.4 Research Methodology |
2.5 Assumptions |
3 Australia Optical Instruments Market Overview |
3.1 Australia Country Macro Economic Indicators |
3.2 Australia Optical Instruments Market Revenues & Volume, 2022 & 2032F |
3.3 Australia Optical Instruments Market - Industry Life Cycle |
3.4 Australia Optical Instruments Market - Porter's Five Forces |
3.5 Australia Optical Instruments Market Revenues & Volume Share, By Types, 2022 & 2032F |
3.6 Australia Optical Instruments Market Revenues & Volume Share, By Applications, 2022 & 2032F |
4 Australia Optical Instruments Market Dynamics |
4.1 Impact Analysis |
4.2 Market Drivers |
4.2.1 Increasing demand for advanced medical equipment and devices in Australia |
4.2.2 Technological advancements in optical instruments leading to improved product offerings |
4.2.3 Growing awareness about preventive healthcare and early disease detection |
4.3 Market Restraints |
4.3.1 High initial investment and maintenance costs associated with optical instruments |
4.3.2 Stringent regulatory requirements for the approval and sale of optical instruments in Australia |
5 Australia Optical Instruments Market Trends |
6 Australia Optical Instruments Market, By Types |
6.1 Australia Optical Instruments Market, By Types |
6.1.1 Overview and Analysis |
6.1.2 Australia Optical Instruments Market Revenues & Volume, By Types, 2022-2032F |
6.1.3 Australia Optical Instruments Market Revenues & Volume, By Microscopes, 2022-2032F |
6.1.4 Australia Optical Instruments Market Revenues & Volume, By Contact Lenses, 2022-2032F |
6.1.5 Australia Optical Instruments Market Revenues & Volume, By Binoculars, 2022-2032F |
6.1.6 Australia Optical Instruments Market Revenues & Volume, By Camera Lenses, 2022-2032F |
6.1.7 Australia Optical Instruments Market Revenues & Volume, By Telescopes, 2022-2032F |
6.2 Australia Optical Instruments Market, By Applications |
6.2.1 Overview and Analysis |
6.2.2 Australia Optical Instruments Market Revenues & Volume, By Commercial, 2022-2032F |
6.2.3 Australia Optical Instruments Market Revenues & Volume, By Residential, 2022-2032F |
6.2.4 Australia Optical Instruments Market Revenues & Volume, By Industrial, 2022-2032F |
6.2.5 Australia Optical Instruments Market Revenues & Volume, By Defense and surveillance , 2022-2032F |
7 Australia Optical Instruments Market Import-Export Trade Statistics |
7.1 Australia Optical Instruments Market Export to Major Countries |
7.2 Australia Optical Instruments Market Imports from Major Countries |
8 Australia Optical Instruments Market Key Performance Indicators |
8.1 Adoption rate of advanced optical instruments in healthcare facilities |
8.2 Number of research and development initiatives focused on enhancing optical instruments |
8.3 Rate of technological innovation in the optical instruments market |
9 Australia Optical Instruments Market - Opportunity Assessment |
9.1 Australia Optical Instruments Market Opportunity Assessment, By Types, 2022 & 2032F |
9.2 Australia Optical Instruments Market Opportunity Assessment, By Applications, 2022 & 2032F |
10 Australia Optical Instruments Market - Competitive Landscape |
10.1 Australia Optical Instruments Market Revenue Share, By Companies, 2025 |
10.2 Australia Optical Instruments Market Competitive Benchmarking, By Operating and Technical Parameters |
11 Company Profiles |
12 Recommendations |
13 Disclaimer |
Global Go To Market Strategy - 2030
Export potential enables firms to identify high-growth global markets with greater confidence by combining advanced trade intelligence with a structured quantitative methodology. The framework analyzes emerging demand trends and country-level import patterns while integrating macroeconomic and trade datasets such as GDP and population forecasts, bilateral import–export flows, tariff structures, elasticity differentials between developed and developing economies, geographic distance, and import demand projections. Using weighted trade values from 2020–2024 as the base period to project country-to-country export potential for 2030, these inputs are operationalized through calculated drivers such as gravity model parameters, tariff impact factors, and projected GDP per-capita growth. Through an analysis of hidden potentials, demand hotspots, and market conditions that are most favorable to success, this method enables firms to focus on target countries, maximize returns, and global expansion with data, backed by accuracy.
By factoring in the projected importer demand gap that is currently unmet and could be potential opportunity, it identifies the potential for the Exporter (Country) among 190 countries, against the general trade analysis, which identifies the biggest importer or exporter.
To discover high-growth global markets and optimize your business strategy:
Click Here
Pricing
- Single User License$ 1,995
- Department License$ 2,400
- Site License$ 3,120
- Global License$ 3,795

Leadership Perspectives from Industry Events
Search
Thought Leadership and Analyst Meet


Our Clients
6WResearch In News
- India Air Conditioner Market Set for Strong Rebound in 2026 After Weather-Led Correction and GST-Driven Recovery: 6Wresearch
- ADAS in India: How Automatic Emergency Braking, Blind Spot Detection & Driver Monitoring are Transforming Road Safety
- Doha a strategic location for EV manufacturing hub: IPA Qatar
- Demand for luxury TVs surging in the GCC, says Samsung
- Empowering Growth: The Thriving Journey of Bangladesh’s Cable Industry
- Demand for luxury TVs surging in the GCC, says Samsung
Latest Reports
- Poland Fire Protection Systems Market (2026-2032)
- Cape Verde Portable Hand-Thrown Extinguisher Market (2026-2032)
- Canada Portable Hand-Thrown Extinguisher Market (2026-2032)
- Cameroon Portable Hand-Thrown Extinguisher Market (2026-2032)
- Burundi Portable Hand-Thrown Extinguisher Market (2026-2032)
- Burkina Faso Portable Hand-Thrown Extinguisher Market (2026-2032)
- Bulgaria Portable Hand-Thrown Extinguisher Market (2026-2032)
- Brunei Portable Hand-Thrown Extinguisher Market (2026-2032)
- Botswana Portable Hand-Thrown Extinguisher Market (2026-2032)
- Bosnia and Herzegovina Portable Hand-Thrown Extinguisher Market (2026-2032)
Industry Events and Analyst Meet

HIMTEX 2026

India Refining Summit 2026

India EV Show 2026

EV tech India Expo 2026

Auto Tech Asia 2026
Whitepaper
- Middle East & Africa Commercial Security Market Click here to view more.
- Middle East & Africa Fire Safety Systems & Equipment Market Click here to view more.
- GCC Drone Market Click here to view more.
- Middle East Lighting Fixture Market Click here to view more.
- GCC Physical & Perimeter Security Market Click here to view more.