Australia Oxo Alcohols Market (2026-2032) Outlook | Forecast, Industry, Size, Companies, Growth, Value, Revenue, Trends, Share & Analysis
Market Forecast By Type (N-Butanol, ISO Butanol, 2-Ethylhexanol), By Application (Acrylates, Glycol Ethers, Acetates, Lube Oil Additives, Resins, Solvents, Plasticizers) And Competitive Landscape
| Product Code: ETC4490436 | Publication Date: Jul 2023 | Updated Date: Mar 2026 | Product Type: Report | |
| Publisher: 6Wresearch | Author: Dhaval Chaurasia | No. of Pages: 85 | No. of Figures: 45 | No. of Tables: 25 |
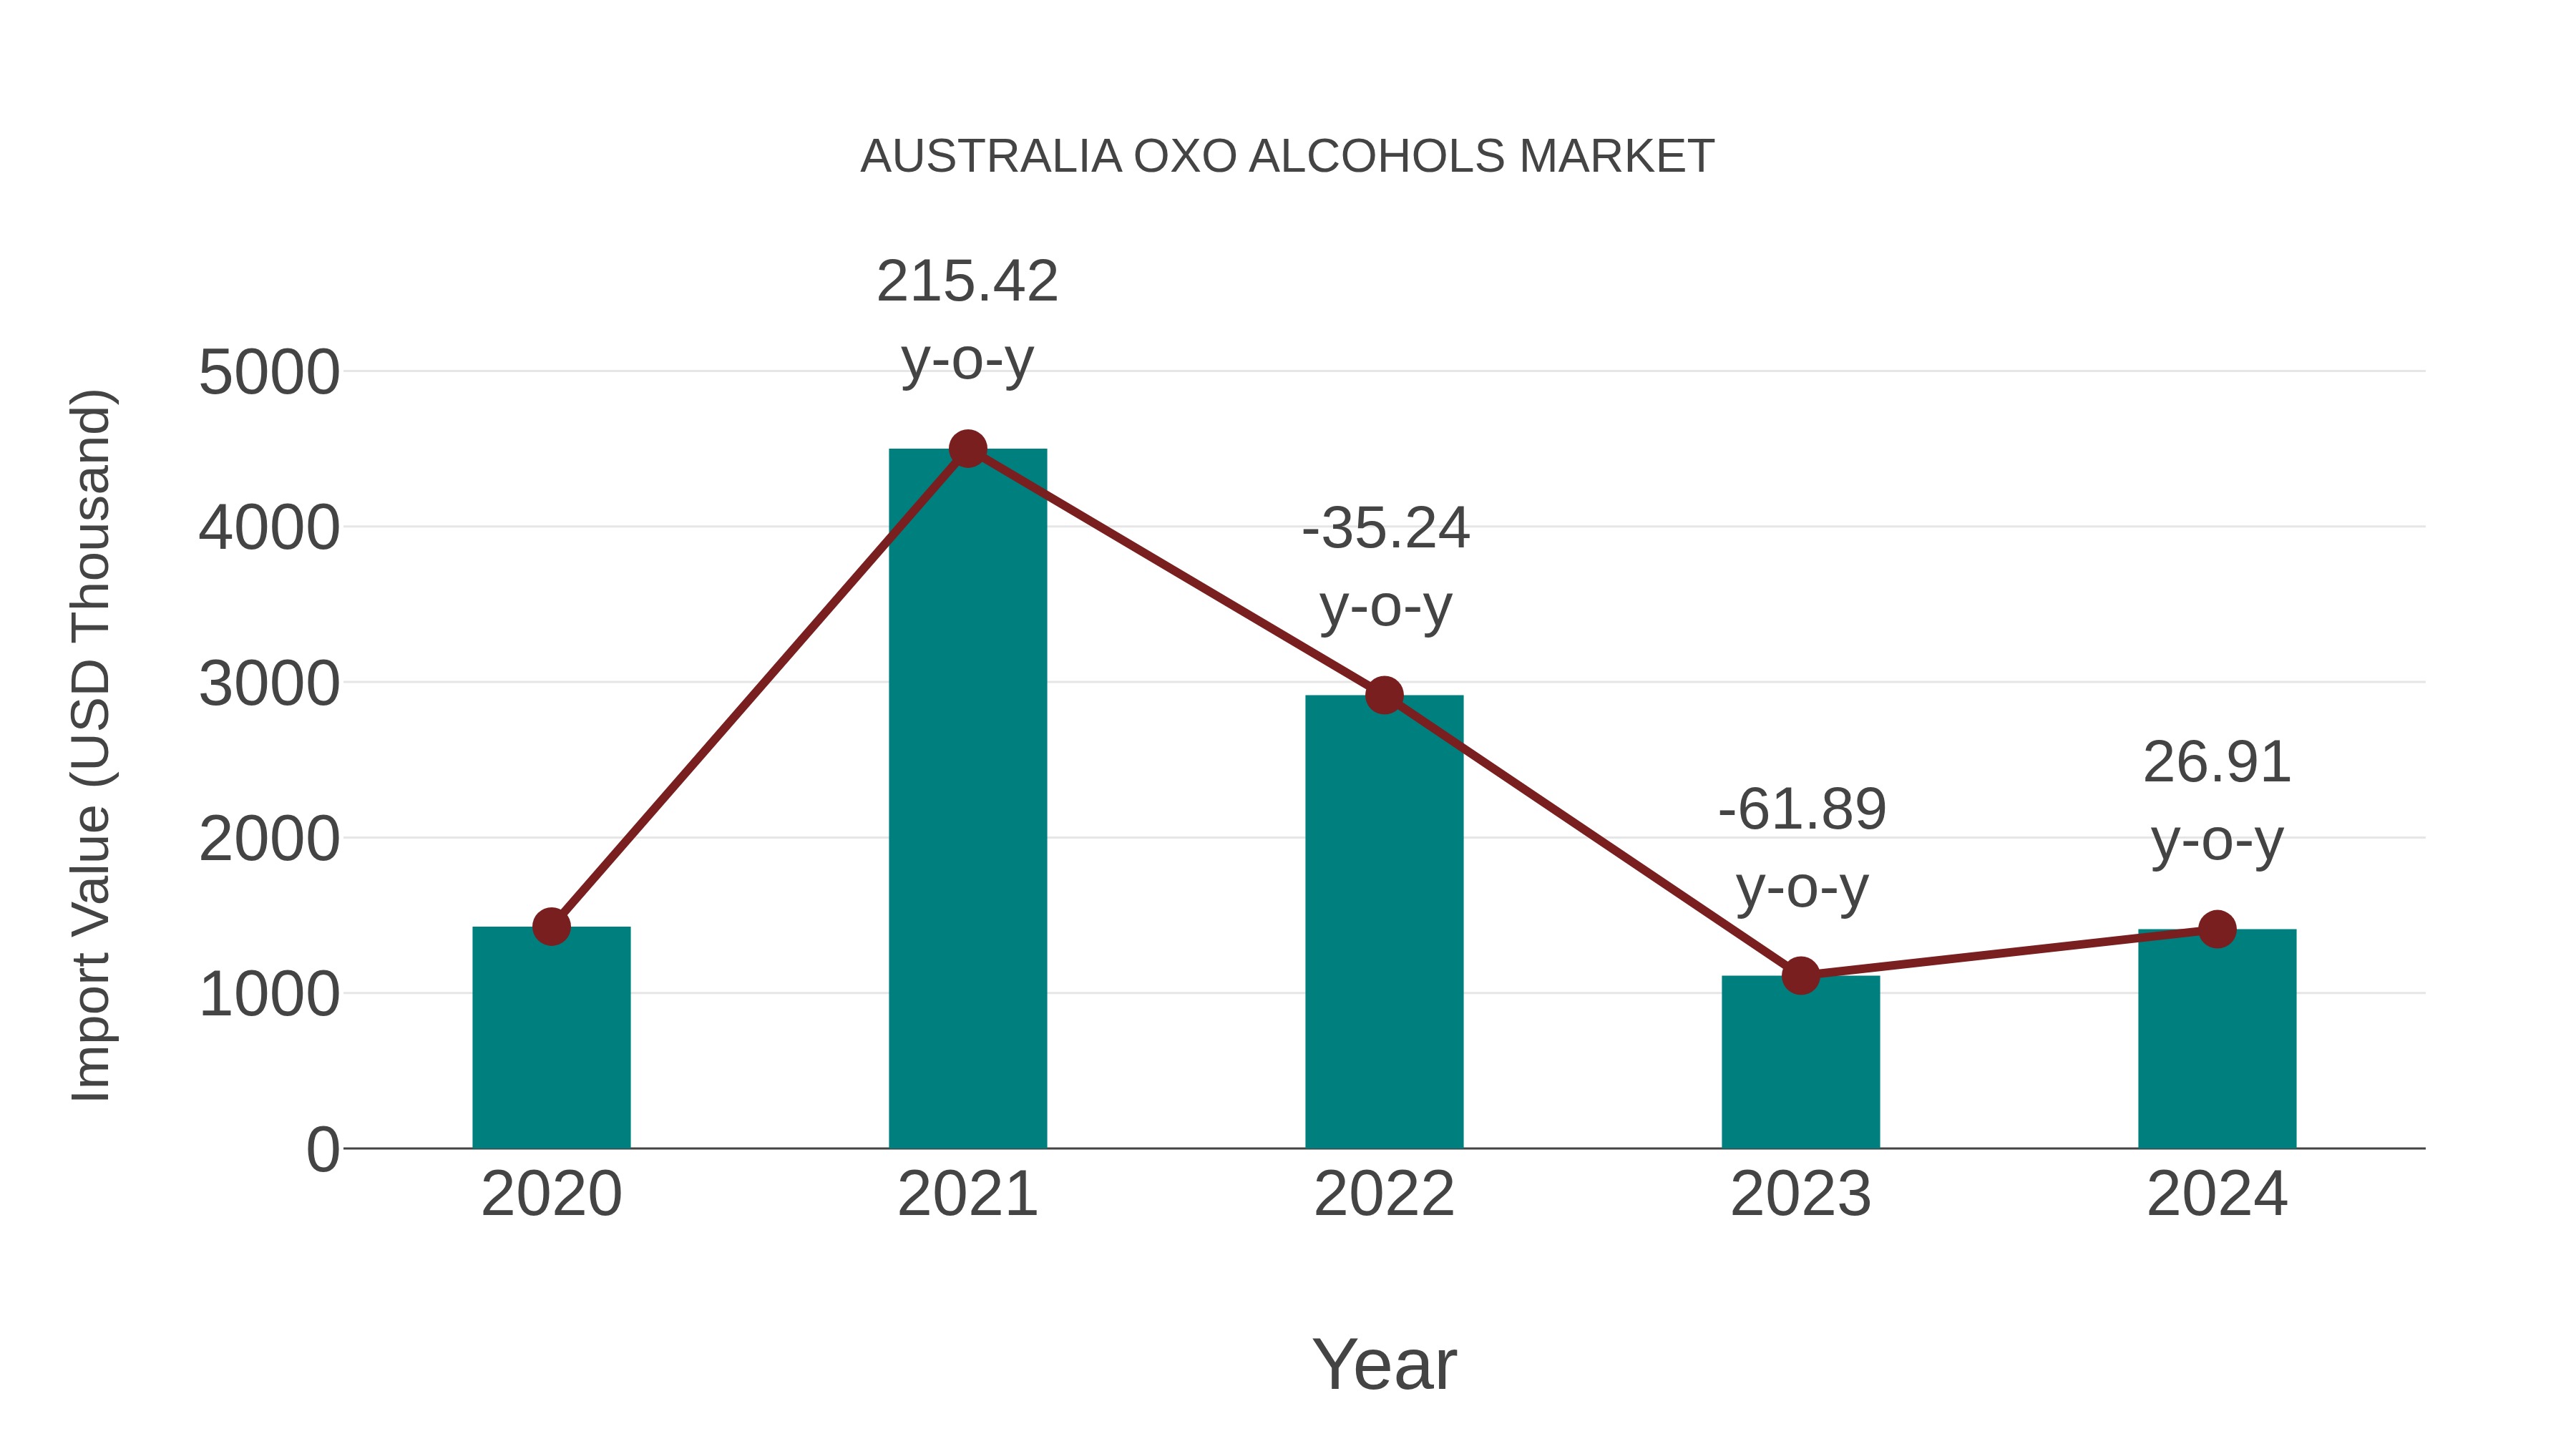
Australia Oxo Alcohols Market: Import Trend Analysis
In the Australia oxo alcohols market, the import trend showed a notable growth rate of 26.91% from 2023 to 2024, contrasting with a -0.3% compound annual growth rate (CAGR) for 2020-2024. This shift could be attributed to evolving demand patterns or shifts in trade policies impacting market dynamics.
Australia Oxo Alcohols Market Overview
Oxo alcohols are essential in plasticizers, solvents, and coatings. The Australian market is shaped by industrial growth, particularly in the paints and coatings sector. Market fluctuations are influenced by raw material prices and environmental regulations limiting volatile organic compounds (VOCs).
Drivers of the market
The oxo alcohols market in Australia is driven by increasing demand for plasticizers, solvents, and coatings. Rising adoption of oxo alcohols for improving product flexibility and processing efficiency is fueling market growth. Enhanced focus on developing low-toxicity and environmentally friendly oxo alcohols is supporting market expansion.
Challenges of the market
The oxo alcohols market in Australia faces challenges from high production costs due to the need for complex refining processes and volatile raw material prices. Dependence on imports for key feedstocks increases supply chain risks. Environmental regulations on VOC emissions and solvent handling further raise operational costs.
Investment opportunities in the Market
The Australia Oxo Alcohols Market presents growth opportunities due to rising demand in plasticizers and solvents. Investment opportunities include developing low-odor and eco-friendly oxo alcohols, improving production efficiency, and expanding into coatings and adhesives sectors.
Government Policy of the market
Oxo alcohols used in plasticizers and coatings are regulated under the AICIS. Importers and manufacturers must provide chemical composition data and safety handling guidelines. Waste disposal and emissions control are enforced under the Environmental Protection Act 1997.
Key Highlights of the Report:
- Australia Oxo Alcohols Market Outlook
- Market Size of Australia Oxo Alcohols Market, 2025
- Forecast of Australia Oxo Alcohols Market, 2032
- Historical Data and Forecast of Australia Oxo Alcohols Revenues & Volume for the Period 2022-2032F
- Australia Oxo Alcohols Market Trend Evolution
- Australia Oxo Alcohols Market Drivers and Challenges
- Australia Oxo Alcohols Price Trends
- Australia Oxo Alcohols Porter's Five Forces
- Australia Oxo Alcohols Industry Life Cycle
- Historical Data and Forecast of Australia Oxo Alcohols Market Revenues & Volume By Type for the Period 2022-2032F
- Historical Data and Forecast of Australia Oxo Alcohols Market Revenues & Volume By N-Butanol for the Period 2022-2032F
- Historical Data and Forecast of Australia Oxo Alcohols Market Revenues & Volume By ISO Butanol for the Period 2022-2032F
- Historical Data and Forecast of Australia Oxo Alcohols Market Revenues & Volume By 2-Ethylhexanol for the Period 2022-2032F
- Historical Data and Forecast of Australia Oxo Alcohols Market Revenues & Volume By Application for the Period 2022-2032F
- Historical Data and Forecast of Australia Oxo Alcohols Market Revenues & Volume By Acrylates for the Period 2022-2032F
- Historical Data and Forecast of Australia Oxo Alcohols Market Revenues & Volume By Glycol Ethers for the Period 2022-2032F
- Historical Data and Forecast of Australia Oxo Alcohols Market Revenues & Volume By Acetates for the Period 2022-2032F
- Historical Data and Forecast of Australia Oxo Alcohols Market Revenues & Volume By Lube Oil Additives for the Period 2022-2032F
- Historical Data and Forecast of Australia Oxo Alcohols Market Revenues & Volume By Resins for the Period 2022-2032F
- Historical Data and Forecast of Australia Oxo Alcohols Market Revenues & Volume By Solvents for the Period 2022-2032F
- Historical Data and Forecast of Australia Oxo Alcohols Market Revenues & Volume By Plasticizers for the Period 2022-2032F
- Australia Oxo Alcohols Import Export Trade Statistics
- Market Opportunity Assessment By Type
- Market Opportunity Assessment By Application
- Australia Oxo Alcohols Top Companies Market Share
- Australia Oxo Alcohols Competitive Benchmarking By Technical and Operational Parameters
- Australia Oxo Alcohols Company Profiles
- Australia Oxo Alcohols Key Strategic Recommendations
Australia Oxo Alcohols Market (2026-2032): FAQs
6Wresearch actively monitors the Australia Oxo Alcohols Market and publishes its comprehensive annual report, highlighting emerging trends, growth drivers, revenue analysis, and forecast outlook. Our insights help businesses to make data-backed strategic decisions with ongoing market dynamics. Our analysts track relevent industries related to the Australia Oxo Alcohols Market, allowing our clients with actionable intelligence and reliable forecasts tailored to emerging regional needs.
Yes, we provide customisation as per your requirements. To learn more, feel free to contact us on sales@6wresearch.com
1 Executive Summary |
2 Introduction |
2.1 Key Highlights of the Report |
2.2 Report Description |
2.3 Market Scope & Segmentation |
2.4 Research Methodology |
2.5 Assumptions |
3 Australia Oxo Alcohols Market Overview |
3.1 Australia Country Macro Economic Indicators |
3.2 Australia Oxo Alcohols Market Revenues & Volume, 2022 & 2032F |
3.3 Australia Oxo Alcohols Market - Industry Life Cycle |
3.4 Australia Oxo Alcohols Market - Porter's Five Forces |
3.5 Australia Oxo Alcohols Market Revenues & Volume Share, By Type, 2022 & 2032F |
3.6 Australia Oxo Alcohols Market Revenues & Volume Share, By Application, 2022 & 2032F |
4 Australia Oxo Alcohols Market Dynamics |
4.1 Impact Analysis |
4.2 Market Drivers |
4.2.1 Increasing demand for plasticizers and coatings in various industries |
4.2.2 Growth in the construction and automotive sectors driving the demand for oxo alcohols |
4.2.3 Shift towards eco-friendly and sustainable products leading to higher adoption of bio-based oxo alcohols |
4.3 Market Restraints |
4.3.1 Fluctuating raw material prices impacting the production costs of oxo alcohols |
4.3.2 Stringent government regulations related to environmental impact and safety standards |
4.3.3 Competition from alternative chemicals and substitutes affecting the market growth |
5 Australia Oxo Alcohols Market Trends |
6 Australia Oxo Alcohols Market, By Types |
6.1 Australia Oxo Alcohols Market, By Type |
6.1.1 Overview and Analysis |
6.1.2 Australia Oxo Alcohols Market Revenues & Volume, By Type, 2022-2032F |
6.1.3 Australia Oxo Alcohols Market Revenues & Volume, By N-Butanol, 2022-2032F |
6.1.4 Australia Oxo Alcohols Market Revenues & Volume, By ISO Butanol, 2022-2032F |
6.1.5 Australia Oxo Alcohols Market Revenues & Volume, By 2-Ethylhexanol, 2022-2032F |
6.2 Australia Oxo Alcohols Market, By Application |
6.2.1 Overview and Analysis |
6.2.2 Australia Oxo Alcohols Market Revenues & Volume, By Acrylates, 2022-2032F |
6.2.3 Australia Oxo Alcohols Market Revenues & Volume, By Glycol Ethers, 2022-2032F |
6.2.4 Australia Oxo Alcohols Market Revenues & Volume, By Acetates, 2022-2032F |
6.2.5 Australia Oxo Alcohols Market Revenues & Volume, By Lube Oil Additives, 2022-2032F |
6.2.6 Australia Oxo Alcohols Market Revenues & Volume, By Resins, 2022-2032F |
6.2.7 Australia Oxo Alcohols Market Revenues & Volume, By Solvents, 2022-2032F |
7 Australia Oxo Alcohols Market Import-Export Trade Statistics |
7.1 Australia Oxo Alcohols Market Export to Major Countries |
7.2 Australia Oxo Alcohols Market Imports from Major Countries |
8 Australia Oxo Alcohols Market Key Performance Indicators |
8.1 Research and development investment in new oxo alcohol technologies |
8.2 Adoption rate of bio-based oxo alcohols in different industries |
8.3 Number of partnerships and collaborations for expanding market presence and product offerings |
9 Australia Oxo Alcohols Market - Opportunity Assessment |
9.1 Australia Oxo Alcohols Market Opportunity Assessment, By Type, 2022 & 2032F |
9.2 Australia Oxo Alcohols Market Opportunity Assessment, By Application, 2022 & 2032F |
10 Australia Oxo Alcohols Market - Competitive Landscape |
10.1 Australia Oxo Alcohols Market Revenue Share, By Companies, 2025 |
10.2 Australia Oxo Alcohols Market Competitive Benchmarking, By Operating and Technical Parameters |
11 Company Profiles |
12 Recommendations |
13 Disclaimer |
Global Go To Market Strategy - 2030
Export potential enables firms to identify high-growth global markets with greater confidence by combining advanced trade intelligence with a structured quantitative methodology. The framework analyzes emerging demand trends and country-level import patterns while integrating macroeconomic and trade datasets such as GDP and population forecasts, bilateral import–export flows, tariff structures, elasticity differentials between developed and developing economies, geographic distance, and import demand projections. Using weighted trade values from 2020–2024 as the base period to project country-to-country export potential for 2030, these inputs are operationalized through calculated drivers such as gravity model parameters, tariff impact factors, and projected GDP per-capita growth. Through an analysis of hidden potentials, demand hotspots, and market conditions that are most favorable to success, this method enables firms to focus on target countries, maximize returns, and global expansion with data, backed by accuracy.
By factoring in the projected importer demand gap that is currently unmet and could be potential opportunity, it identifies the potential for the Exporter (Country) among 190 countries, against the general trade analysis, which identifies the biggest importer or exporter.
To discover high-growth global markets and optimize your business strategy:
Click Here
Pricing
- Single User License$ 1,995
- Department License$ 2,400
- Site License$ 3,120
- Global License$ 3,795

Leadership Perspectives from Industry Events
Search
Thought Leadership and Analyst Meet


Our Clients
6WResearch In News
- India Export Attractiveness Tracker 2026
- India Air Conditioner Market Set for Strong Rebound in 2026 After Weather-Led Correction and GST-Driven Recovery: 6Wresearch
- ADAS in India: How Automatic Emergency Braking, Blind Spot Detection & Driver Monitoring are Transforming Road Safety
- Doha a strategic location for EV manufacturing hub: IPA Qatar
- Demand for luxury TVs surging in the GCC, says Samsung
- Empowering Growth: The Thriving Journey of Bangladesh’s Cable Industry
Latest Reports
- Nicaragua RPG Gaming Market (2026-2032)
- New Zealand RPG Gaming Market (2026-2032)
- Netherlands RPG Gaming Market (2026-2032)
- Nauru RPG Gaming Market (2026-2032)
- Namibia RPG Gaming Market (2026-2032)
- Mozambique RPG Gaming Market (2026-2032)
- Montenegro RPG Gaming Market (2026-2032)
- Mongolia RPG Gaming Market (2026-2032)
- Monaco RPG Gaming Market (2026-2032)
- Micronesia RPG Gaming Market (2026-2032)
Industry Events and Analyst Meet

EV India Expo 2026

HIMTEX 2026

India Refining Summit 2026

India EV Show 2026

EV tech India Expo 2026
Whitepaper
- Middle East & Africa Commercial Security Market Click here to view more.
- Middle East & Africa Fire Safety Systems & Equipment Market Click here to view more.
- GCC Drone Market Click here to view more.
- Middle East Lighting Fixture Market Click here to view more.
- GCC Physical & Perimeter Security Market Click here to view more.