Australia Paper and Board Market (2026-2032) | Segmentation, Companies, Value, Outlook, Industry, Analysis, Competitive Landscape, Share, Forecast, Trends, Growth, Size & Revenue
Market Forecast By Type (Printing and Writing, Newsprint, Tissue, Cartonboard, Containerboard, Other Types) And Competitive Landscape
| Product Code: ETC6187588 | Publication Date: Sep 2024 | Updated Date: Mar 2026 | Product Type: Market Research Report | |
| Publisher: 6Wresearch | Author: Ravi Bhandari | No. of Pages: 75 | No. of Figures: 35 | No. of Tables: 20 |
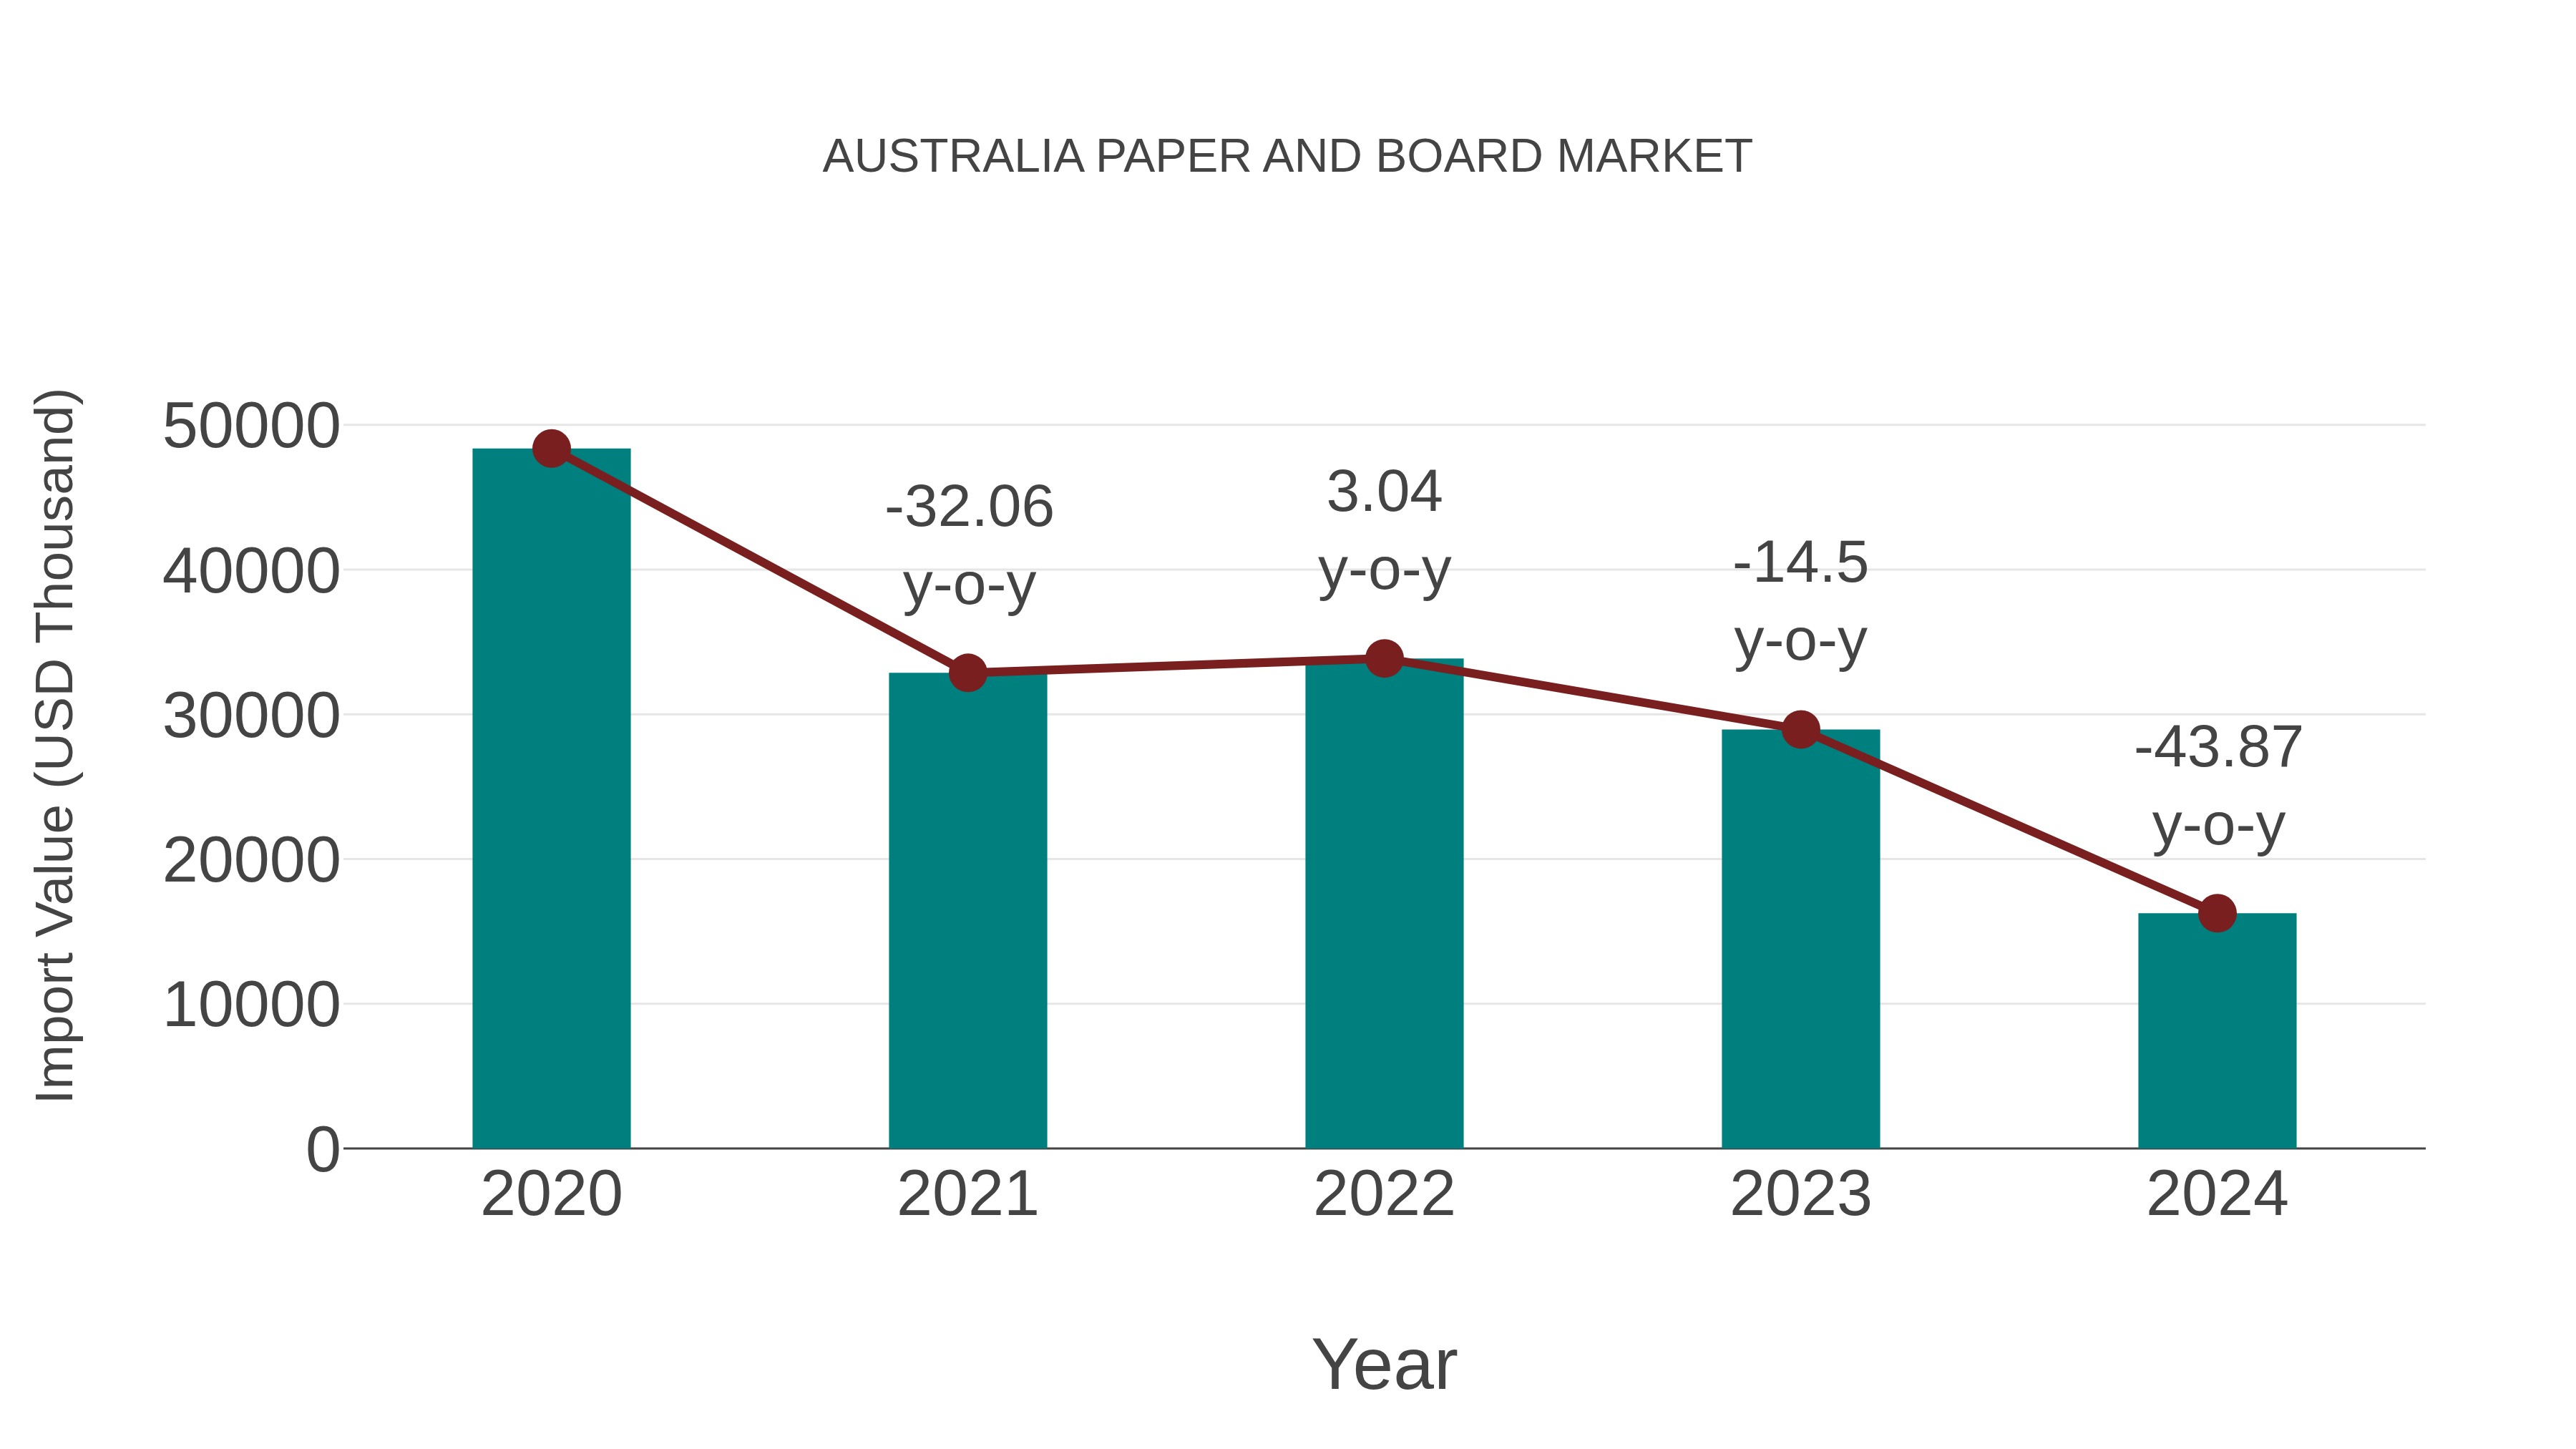
Australia Paper and Board Market: Import Trend Analysis
In the Australia paper and board market, the import trend experienced a notable decline from 2023 to 2024, with a growth rate of -43.87%. The compound annual growth rate (CAGR) for the period of 2020-2024 stood at -23.86%. This substantial decrease could be attributed to shifting demand patterns or changes in trade policies impacting market stability.
Australia Paper And Board Market Overview
The paper and board market in Australia serves diverse end-use industries such as packaging, publishing, and consumer goods. Rising e-commerce activities drive demand for corrugated and folding cartons, while regulatory emphasis on sustainability promotes recycled and FSC-certified products. Despite competition from plastic packaging, innovations in paperboard strength and barrier properties support market growth. Market players are increasingly focusing on circular economy principles to minimize waste.
Trends of the market
The paper and board market in Australia is closely tied to packaging demand and sustainability trends. Growth in food, beverage, and e-commerce sectors is propelling demand for corrugated boards and folding cartons. The market is increasingly shaped by efforts to replace plastics with paper-based materials in packaging. Consumer preference for recyclable and compostable products, along with regulatory restrictions on single-use plastics, are key drivers. Investments in recycling infrastructure and circular economy initiatives further reinforce market momentum.
Challenges of the market
Similar to the paper market, the Australia Paper and Board Market contends with reduced demand driven by digital alternatives and sustainability concerns. The increasing need for recyclable and biodegradable board materials requires constant innovation and higher production costs. The industry also struggles with supply chain disruptions and price fluctuations in raw materials, affecting overall profitability.
Investment opportunities in the Market
Investment in this market is boosted by growing demand in food packaging, retail, and e-commerce sectors. Sustainable paperboard options and recyclable packaging materials align with consumer and regulatory expectations, encouraging capital flows into innovation and capacity expansion. Integrating circular economy principles can further enhance market positioning.
Government Policy of the market
Similar to the paper market, the paper and board market in Australia operates within a framework of policies emphasizing sustainable resource use and recycling. The governments waste management policies promote circular economy principles, requiring companies to reduce landfill contributions through recycling programs. Moreover, import tariffs and trade policies affect the competitive landscape, balancing protection for domestic producers with market access for international players.
Key Highlights of the Report:
- Australia Paper and Board Market Outlook
- Market Size of Australia Paper and Board Market, 2025
- Forecast of Australia Paper and Board Market, 2032
- Historical Data and Forecast of Australia Paper and Board Revenues & Volume for the Period 2022 - 2032F
- Australia Paper and Board Market Trend Evolution
- Australia Paper and Board Market Drivers and Challenges
- Australia Paper and Board Price Trends
- Australia Paper and Board Porter's Five Forces
- Australia Paper and Board Industry Life Cycle
- Historical Data and Forecast of Australia Paper and Board Market Revenues & Volume By Type for the Period 2022 - 2032F
- Historical Data and Forecast of Australia Paper and Board Market Revenues & Volume By Printing and Writing for the Period 2022 - 2032F
- Historical Data and Forecast of Australia Paper and Board Market Revenues & Volume By Newsprint for the Period 2022 - 2032F
- Historical Data and Forecast of Australia Paper and Board Market Revenues & Volume By Tissue for the Period 2022 - 2032F
- Historical Data and Forecast of Australia Paper and Board Market Revenues & Volume By Cartonboard for the Period 2022 - 2032F
- Historical Data and Forecast of Australia Paper and Board Market Revenues & Volume By Containerboard for the Period 2022 - 2032F
- Historical Data and Forecast of Australia Paper and Board Market Revenues & Volume By Other Types for the Period 2022 - 2032F
- Australia Paper and Board Import Export Trade Statistics
- Market Opportunity Assessment By Type
- Australia Paper and Board Top Companies Market Share
- Australia Paper and Board Competitive Benchmarking By Technical and Operational Parameters
- Australia Paper and Board Company Profiles
- Australia Paper and Board Key Strategic Recommendations
Australia Paper and Board Market (2026-2032): FAQs
6Wresearch actively monitors the Australia Paper and Board Market and publishes its comprehensive annual report, highlighting emerging trends, growth drivers, revenue analysis, and forecast outlook. Our insights help businesses to make data-backed strategic decisions with ongoing market dynamics. Our analysts track relevent industries related to the Australia Paper and Board Market, allowing our clients with actionable intelligence and reliable forecasts tailored to emerging regional needs.
Yes, we provide customisation as per your requirements. To learn more, feel free to contact us on sales@6wresearch.com
1 Executive Summary |
2 Introduction |
2.1 Key Highlights of the Report |
2.2 Report Description |
2.3 Market Scope & Segmentation |
2.4 Research Methodology |
2.5 Assumptions |
3 Australia Paper and Board Market Overview |
3.1 Australia Country Macro Economic Indicators |
3.2 Australia Paper and Board Market Revenues & Volume, 2022 & 2032F |
3.3 Australia Paper and Board Market - Industry Life Cycle |
3.4 Australia Paper and Board Market - Porter's Five Forces |
3.5 Australia Paper and Board Market Revenues & Volume Share, By Type, 2022 & 2032F |
4 Australia Paper and Board Market Dynamics |
4.1 Impact Analysis |
4.2 Market Drivers |
4.2.1 Increasing demand for sustainable packaging solutions |
4.2.2 Growth in e-commerce industry leading to higher demand for packaging materials |
4.2.3 Innovations in paper and board products to enhance functionality and sustainability |
4.3 Market Restraints |
4.3.1 Fluctuating raw material prices impacting production costs |
4.3.2 Competition from digital media affecting demand for traditional paper products |
4.3.3 Environmental concerns leading to regulations on paper and board production |
5 Australia Paper and Board Market Trends |
6 Australia Paper and Board Market, By Types |
6.1 Australia Paper and Board Market, By Type |
6.1.1 Overview and Analysis |
6.1.2 Australia Paper and Board Market Revenues & Volume, By Type, 2022 - 2032F |
6.1.3 Australia Paper and Board Market Revenues & Volume, By Printing and Writing, 2022 - 2032F |
6.1.4 Australia Paper and Board Market Revenues & Volume, By Newsprint, 2022 - 2032F |
6.1.5 Australia Paper and Board Market Revenues & Volume, By Tissue, 2022 - 2032F |
6.1.6 Australia Paper and Board Market Revenues & Volume, By Cartonboard, 2022 - 2032F |
6.1.7 Australia Paper and Board Market Revenues & Volume, By Containerboard, 2022 - 2032F |
6.1.8 Australia Paper and Board Market Revenues & Volume, By Other Types, 2022 - 2032F |
7 Australia Paper and Board Market Import-Export Trade Statistics |
7.1 Australia Paper and Board Market Export to Major Countries |
7.2 Australia Paper and Board Market Imports from Major Countries |
8 Australia Paper and Board Market Key Performance Indicators |
8.1 Percentage of recycled content in paper and board products |
8.2 Adoption rate of eco-friendly packaging solutions in the market |
8.3 Investment in research and development for new paper and board product innovations |
9 Australia Paper and Board Market - Opportunity Assessment |
9.1 Australia Paper and Board Market Opportunity Assessment, By Type, 2022 & 2032F |
10 Australia Paper and Board Market - Competitive Landscape |
10.1 Australia Paper and Board Market Revenue Share, By Companies, 2025 |
10.2 Australia Paper and Board Market Competitive Benchmarking, By Operating and Technical Parameters |
11 Company Profiles |
12 Recommendations |
13 Disclaimer |
Global Go To Market Strategy - 2030
Export potential enables firms to identify high-growth global markets with greater confidence by combining advanced trade intelligence with a structured quantitative methodology. The framework analyzes emerging demand trends and country-level import patterns while integrating macroeconomic and trade datasets such as GDP and population forecasts, bilateral import–export flows, tariff structures, elasticity differentials between developed and developing economies, geographic distance, and import demand projections. Using weighted trade values from 2020–2024 as the base period to project country-to-country export potential for 2030, these inputs are operationalized through calculated drivers such as gravity model parameters, tariff impact factors, and projected GDP per-capita growth. Through an analysis of hidden potentials, demand hotspots, and market conditions that are most favorable to success, this method enables firms to focus on target countries, maximize returns, and global expansion with data, backed by accuracy.
By factoring in the projected importer demand gap that is currently unmet and could be potential opportunity, it identifies the potential for the Exporter (Country) among 190 countries, against the general trade analysis, which identifies the biggest importer or exporter.
To discover high-growth global markets and optimize your business strategy:
Click Here
Pricing
- Single User License$ 1,995
- Department License$ 2,400
- Site License$ 3,120
- Global License$ 3,795

Leadership Perspectives from Industry Events
Search
Thought Leadership and Analyst Meet


Our Clients
6WResearch In News
- India Export Attractiveness Tracker 2026
- India Air Conditioner Market Set for Strong Rebound in 2026 After Weather-Led Correction and GST-Driven Recovery: 6Wresearch
- ADAS in India: How Automatic Emergency Braking, Blind Spot Detection & Driver Monitoring are Transforming Road Safety
- Doha a strategic location for EV manufacturing hub: IPA Qatar
- Demand for luxury TVs surging in the GCC, says Samsung
- Empowering Growth: The Thriving Journey of Bangladesh’s Cable Industry
Latest Reports
- Nicaragua RPG Gaming Market (2026-2032)
- New Zealand RPG Gaming Market (2026-2032)
- Netherlands RPG Gaming Market (2026-2032)
- Nauru RPG Gaming Market (2026-2032)
- Namibia RPG Gaming Market (2026-2032)
- Mozambique RPG Gaming Market (2026-2032)
- Montenegro RPG Gaming Market (2026-2032)
- Mongolia RPG Gaming Market (2026-2032)
- Monaco RPG Gaming Market (2026-2032)
- Micronesia RPG Gaming Market (2026-2032)
Industry Events and Analyst Meet

EV India Expo 2026

HIMTEX 2026

India Refining Summit 2026

India EV Show 2026

EV tech India Expo 2026
Whitepaper
- Middle East & Africa Commercial Security Market Click here to view more.
- Middle East & Africa Fire Safety Systems & Equipment Market Click here to view more.
- GCC Drone Market Click here to view more.
- Middle East Lighting Fixture Market Click here to view more.
- GCC Physical & Perimeter Security Market Click here to view more.