Australia Paper bags and sacks packaging Market (2026-2032) | Companies, Industry, Outlook, Size, Analysis, Growth, Value, Revenue, Forecast, Share & Trends
Market Forecast By Product (Flat Paper Bag, Multi-wall Paper Sacks, Other), By Application (Food & Beverage, Pharmaceutical, Retail, Construction, Chemicals, Others) And Competitive Landscape
| Product Code: ETC022495 | Publication Date: Oct 2020 | Updated Date: Jun 2026 | Product Type: Report | |
| Publisher: 6Wresearch | Author: Ravi Bhandari | No. of Pages: 70 | No. of Figures: 35 | No. of Tables: 5 |
Australia Paper bags and sacks packaging Market Summary
The australia paper bags and sacks packaging market was estimated at USD 167 Million in 2025 and is projected to reach USD 196 Million by 2032, growing at a CAGR of 3.0% from 2026 to 2032.
Australia Paper bags and sacks packaging Market Year-wise Growth Rate and Key Drivers
This graph highlights how the Australia Paper bags and sacks packaging Market has steadily grown over the past five years, supported by major growth factors.
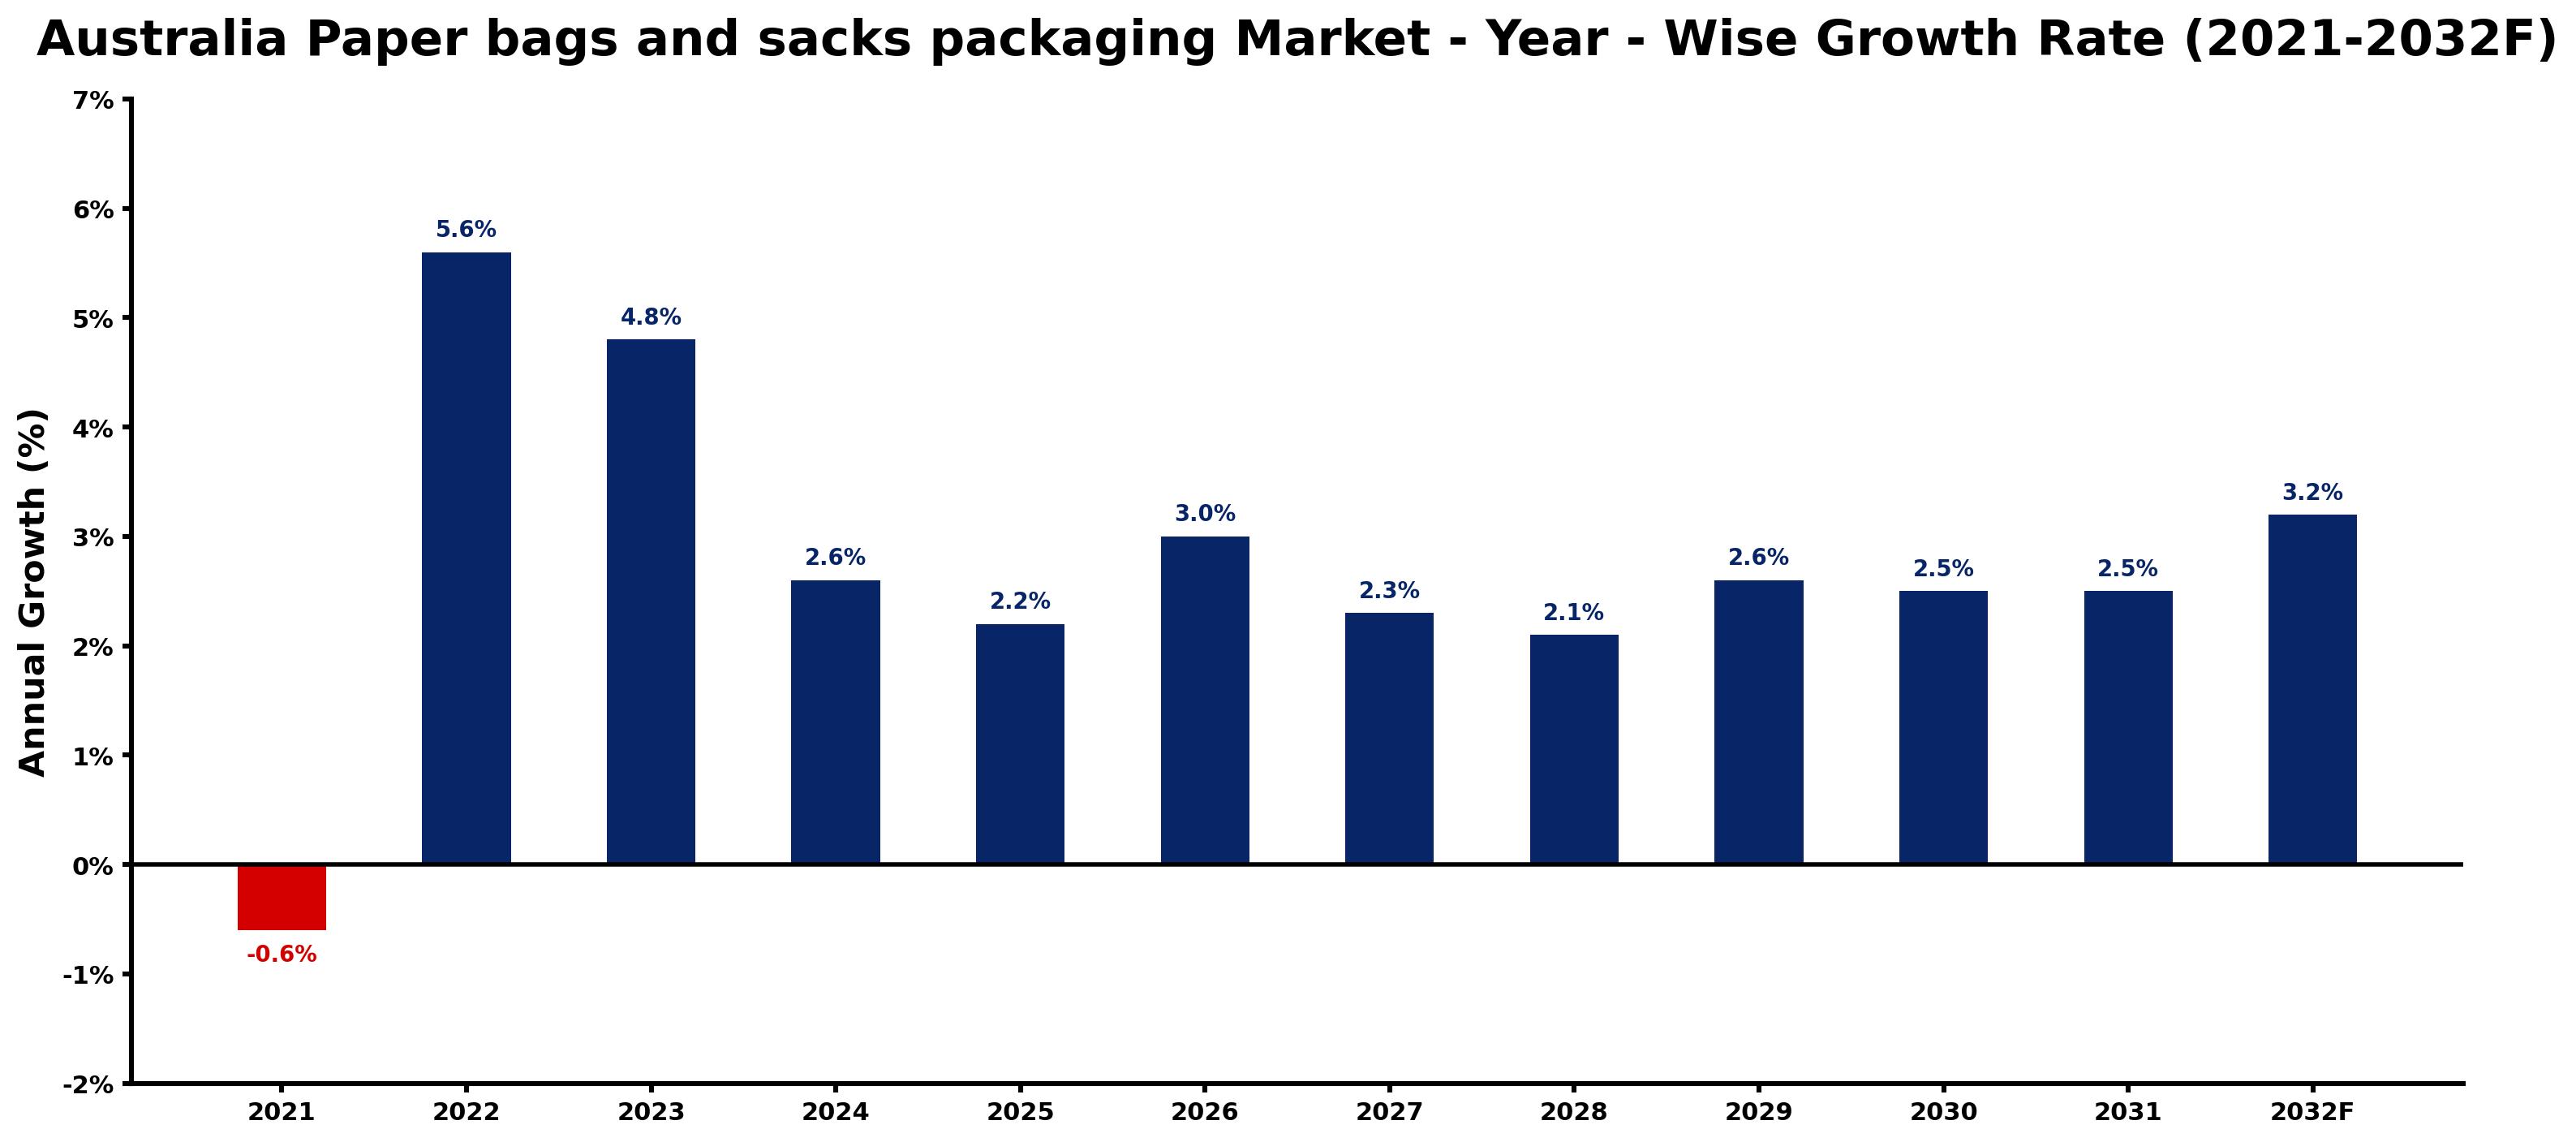
The table below presents the year wise growth rates along with the key drivers influencing the market
| Year | Growth Rate | Major Drivers |
| 2021 | -0.6% | Sustained shifts towards digital alternatives diminished consumer reliance on traditional paper packaging solutions. |
| 2022 | 5.6% | Retailers increasingly sought sustainable packaging suppliers amidst growing environmental awareness campaigns. |
| 2023 | 4.8% | Major brands transitioned to paper bags, enhancing their eco-friendly product lines significantly. |
| 2024 | 2.6% | E-commerce growth spurred demand for innovative paper packaging solutions for shipping and delivery. |
| 2025 | 2.2% | Local businesses began adopting paper sacks, emphasizing community support and sustainability values. |
| 2026 | 3.0% | Rising production costs for plastics prompted manufacturers to pivot toward biodegradable alternatives. |
| 2027 | 2.3% | Corporate sustainability goals became essential as companies aimed for carbon neutrality by 2030. |
| 2028 | 2.1% | Collaborations between paper manufacturers and retailers led to customized sustainable packaging solutions. |
| 2029 | 2.6% | Increased awareness of ocean pollution pushed for further reductions in plastic usage nationwide. |
| 2030 | 2.5% | Urbanization trends created new opportunities for paper packaging in metropolitan supermarket chains. |
| 2031 | 2.5% | Innovative technologies improved paper bag durability, making them viable for heavy-duty packaging. |
| 2032 | 3.2% | Circular economy practices gained traction, influencing packaging design and recycling initiatives nationwide. |
Note - Market size estimations and growth projections presented in this report are based on 6Wresearch's advanced forecasting approach, validated with industry datasets as of June 2026.
Australia Paper bags and sacks packaging Market Synopsis
The Australia Paper bags and sacks packaging Market is projected to reach 3.0% and witness significant growth during the forecast period (2026-2032). This growth is primarily driven by increasing consumer preferences for sustainable and biodegradable packaging solutions. The evolving regulatory landscape aimed at reducing plastic usage is influencing businesses in the food and retail sectors to adopt paper-based packaging alternatives. The market is characterized by a robust shift towards environmentally friendly options, although it faces challenges related to cost and competition from plastic products.
Australia Paper bags and sacks packaging Market Growth Drivers
The Australia Paper bags and sacks packaging Market is experiencing growth driven by several key factors:
- The transition towards eco-friendly packaging solutions is largely being propelled by stringent government regulations that restrict plastic usage. This has led businesses to seek alternatives like paper bags and sacks.
- Increased environmental awareness among consumers is pushing retailers and food service providers to prioritize sustainable packaging. This societal shift is critical in fostering market demand.
- The food and retail industries are significant contributors to the demand for paper-based packaging, as they replace plastic options to align with consumer preferences for sustainability.
- Innovations in paper technology, including moisture-resistant and durable designs, are enhancing the appeal of paper packaging as a viable alternative to plastic.
- Growing global initiatives aimed at reducing waste and promoting recycling bolster the usage of paper bags and sacks, further driving market growth.
Australia Paper bags and sacks packaging Market Challenges and Restraints
While the Australia Paper bags and sacks packaging Market is on an upward trajectory, several challenges threaten its progress:
- Rising raw material costs present a significant challenge, as paper production is often more expensive than plastic alternatives. This can deter businesses from making the switch to more sustainable options.
- Competition from established plastic packaging solutions poses a substantial barrier, as many distributors and retailers still favor plastic for its lower cost and convenience.
- Environmental regulations supporting biodegradable alternatives create pressure on traditional paper manufacturers, necessitating investment in sustainable practices and materials.
- Consumer education regarding the benefits and environmental impacts of paper packaging is crucial, as a lack of awareness may hinder market growth.
- Market volatility in raw material supply can affect production consistency and pricing strategies for paper packaging manufacturers.
Australia Paper bags and sacks packaging Market Investment Opportunities
The Australia Paper bags and sacks packaging Market presents various opportunities for investment and growth:
- The regulatory push towards reducing plastic waste creates an attractive environment for businesses to invest in biodegradable paper materials and technologies.
- Entrepreneurs can leverage the demand for innovative packaging designs that enhance durability without compromising sustainability, thus creating niche market segments.
- Collaboration with governmental initiatives focused on waste reduction can provide financial incentives to businesses transitioning to paper solutions.
- Investments in supply chain improvements and sustainable sourcing of raw materials can enhance competitiveness and appeal to environmentally conscious consumers.
- Research and development in advanced paper manufacturing processes can result in enhanced product offerings that meet the increasing demands of various industries.
Australia Paper bags and sacks packaging Market Government Investment and Initiatives
The Australian government plays a pivotal role in supporting the growth of the paper bags and sacks packaging market through various policies and initiatives:
- The National Waste Policy Action Plan places a significant emphasis on reducing plastic waste, directing funds towards sustainable packaging development, including paper-based solutions.
- Government regulations under the Packaging Covenant encourage manufacturers to adopt sustainable practices, ensuring that raw materials are sourced responsibly.
- Incentives for research in alternative materials bolster the innovation landscape within the paper packaging sector, aiding advancements in eco-friendly solutions.
- Public spending on recycling infrastructure and education initiatives enhances the overall market environment, promoting the benefits of paper over plastic.
- Regulatory frameworks facilitate compliance with environmental safety standards, ensuring that both domestic manufacturers and importers adhere to sustainable practices.
Australia Paper bags and sacks packaging Market Latest Developments (May 2025 - June 2026)
Recent developments in the Australia Paper bags and sacks packaging Market reflect a continual shift towards sustainability and innovation:
- There has been a notable increase in collaborations between industry players and environmental organizations to promote biodegradable packaging solutions across retail and food sectors.
- Technological advancements in paper production have emerged, emphasizing moisture-resistant and tear-proof qualities, broadening the applicability of paper packaging.
- Consumer awareness campaigns initiated by governmental and non-governmental organizations have successfully heightened public understanding of the environmental impacts of packaging choices.
- Several local municipalities have adopted stricter regulations regarding plastic packaging, further incentivizing businesses to enhance their paper packaging offerings.
- Investment in research initiatives aimed at developing alternative cellulose sources for paper production has gained momentum, contributing to sustainable growth in the sector.
Australia Paper bags and sacks packaging Market - Key Attractiveness of the Report
- 10 Years of Market Numbers
- Historical Data Starting from 2022 to 2025
- Base Year: 2025
- Forecast Data until 2032
- Key Performance Indicators Impacting the Market
- Major Upcoming Developments and Projects
Key Highlights of the Report:
- Australia Paper bags and sacks packaging Market Outlook
- Market Size of Australia Paper bags and sacks packaging Market, 2025
- Forecast of Australia Paper bags and sacks packaging Market, 2032
- Historical Data and Forecast of Australia Paper bags and sacks packaging Revenues & Volume for the Period 2022-2032F
- Australia Paper bags and sacks packaging Market Trend Evolution
- Australia Paper bags and sacks packaging Market Drivers and Challenges
- Australia Paper bags and sacks packaging Price Trends
- Australia Paper bags and sacks packaging Porter's Five Forces
- Australia Paper bags and sacks packaging Industry Life Cycle
- Historical Data and Forecast of Australia Paper bags and sacks packaging Market Revenues & Volume By Product for the Period 2022-2032F
- Historical Data and Forecast of Australia Paper bags and sacks packaging Market Revenues & Volume By Flat Paper Bag for the Period 2022-2032F
- Historical Data and Forecast of Australia Paper bags and sacks packaging Market Revenues & Volume By Multi-wall Paper Sacks for the Period 2022-2032F
- Historical Data and Forecast of Australia Paper bags and sacks packaging Market Revenues & Volume By Other for the Period 2022-2032F
- Historical Data and Forecast of Australia Paper bags and sacks packaging Market Revenues & Volume By Application for the Period 2022-2032F
- Historical Data and Forecast of Australia Paper bags and sacks packaging Market Revenues & Volume By Food & Beverage for the Period 2022-2032F
- Historical Data and Forecast of Australia Paper bags and sacks packaging Market Revenues & Volume By Pharmaceutical for the Period 2022-2032F
- Historical Data and Forecast of Australia Paper bags and sacks packaging Market Revenues & Volume By Retail for the Period 2022-2032F
- Historical Data and Forecast of Australia Paper bags and sacks packaging Market Revenues & Volume By Construction for the Period 2022-2032F
- Historical Data and Forecast of Australia Paper bags and sacks packaging Market Revenues & Volume By Chemicals for the Period 2022-2032F
- Historical Data and Forecast of Australia Paper bags and sacks packaging Market Revenues & Volume By Others for the Period 2022-2032F
- Australia Paper bags and sacks packaging Import Export Trade Statistics
- Market Opportunity Assessment By Product
- Market Opportunity Assessment By Application
- Australia Paper bags and sacks packaging Top Companies Market Share
- Australia Paper bags and sacks packaging Competitive Benchmarking By Technical and Operational Parameters
- Australia Paper bags and sacks packaging Company Profiles
- Australia Paper bags and sacks packaging Key Strategic Recommendations
Frequently Asked Questions About the Market Study (FAQs):
The primary drivers include stringent government regulations on plastic usage, increasing consumer demand for sustainable packaging, and significant contributions from the food and retail industries.
Higher raw material costs can deter businesses from switching to paper packaging, as it often remains more expensive compared to plastic alternatives.
The government promotes sustainable practices through regulations and policies aimed at reducing plastic waste, providing incentives for businesses to adopt eco-friendly packaging solutions.
Investment opportunities include advancements in manufacturing processes, collaboration with sustainability initiatives, and development of innovative packaging solutions that meet consumer demands.
6Wresearch actively monitors the Australia Paper bags and sacks packaging Market and publishes its comprehensive annual report, highlighting emerging trends, growth drivers, revenue analysis, and forecast outlook. Our insights help businesses to make data-backed strategic decisions with ongoing market dynamics. Our analysts track relevent industries related to the Australia Paper bags and sacks packaging Market, allowing our clients with actionable intelligence and reliable forecasts tailored to emerging regional needs.
Yes, we provide customisation as per your requirements. To learn more, feel free to contact us on sales@6wresearch.com
1 Executive Summary |
2 Introduction |
2.1 Key Highlights of the Report |
2.2 Report Description |
2.3 Market Scope & Segmentation |
2.4 Research Methodology |
2.5 Assumptions |
3 Australia Paper bags and sacks packaging Market Overview |
3.1 Australia Country Macro Economic Indicators |
3.2 Australia Paper bags and sacks packaging Market Revenues & Volume, 2022 & 2032F |
3.3 Australia Paper bags and sacks packaging Market - Industry Life Cycle |
3.4 Australia Paper bags and sacks packaging Market - Porter's Five Forces |
3.5 Australia Paper bags and sacks packaging Market Revenues & Volume Share, By Product, 2022 & 2032F |
3.6 Australia Paper bags and sacks packaging Market Revenues & Volume Share, By Application, 2022 & 2032F |
4 Australia Paper bags and sacks packaging Market Dynamics |
4.1 Impact Analysis |
4.2 Market Drivers |
4.2.1 Increasing awareness and demand for sustainable and eco-friendly packaging solutions |
4.2.2 Government regulations promoting the use of biodegradable packaging materials |
4.2.3 Growth in e-commerce industry leading to higher demand for packaging solutions |
4.3 Market Restraints |
4.3.1 Fluctuating raw material prices impacting production costs |
4.3.2 Competition from alternative packaging materials like plastic and reusable bags |
5 Australia Paper bags and sacks packaging Market Trends |
6 Australia Paper bags and sacks packaging Market, By Types |
6.1 Australia Paper bags and sacks packaging Market, By Product |
6.1.1 Overview and Analysis |
6.1.2 Australia Paper bags and sacks packaging Market Revenues & Volume, By Product, 2022-2032F |
6.1.3 Australia Paper bags and sacks packaging Market Revenues & Volume, By Flat Paper Bag, 2022-2032F |
6.1.4 Australia Paper bags and sacks packaging Market Revenues & Volume, By Multi-wall Paper Sacks, 2022-2032F |
6.1.5 Australia Paper bags and sacks packaging Market Revenues & Volume, By Other, 2022-2032F |
6.2 Australia Paper bags and sacks packaging Market, By Application |
6.2.1 Overview and Analysis |
6.2.2 Australia Paper bags and sacks packaging Market Revenues & Volume, By Food & Beverage, 2022-2032F |
6.2.3 Australia Paper bags and sacks packaging Market Revenues & Volume, By Pharmaceutical, 2022-2032F |
6.2.4 Australia Paper bags and sacks packaging Market Revenues & Volume, By Retail, 2022-2032F |
6.2.5 Australia Paper bags and sacks packaging Market Revenues & Volume, By Construction, 2022-2032F |
6.2.6 Australia Paper bags and sacks packaging Market Revenues & Volume, By Chemicals, 2022-2032F |
6.2.7 Australia Paper bags and sacks packaging Market Revenues & Volume, By Others, 2022-2032F |
7 Australia Paper bags and sacks packaging Market Import-Export Trade Statistics |
7.1 Australia Paper bags and sacks packaging Market Export to Major Countries |
7.2 Australia Paper bags and sacks packaging Market Imports from Major Countries |
8 Australia Paper bags and sacks packaging Market Key Performance Indicators |
8.1 Percentage of recycled content used in paper bags and sacks |
8.2 Carbon footprint reduction achieved through the use of sustainable packaging |
8.3 Number of new product innovations in paper bags and sacks packaging industry |
9 Australia Paper bags and sacks packaging Market - Opportunity Assessment |
9.1 Australia Paper bags and sacks packaging Market Opportunity Assessment, By Product, 2022 & 2032F |
9.2 Australia Paper bags and sacks packaging Market Opportunity Assessment, By Application, 2022 & 2032F |
10 Australia Paper bags and sacks packaging Market - Competitive Landscape |
10.1 Australia Paper bags and sacks packaging Market Revenue Share, By Companies, 2025 |
10.2 Australia Paper bags and sacks packaging Market Competitive Benchmarking, By Operating and Technical Parameters |
11 Company Profiles |
12 Recommendations |
13 Disclaimer |
Global Go To Market Strategy - 2030
Export potential enables firms to identify high-growth global markets with greater confidence by combining advanced trade intelligence with a structured quantitative methodology. The framework analyzes emerging demand trends and country-level import patterns while integrating macroeconomic and trade datasets such as GDP and population forecasts, bilateral import–export flows, tariff structures, elasticity differentials between developed and developing economies, geographic distance, and import demand projections. Using weighted trade values from 2020–2024 as the base period to project country-to-country export potential for 2030, these inputs are operationalized through calculated drivers such as gravity model parameters, tariff impact factors, and projected GDP per-capita growth. Through an analysis of hidden potentials, demand hotspots, and market conditions that are most favorable to success, this method enables firms to focus on target countries, maximize returns, and global expansion with data, backed by accuracy.
By factoring in the projected importer demand gap that is currently unmet and could be potential opportunity, it identifies the potential for the Exporter (Country) among 190 countries, against the general trade analysis, which identifies the biggest importer or exporter.
To discover high-growth global markets and optimize your business strategy:
Click Here
Pricing
- Single User License$ 1,995
- Department License$ 2,400
- Site License$ 3,120
- Global License$ 3,795

Leadership Perspectives from Industry Events
Search
Thought Leadership and Analyst Meet


Our Clients
6WResearch In News
- India Air Conditioner Market Set for Strong Rebound in 2026 After Weather-Led Correction and GST-Driven Recovery: 6Wresearch
- ADAS in India: How Automatic Emergency Braking, Blind Spot Detection & Driver Monitoring are Transforming Road Safety
- Doha a strategic location for EV manufacturing hub: IPA Qatar
- Demand for luxury TVs surging in the GCC, says Samsung
- Empowering Growth: The Thriving Journey of Bangladesh’s Cable Industry
- Demand for luxury TVs surging in the GCC, says Samsung
Latest Reports
- Nicaragua RPG Gaming Market (2026-2032)
- New Zealand RPG Gaming Market (2026-2032)
- Netherlands RPG Gaming Market (2026-2032)
- Nauru RPG Gaming Market (2026-2032)
- Namibia RPG Gaming Market (2026-2032)
- Mozambique RPG Gaming Market (2026-2032)
- Montenegro RPG Gaming Market (2026-2032)
- Mongolia RPG Gaming Market (2026-2032)
- Monaco RPG Gaming Market (2026-2032)
- Micronesia RPG Gaming Market (2026-2032)
Industry Events and Analyst Meet

EV India Expo 2026

HIMTEX 2026

India Refining Summit 2026

India EV Show 2026

EV tech India Expo 2026
Whitepaper
- Middle East & Africa Commercial Security Market Click here to view more.
- Middle East & Africa Fire Safety Systems & Equipment Market Click here to view more.
- GCC Drone Market Click here to view more.
- Middle East Lighting Fixture Market Click here to view more.
- GCC Physical & Perimeter Security Market Click here to view more.