Australia Partially Hydrolyzed Polyacrylamide (PHPA) Market (2026-2032) | Trends, Forecast, Industry, Outlook, Segmentation, Value, Companies, Competitive Landscape, Size & Revenue, Share, Growth, Analysis
Market Forecast By Type (Anionic, Cationic, Non-ionic, Others), By Function (Viscosifying Agent, Shale & Bore-hole Stabilizer, Excapsulator, Flocculation Agent, Others) And Competitive Landscape
| Product Code: ETC6187647 | Publication Date: Sep 2024 | Updated Date: Mar 2026 | Product Type: Market Research Report | |
| Publisher: 6Wresearch | Author: Summon Dutta | No. of Pages: 75 | No. of Figures: 35 | No. of Tables: 20 |
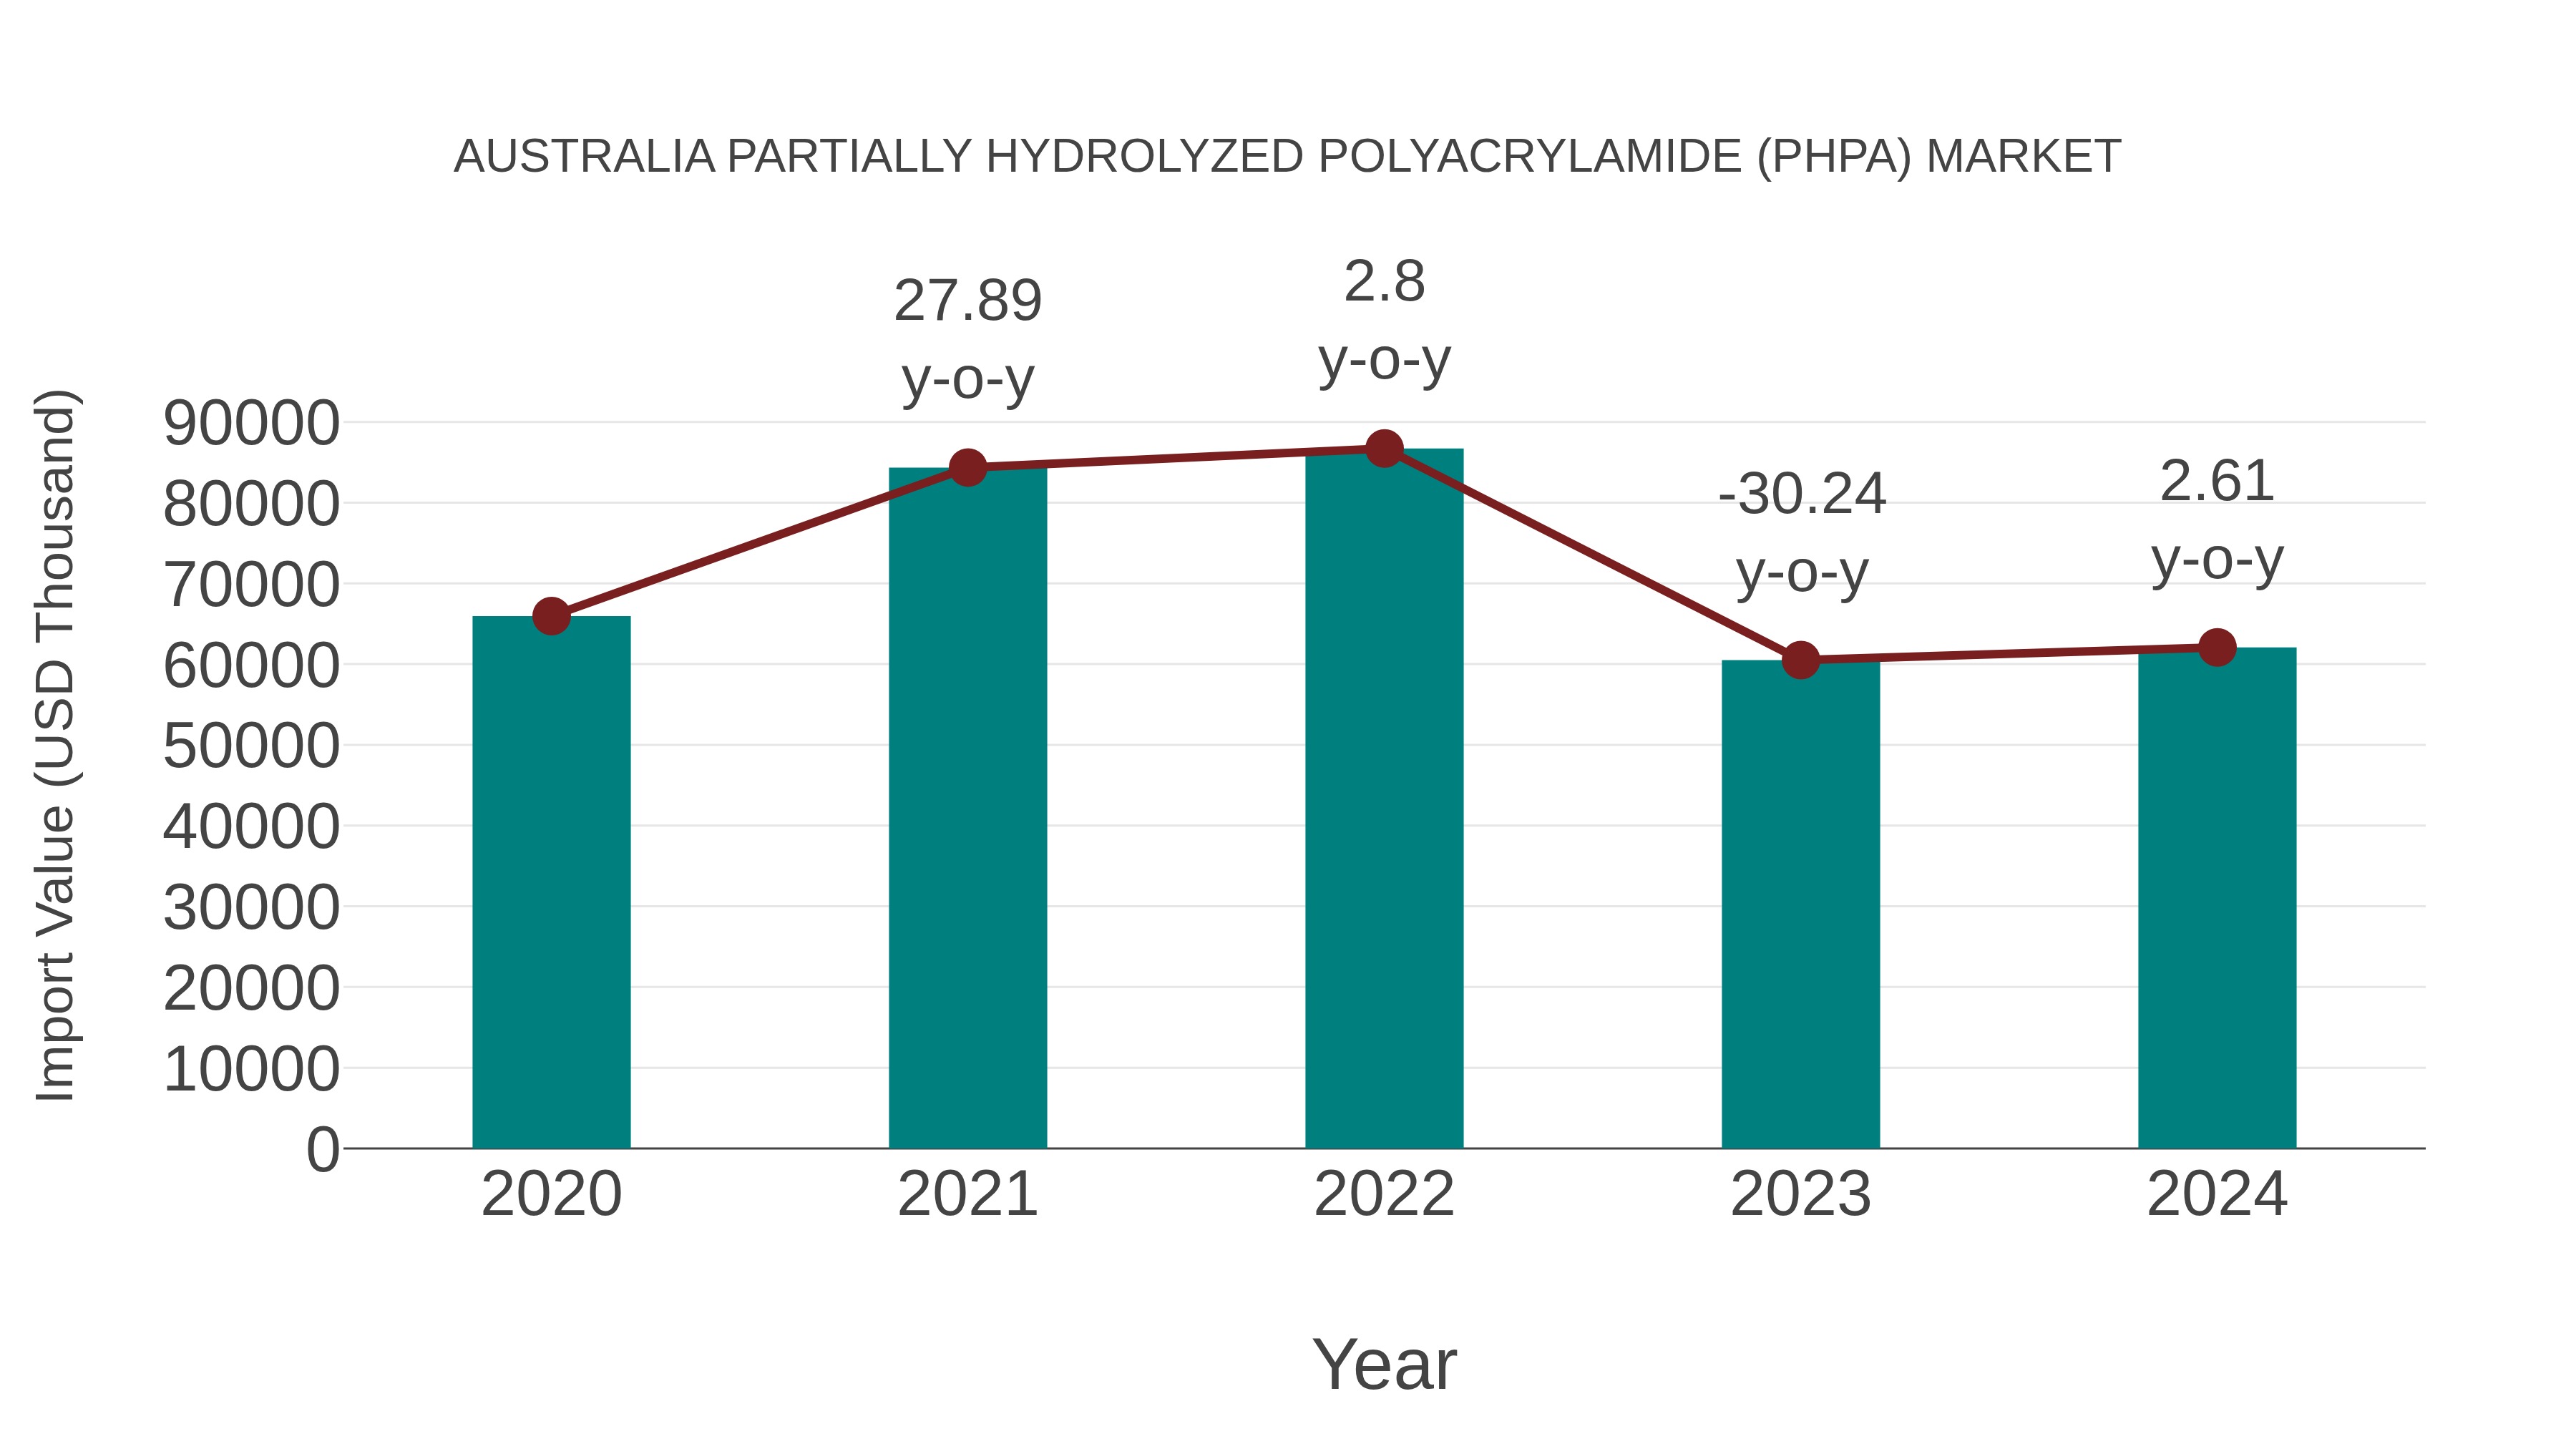
Australia Partially Hydrolyzed Polyacrylamide (Phpa) Market: Import Trend Analysis
In the Australia partially hydrolyzed polyacrylamide (PHPA) market, the import trend for 2023-2024 saw a growth rate of 2.61%, contrasting with a -1.5% compound annual growth rate (CAGR) for 2020-2024. This shift in import momentum could be attributed to evolving industrial processes or changes in demand dynamics within the market.
Australia Partially Hydrolyzed Polyacrylamide Phpa Market Overview
The Australia PHPA market is driven by its increasing use in the oil and gas industry, especially for enhanced oil recovery (EOR) and drilling mud additives. Environmental regulations and a shift towards sustainable drilling practices are pushing demand for bio-compatible and high-performance polymers, influencing the growth of PHPA in various end-use sectors.
Trends of the market
The Australia PHPA market is experiencing steady growth driven by increased demand for enhanced oil recovery techniques in the petroleum industry and expanding water treatment initiatives. The mining and drilling industries are also leveraging PHPA for its superior flocculation properties. Additionally, growing environmental regulations are pushing for improved wastewater treatment processes, further boosting the demand for PHPA-based solutions.
Challenges of the market
The key challenge in the Australian PHPA market is the fluctuating cost of raw materials, particularly acrylamide, which is derived from petrochemicals. Environmental regulations and wastewater discharge standards also impose compliance burdens on manufacturers. Moreover, competition from alternative friction reducers and eco-friendly polymers restricts the market expansion.
Investment opportunities in the Market
The PHPA market in Australia presents substantial investment opportunities driven by the country`s expanding oil and gas exploration activities, particularly in offshore basins. With increased attention on enhanced oil recovery (EOR) techniques, PHPA finds growing application as a drilling fluid additive. Additionally, environmental compliance pressures are leading to higher adoption of eco-friendly polymer-based solutions in water treatment, positioning PHPA as a key material. Investors can capitalize on the demand for high-performance and biodegradable drilling fluids, especially as Australia intensifies efforts towards sustainable resource extraction.
Government Policy of the market
The Australian government regulates the PHPA market through environmental and industrial chemical management frameworks, primarily overseen by the Australian Industrial Chemicals Introduction Scheme (AICIS). These policies ensure that the importation and use of PHPA conform to safety and environmental standards. Additionally, water management policiesespecially those tied to oil and gas extraction or miningimpact the demand and application of PHPA, often guiding the use of eco-friendlier alternatives and water treatment solutions.
Key Highlights of the Report:
- Australia Partially Hydrolyzed Polyacrylamide (PHPA) Market Outlook
- Market Size of Australia Partially Hydrolyzed Polyacrylamide (PHPA) Market, 2025
- Forecast of Australia Partially Hydrolyzed Polyacrylamide (PHPA) Market, 2032
- Historical Data and Forecast of Australia Partially Hydrolyzed Polyacrylamide (PHPA) Revenues & Volume for the Period 2022 - 2032F
- Australia Partially Hydrolyzed Polyacrylamide (PHPA) Market Trend Evolution
- Australia Partially Hydrolyzed Polyacrylamide (PHPA) Market Drivers and Challenges
- Australia Partially Hydrolyzed Polyacrylamide (PHPA) Price Trends
- Australia Partially Hydrolyzed Polyacrylamide (PHPA) Porter's Five Forces
- Australia Partially Hydrolyzed Polyacrylamide (PHPA) Industry Life Cycle
- Historical Data and Forecast of Australia Partially Hydrolyzed Polyacrylamide (PHPA) Market Revenues & Volume By Type for the Period 2022 - 2032F
- Historical Data and Forecast of Australia Partially Hydrolyzed Polyacrylamide (PHPA) Market Revenues & Volume By Anionic for the Period 2022 - 2032F
- Historical Data and Forecast of Australia Partially Hydrolyzed Polyacrylamide (PHPA) Market Revenues & Volume By Cationic for the Period 2022 - 2032F
- Historical Data and Forecast of Australia Partially Hydrolyzed Polyacrylamide (PHPA) Market Revenues & Volume By Non-ionic for the Period 2022 - 2032F
- Historical Data and Forecast of Australia Partially Hydrolyzed Polyacrylamide (PHPA) Market Revenues & Volume By Others for the Period 2022 - 2032F
- Historical Data and Forecast of Australia Partially Hydrolyzed Polyacrylamide (PHPA) Market Revenues & Volume By Function for the Period 2022 - 2032F
- Historical Data and Forecast of Australia Partially Hydrolyzed Polyacrylamide (PHPA) Market Revenues & Volume By Viscosifying Agent for the Period 2022 - 2032F
- Historical Data and Forecast of Australia Partially Hydrolyzed Polyacrylamide (PHPA) Market Revenues & Volume By Shale & Bore-hole Stabilizer for the Period 2022 - 2032F
- Historical Data and Forecast of Australia Partially Hydrolyzed Polyacrylamide (PHPA) Market Revenues & Volume By Excapsulator for the Period 2022 - 2032F
- Historical Data and Forecast of Australia Partially Hydrolyzed Polyacrylamide (PHPA) Market Revenues & Volume By Flocculation Agent for the Period 2022 - 2032F
- Historical Data and Forecast of Australia Partially Hydrolyzed Polyacrylamide (PHPA) Market Revenues & Volume By Others for the Period 2022 - 2032F
- Australia Partially Hydrolyzed Polyacrylamide (PHPA) Import Export Trade Statistics
- Market Opportunity Assessment By Type
- Market Opportunity Assessment By Function
- Australia Partially Hydrolyzed Polyacrylamide (PHPA) Top Companies Market Share
- Australia Partially Hydrolyzed Polyacrylamide (PHPA) Competitive Benchmarking By Technical and Operational Parameters
- Australia Partially Hydrolyzed Polyacrylamide (PHPA) Company Profiles
- Australia Partially Hydrolyzed Polyacrylamide (PHPA) Key Strategic Recommendations
Australia Partially Hydrolyzed Polyacrylamide (PHPA) Market (2026-2032): FAQs
6Wresearch actively monitors the Australia Partially Hydrolyzed Polyacrylamide (PHPA) Market and publishes its comprehensive annual report, highlighting emerging trends, growth drivers, revenue analysis, and forecast outlook. Our insights help businesses to make data-backed strategic decisions with ongoing market dynamics. Our analysts track relevent industries related to the Australia Partially Hydrolyzed Polyacrylamide (PHPA) Market, allowing our clients with actionable intelligence and reliable forecasts tailored to emerging regional needs.
Yes, we provide customisation as per your requirements. To learn more, feel free to contact us on sales@6wresearch.com
1 Executive Summary |
2 Introduction |
2.1 Key Highlights of the Report |
2.2 Report Description |
2.3 Market Scope & Segmentation |
2.4 Research Methodology |
2.5 Assumptions |
3 Australia Partially Hydrolyzed Polyacrylamide (PHPA) Market Overview |
3.1 Australia Country Macro Economic Indicators |
3.2 Australia Partially Hydrolyzed Polyacrylamide (PHPA) Market Revenues & Volume, 2022 & 2032F |
3.3 Australia Partially Hydrolyzed Polyacrylamide (PHPA) Market - Industry Life Cycle |
3.4 Australia Partially Hydrolyzed Polyacrylamide (PHPA) Market - Porter's Five Forces |
3.5 Australia Partially Hydrolyzed Polyacrylamide (PHPA) Market Revenues & Volume Share, By Type, 2022 & 2032F |
3.6 Australia Partially Hydrolyzed Polyacrylamide (PHPA) Market Revenues & Volume Share, By Function, 2022 & 2032F |
4 Australia Partially Hydrolyzed Polyacrylamide (PHPA) Market Dynamics |
4.1 Impact Analysis |
4.2 Market Drivers |
4.2.1 Growing demand for water treatment solutions in Australia |
4.2.2 Increasing focus on environmental protection and sustainable practices |
4.2.3 Expansion of the oil and gas industry in the region |
4.3 Market Restraints |
4.3.1 Stringent regulations on chemical usage in water treatment processes |
4.3.2 Fluctuating raw material prices affecting production costs |
5 Australia Partially Hydrolyzed Polyacrylamide (PHPA) Market Trends |
6 Australia Partially Hydrolyzed Polyacrylamide (PHPA) Market, By Types |
6.1 Australia Partially Hydrolyzed Polyacrylamide (PHPA) Market, By Type |
6.1.1 Overview and Analysis |
6.1.2 Australia Partially Hydrolyzed Polyacrylamide (PHPA) Market Revenues & Volume, By Type, 2022 - 2032F |
6.1.3 Australia Partially Hydrolyzed Polyacrylamide (PHPA) Market Revenues & Volume, By Anionic, 2022 - 2032F |
6.1.4 Australia Partially Hydrolyzed Polyacrylamide (PHPA) Market Revenues & Volume, By Cationic, 2022 - 2032F |
6.1.5 Australia Partially Hydrolyzed Polyacrylamide (PHPA) Market Revenues & Volume, By Non-ionic, 2022 - 2032F |
6.1.6 Australia Partially Hydrolyzed Polyacrylamide (PHPA) Market Revenues & Volume, By Others, 2022 - 2032F |
6.2 Australia Partially Hydrolyzed Polyacrylamide (PHPA) Market, By Function |
6.2.1 Overview and Analysis |
6.2.2 Australia Partially Hydrolyzed Polyacrylamide (PHPA) Market Revenues & Volume, By Viscosifying Agent, 2022 - 2032F |
6.2.3 Australia Partially Hydrolyzed Polyacrylamide (PHPA) Market Revenues & Volume, By Shale & Bore-hole Stabilizer, 2022 - 2032F |
6.2.4 Australia Partially Hydrolyzed Polyacrylamide (PHPA) Market Revenues & Volume, By Excapsulator, 2022 - 2032F |
6.2.5 Australia Partially Hydrolyzed Polyacrylamide (PHPA) Market Revenues & Volume, By Flocculation Agent, 2022 - 2032F |
6.2.6 Australia Partially Hydrolyzed Polyacrylamide (PHPA) Market Revenues & Volume, By Others, 2022 - 2032F |
7 Australia Partially Hydrolyzed Polyacrylamide (PHPA) Market Import-Export Trade Statistics |
7.1 Australia Partially Hydrolyzed Polyacrylamide (PHPA) Market Export to Major Countries |
7.2 Australia Partially Hydrolyzed Polyacrylamide (PHPA) Market Imports from Major Countries |
8 Australia Partially Hydrolyzed Polyacrylamide (PHPA) Market Key Performance Indicators |
8.1 Adoption rate of PHPA in water treatment applications |
8.2 Research and development investment in PHPA technology |
8.3 Number of new applications and industries adopting PHPA technology |
8.4 Efficiency and effectiveness of PHPA compared to traditional alternatives |
9 Australia Partially Hydrolyzed Polyacrylamide (PHPA) Market - Opportunity Assessment |
9.1 Australia Partially Hydrolyzed Polyacrylamide (PHPA) Market Opportunity Assessment, By Type, 2022 & 2032F |
9.2 Australia Partially Hydrolyzed Polyacrylamide (PHPA) Market Opportunity Assessment, By Function, 2022 & 2032F |
10 Australia Partially Hydrolyzed Polyacrylamide (PHPA) Market - Competitive Landscape |
10.1 Australia Partially Hydrolyzed Polyacrylamide (PHPA) Market Revenue Share, By Companies, 2025 |
10.2 Australia Partially Hydrolyzed Polyacrylamide (PHPA) Market Competitive Benchmarking, By Operating and Technical Parameters |
11 Company Profiles |
12 Recommendations |
13 Disclaimer |
Export potential assessment - trade Analytics for 2030
Export potential enables firms to identify high-growth global markets with greater confidence by combining advanced trade intelligence with a structured quantitative methodology. The framework analyzes emerging demand trends and country-level import patterns while integrating macroeconomic and trade datasets such as GDP and population forecasts, bilateral import–export flows, tariff structures, elasticity differentials between developed and developing economies, geographic distance, and import demand projections. Using weighted trade values from 2020–2024 as the base period to project country-to-country export potential for 2030, these inputs are operationalized through calculated drivers such as gravity model parameters, tariff impact factors, and projected GDP per-capita growth. Through an analysis of hidden potentials, demand hotspots, and market conditions that are most favorable to success, this method enables firms to focus on target countries, maximize returns, and global expansion with data, backed by accuracy.
By factoring in the projected importer demand gap that is currently unmet and could be potential opportunity, it identifies the potential for the Exporter (Country) among 190 countries, against the general trade analysis, which identifies the biggest importer or exporter.
To discover high-growth global markets and optimize your business strategy:
Click Here
Pricing
- Single User License$ 1,995
- Department License$ 2,400
- Site License$ 3,120
- Global License$ 3,795

Search
Thought Leadership and Analyst Meet


Our Clients
Latest Reports
- India Ultrasonic Smart Water Meter Market (2026-2032) | Outlook, Competition, Drivers, Trends, Demand, Competitive, Strategic Insights, Companies, Challenges, Strategy, Consumer Insights, Analysis, Opportunities, Growth, Size, Share, Industry, Revenue, Segments, Value, Segmentation, Supply, Forecast, Restraints,
- India Electromagnetic Bulk Flow Meter Market (2026-2032) | Analysis, Challenges, Strategic Insights, Supply, Forecast, Growth, Share, Consumer Insights, Competitive, Value, Outlook, Size & Demand,
- India Battery Powered Bulk Flow Meter Market (2026-2032) | Outlook, Analysis, Competitive Landscape, Growth, Size, Trends, Value, Revenue, Companies, Segmentation, Share & Forecast
- Bosnia and Herzegovina Fuel-Efficient Winglets Market (2026-2032) | Growth, Competition, Strategy, Restraints, Trends, Challenges, segmentation, Value, Outlook, Investment Opportunities, Analysis, Revenue, Companies, Insights, Pricing, Size, Drivers, Demand, Share, Forecast
- Canada Cloud CFD Market (2026-2032) | Size & Revenue, Industry, Growth, Competitive Landscape, Forecast, Segmentation, Value, Outlook, Trends, Share, Analysis, Companies
- Taiwan Food Delivery Platform Market (2026-2032) | Companies, Outlook, Analysis, Trends, Value, Revenue, Segmentation, Share, Forecast, Competitive Landscape, Growth, Size & Forecast
- United Kingdom (UK) Long-term Care Insurance Market (2026-2032) | Growth, Share, Consumer Insights, Drivers, Opportunities, Competition, Pricing Analysis, Segments, Restraints, Companies, Competitive, Value, Outlook, Size, Demand, Analysis, Challenges, Strategic Insights, Investment Trends, Revenue, Trends, Supply, Forecast
- United Kingdom (UK) Long Term Care Market (2026-2032) | Companies, Outlook, Analysis, Trends, Value, Revenue, Segmentation, Share, Forecast, Competitive Landscape, Growth, Size & Forecast
- Iraq Insulation and Waterproofing Market (2026-2032) | Outlook, Drivers, Growth, Size, Share, Industry, Revenue, Trends, Demand, Competitive, Strategic Insights, Opportunities, Segments, Companies, Challenges, Strategy, Consumer Insights, Analysis, Investment Trends, Value, Segmentation, Forecast, Restraints
- India Switchgear Market Outlook (2026-2032) | Size, Share, Trends, Growth, Revenue, Forecast, Analysis, Value, Outlook
Industry Events and Analyst Meet

India EV Show 2026

EV tech India Expo 2026

Auto Tech Asia 2026

Battery Tech India 2026

Smart Production Solutions Guangzhou 2026
Whitepaper
- Middle East & Africa Commercial Security Market Click here to view more.
- Middle East & Africa Fire Safety Systems & Equipment Market Click here to view more.
- GCC Drone Market Click here to view more.
- Middle East Lighting Fixture Market Click here to view more.
- GCC Physical & Perimeter Security Market Click here to view more.
6WResearch In News
- Doha a strategic location for EV manufacturing hub: IPA Qatar
- Demand for luxury TVs surging in the GCC, says Samsung
- Empowering Growth: The Thriving Journey of Bangladesh’s Cable Industry
- Demand for luxury TVs surging in the GCC, says Samsung
- Video call with a traditional healer? Once unthinkable, it’s now common in South Africa
- Intelligent Buildings To Smooth GCC’s Path To Net Zero