Australia Phosphorus Market (2026-2032) Outlook | Forecast, Analysis, Value, Companies, Trends, Growth, Size, Industry, Revenue & Share
Market Forecast By Type (White phosphorus, Red phosphorus, Phosphorous chloride, Phosphoric acid, Industrial phosphates, Phosphorous penta-oxide), By Application (Detergents, Water treatment, Flame retardants, Batteries, Chemical intermediates, Fertilizers) And Competitive Landscape
| Product Code: ETC198287 | Publication Date: May 2022 | Updated Date: Mar 2026 | Product Type: Market Research Report | |
| Publisher: 6Wresearch | Author: Ravi Bhandari | No. of Pages: 60 | No. of Figures: 40 | No. of Tables: 7 |
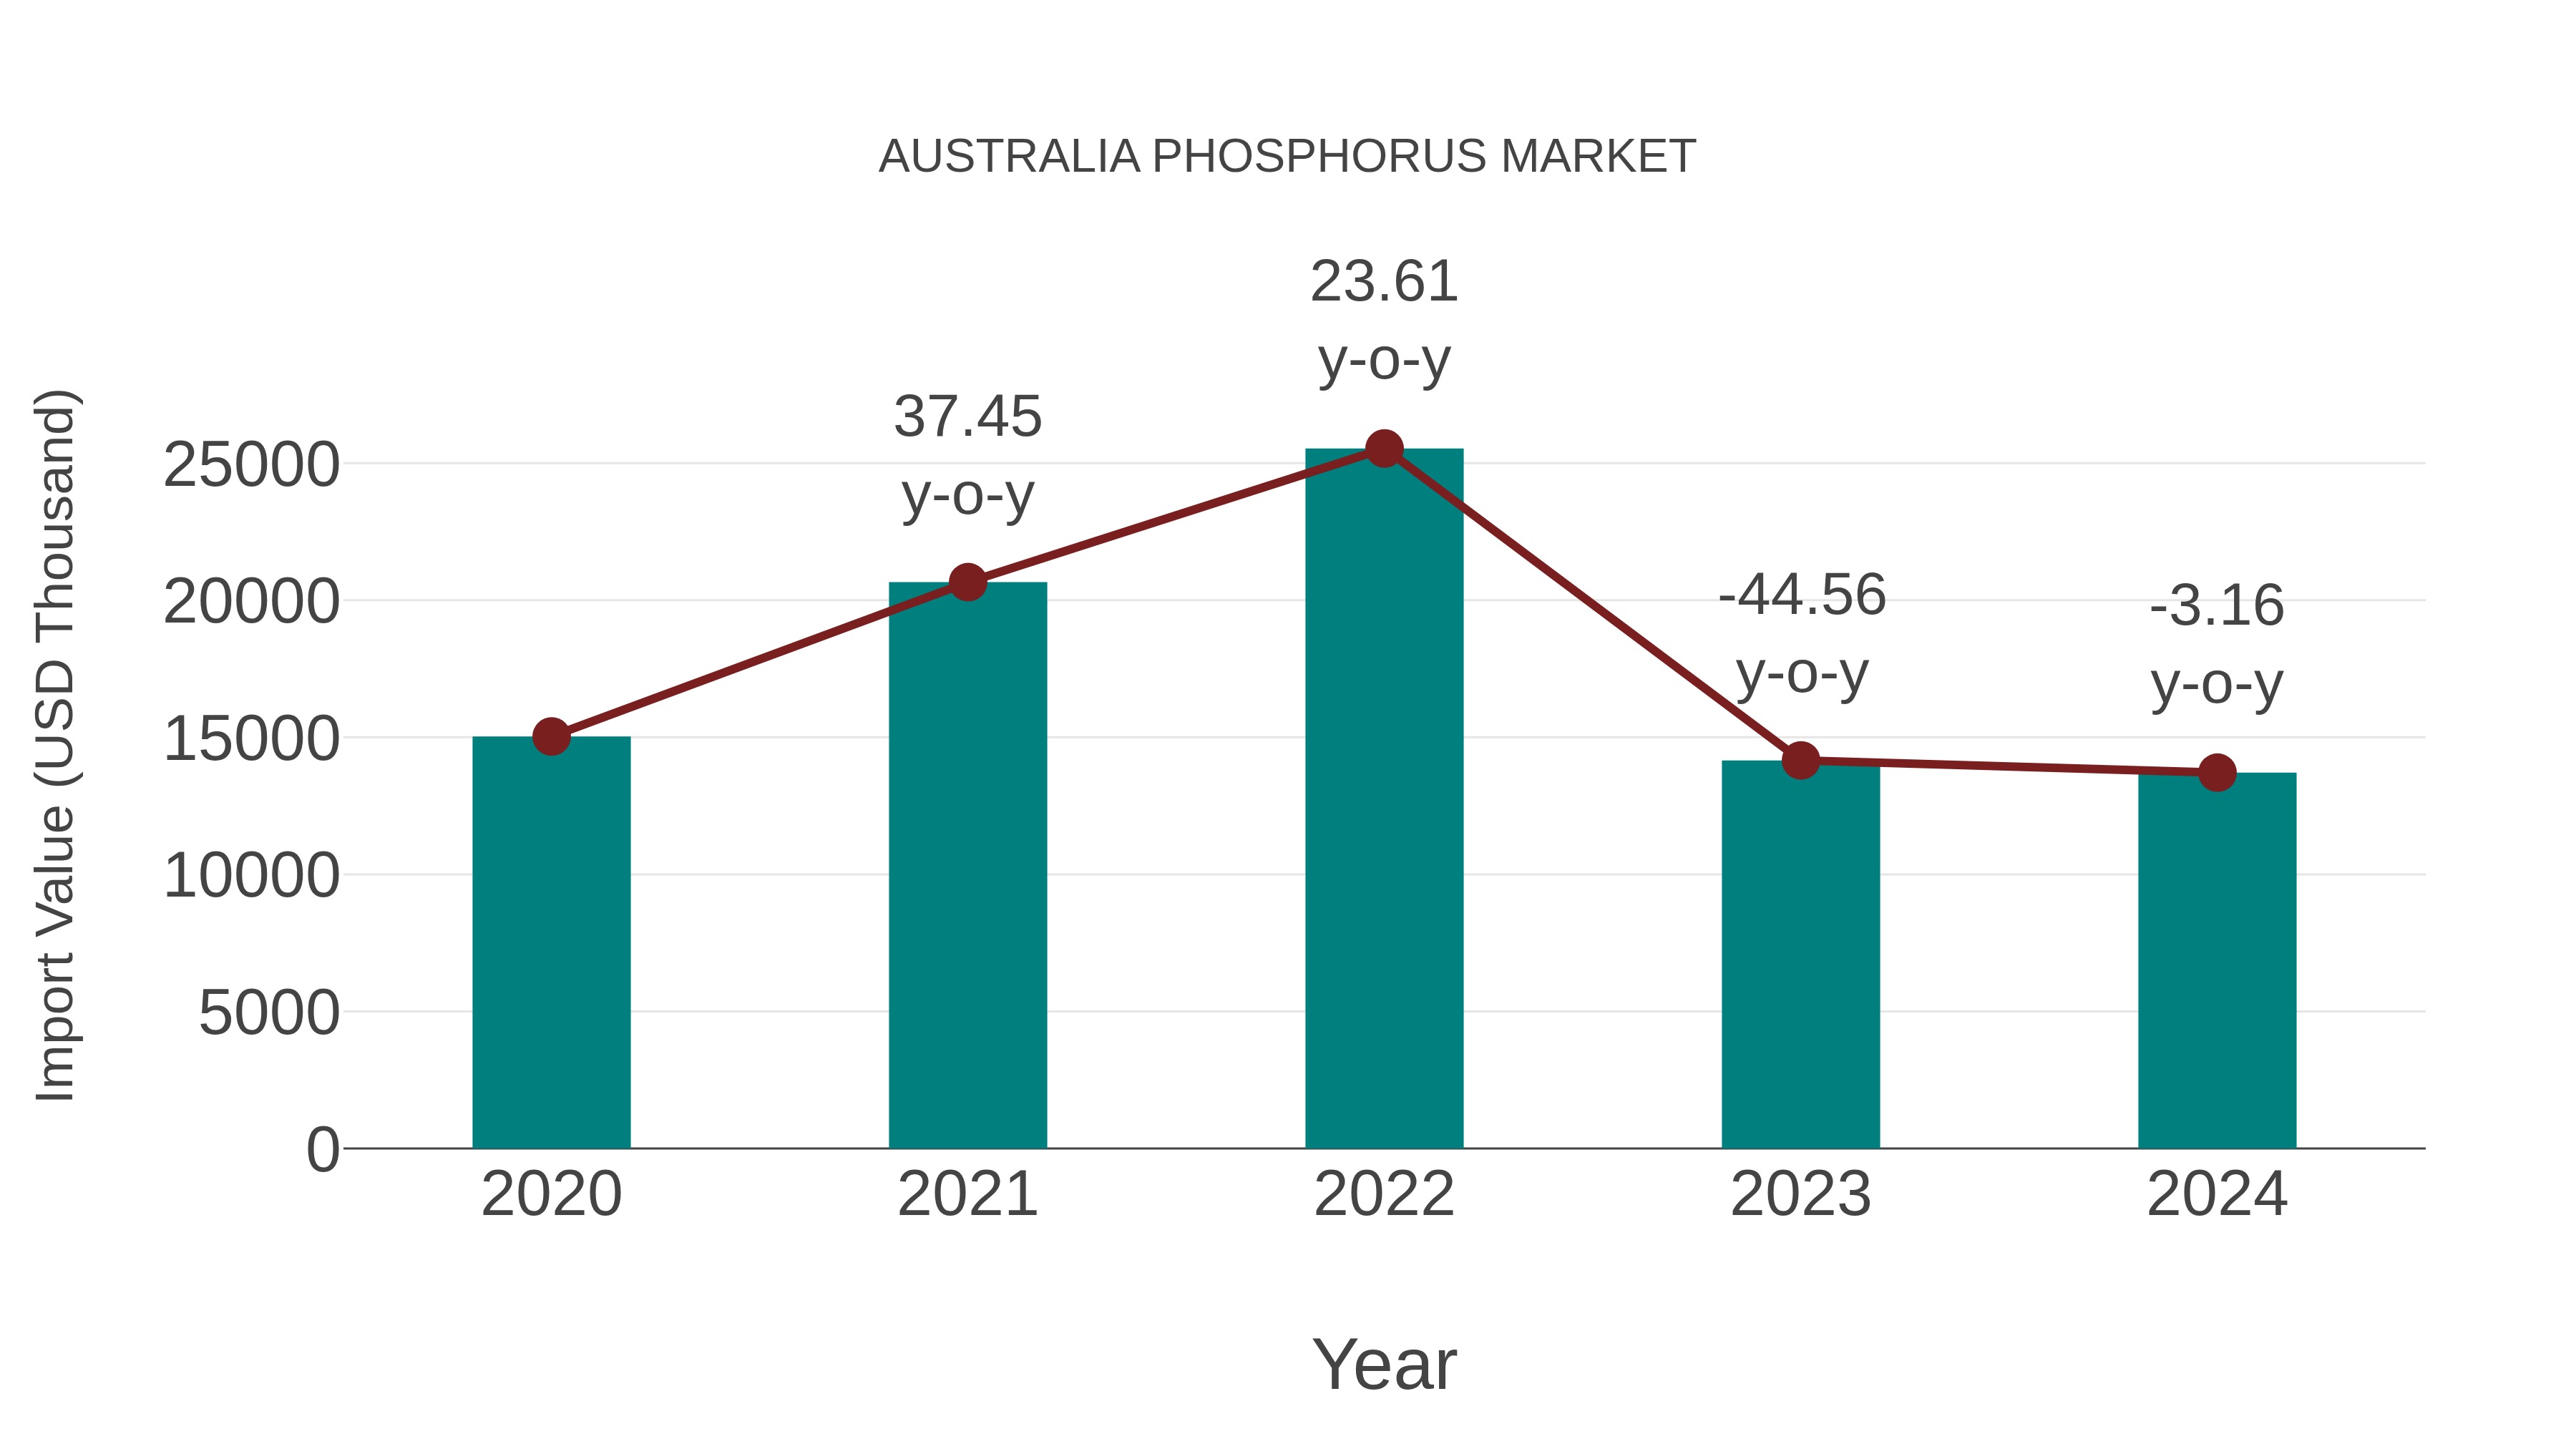
Australia Phosphorus Market: Import Trend Analysis
In the Australia phosphorus market, the import trend experienced a decline from 2023 to 2024, with a growth rate of -3.16%. The compound annual growth rate (CAGR) for imports from 2020 to 2024 stood at -2.27%. This decline could be attributed to shifting demand patterns or changes in trade policies impacting market dynamics.
Australia Phosphorus Market Synopsis
Phosphorus and its derivatives are critical for fertilizer production, flame retardants, and pharmaceuticals. The Australian agriculture sector is a major consumer of phosphorus-based fertilizers, ensuring steady demand. The chemicals applications in industrial and food sectors further strengthen market prospects.
Drivers of the market
The phosphorus market in Australia is primarily driven by the agricultural sector, where phosphorus-based fertilizers are crucial for crop yield. The chemical and food industries also contribute to demand, while research in energy storage solutions involving phosphorus compounds further strengthens market prospects.
Challenges of the market
Phosphorus production in Australia is challenged by limited high-quality phosphate rock reserves, leading to dependency on imports. The environmental impact of phosphate mining, including water pollution and land degradation, has led to stricter government regulations. Additionally, fluctuating global fertilizer demand directly affects the phosphorus market, causing price volatility.
Investment opportunities in the Market
Australias phosphorus market is primarily driven by its applications in fertilizers, industrial chemicals, and pharmaceuticals. Investment opportunities exist in phosphorus mining and processing, sustainable fertilizer production, and high-value phosphorus derivatives for industrial applications. The increasing global focus on food security and high-yield agriculture enhances market potential.
Government Policy of the market
The phosphorus market in Australia is governed by mining regulations, agricultural policies, and environmental laws. The government enforces responsible phosphorus extraction to prevent soil and water contamination. Import and export policies regulate the trade of phosphorus to meet international quality standards. Research initiatives focus on developing sustainable phosphorus sources and reducing dependency on non-renewable phosphorus deposits.
Key Highlights of the Report:
- Australia Phosphorus Market Outlook
- Market Size of Australia Phosphorus Market, 2025
- Forecast of Australia Phosphorus Market, 2032
- Historical Data and Forecast of Australia Phosphorus Revenues & Volume for the Period 2022-2032F
- Australia Phosphorus Market Trend Evolution
- Australia Phosphorus Market Drivers and Challenges
- Australia Phosphorus Price Trends
- Australia Phosphorus Porter's Five Forces
- Australia Phosphorus Industry Life Cycle
- Historical Data and Forecast of Australia Phosphorus Market Revenues & Volume By Type for the Period 2022-2032F
- Historical Data and Forecast of Australia Phosphorus Market Revenues & Volume By White phosphorus for the Period 2022-2032F
- Historical Data and Forecast of Australia Phosphorus Market Revenues & Volume By Red phosphorus for the Period 2022-2032F
- Historical Data and Forecast of Australia Phosphorus Market Revenues & Volume By Phosphorous chloride for the Period 2022-2032F
- Historical Data and Forecast of Australia Phosphorus Market Revenues & Volume By Phosphoric acid for the Period 2022-2032F
- Historical Data and Forecast of Australia Phosphorus Market Revenues & Volume By Industrial phosphates for the Period 2022-2032F
- Historical Data and Forecast of Australia Phosphorus Market Revenues & Volume By Phosphorous penta-oxide for the Period 2022-2032F
- Historical Data and Forecast of Australia Phosphorus Market Revenues & Volume By Application for the Period 2022-2032F
- Historical Data and Forecast of Australia Phosphorus Market Revenues & Volume By Detergents for the Period 2022-2032F
- Historical Data and Forecast of Australia Phosphorus Market Revenues & Volume By Water treatment for the Period 2022-2032F
- Historical Data and Forecast of Australia Phosphorus Market Revenues & Volume By Flame retardants for the Period 2022-2032F
- Historical Data and Forecast of Australia Phosphorus Market Revenues & Volume By Batteries for the Period 2022-2032F
- Historical Data and Forecast of Australia Phosphorus Market Revenues & Volume By Chemical intermediates for the Period 2022-2032F
- Historical Data and Forecast of Australia Phosphorus Market Revenues & Volume By Fertilizers for the Period 2022-2032F
- Australia Phosphorus Import Export Trade Statistics
- Market Opportunity Assessment By Type
- Market Opportunity Assessment By Application
- Australia Phosphorus Top Companies Market Share
- Australia Phosphorus Competitive Benchmarking By Technical and Operational Parameters
- Australia Phosphorus Company Profiles
- Australia Phosphorus Key Strategic Recommendations
Australia Phosphorus Market (2026-2032): FAQs
6Wresearch actively monitors the Australia Phosphorus Market and publishes its comprehensive annual report, highlighting emerging trends, growth drivers, revenue analysis, and forecast outlook. Our insights help businesses to make data-backed strategic decisions with ongoing market dynamics. Our analysts track relevent industries related to the Australia Phosphorus Market, allowing our clients with actionable intelligence and reliable forecasts tailored to emerging regional needs.
Yes, we provide customisation as per your requirements. To learn more, feel free to contact us on sales@6wresearch.com
1 Executive Summary |
2 Introduction |
2.1 Key Highlights of the Report |
2.2 Report Description |
2.3 Market Scope & Segmentation |
2.4 Research Methodology |
2.5 Assumptions |
3 Australia Phosphorus Market Overview |
3.1 Australia Country Macro Economic Indicators |
3.2 Australia Phosphorus Market Revenues & Volume, 2022 & 2032F |
3.3 Australia Phosphorus Market - Industry Life Cycle |
3.4 Australia Phosphorus Market - Porter's Five Forces |
3.5 Australia Phosphorus Market Revenues & Volume Share, By Type, 2022 & 2032F |
3.6 Australia Phosphorus Market Revenues & Volume Share, By Application, 2022 & 2032F |
4 Australia Phosphorus Market Dynamics |
4.1 Impact Analysis |
4.2 Market Drivers |
4.2.1 Increasing demand for fertilizers in the agriculture sector |
4.2.2 Growth in the livestock industry leading to higher demand for phosphorus supplements |
4.2.3 Government initiatives promoting sustainable agriculture practices |
4.3 Market Restraints |
4.3.1 Volatility in raw material prices impacting production costs |
4.3.2 Environmental concerns related to phosphorus runoff and water pollution |
4.3.3 Competition from alternative nutrient sources like nitrogen and potassium |
5 Australia Phosphorus Market Trends |
6 Australia Phosphorus Market, By Types |
6.1 Australia Phosphorus Market, By Type |
6.1.1 Overview and Analysis |
6.1.2 Australia Phosphorus Market Revenues & Volume, By Type, 2022-2032F |
6.1.3 Australia Phosphorus Market Revenues & Volume, By White phosphorus, 2022-2032F |
6.1.4 Australia Phosphorus Market Revenues & Volume, By Red phosphorus, 2022-2032F |
6.1.5 Australia Phosphorus Market Revenues & Volume, By Phosphorous chloride, 2022-2032F |
6.1.6 Australia Phosphorus Market Revenues & Volume, By Phosphoric acid, 2022-2032F |
6.1.7 Australia Phosphorus Market Revenues & Volume, By Industrial phosphates, 2022-2032F |
6.1.8 Australia Phosphorus Market Revenues & Volume, By Phosphorous penta-oxide, 2022-2032F |
6.2 Australia Phosphorus Market, By Application |
6.2.1 Overview and Analysis |
6.2.2 Australia Phosphorus Market Revenues & Volume, By Detergents, 2022-2032F |
6.2.3 Australia Phosphorus Market Revenues & Volume, By Water treatment, 2022-2032F |
6.2.4 Australia Phosphorus Market Revenues & Volume, By Flame retardants, 2022-2032F |
6.2.5 Australia Phosphorus Market Revenues & Volume, By Batteries, 2022-2032F |
6.2.6 Australia Phosphorus Market Revenues & Volume, By Chemical intermediates, 2022-2032F |
6.2.7 Australia Phosphorus Market Revenues & Volume, By Fertilizers, 2022-2032F |
7 Australia Phosphorus Market Import-Export Trade Statistics |
7.1 Australia Phosphorus Market Export to Major Countries |
7.2 Australia Phosphorus Market Imports from Major Countries |
8 Australia Phosphorus Market Key Performance Indicators |
8.1 Average selling price of phosphorus-based fertilizers |
8.2 Adoption rate of phosphorus-efficient farming practices |
8.3 Research and development investment in phosphorus technologies |
8.4 Phosphorus consumption per hectare in agriculture |
8.5 Percentage of phosphorus recycling in the agriculture sector |
9 Australia Phosphorus Market - Opportunity Assessment |
9.1 Australia Phosphorus Market Opportunity Assessment, By Type, 2022 & 2032F |
9.2 Australia Phosphorus Market Opportunity Assessment, By Application, 2022 & 2032F |
10 Australia Phosphorus Market - Competitive Landscape |
10.1 Australia Phosphorus Market Revenue Share, By Companies, 2025 |
10.2 Australia Phosphorus Market Competitive Benchmarking, By Operating and Technical Parameters |
11 Company Profiles |
12 Recommendations |
13 Disclaimer |
Global Go To Market Strategy - 2030
Export potential enables firms to identify high-growth global markets with greater confidence by combining advanced trade intelligence with a structured quantitative methodology. The framework analyzes emerging demand trends and country-level import patterns while integrating macroeconomic and trade datasets such as GDP and population forecasts, bilateral import–export flows, tariff structures, elasticity differentials between developed and developing economies, geographic distance, and import demand projections. Using weighted trade values from 2020–2024 as the base period to project country-to-country export potential for 2030, these inputs are operationalized through calculated drivers such as gravity model parameters, tariff impact factors, and projected GDP per-capita growth. Through an analysis of hidden potentials, demand hotspots, and market conditions that are most favorable to success, this method enables firms to focus on target countries, maximize returns, and global expansion with data, backed by accuracy.
By factoring in the projected importer demand gap that is currently unmet and could be potential opportunity, it identifies the potential for the Exporter (Country) among 190 countries, against the general trade analysis, which identifies the biggest importer or exporter.
To discover high-growth global markets and optimize your business strategy:
Click Here
Pricing
- Single User License$ 1,995
- Department License$ 2,400
- Site License$ 3,120
- Global License$ 3,795

Leadership Perspectives from Industry Events
Search
Thought Leadership and Analyst Meet


Our Clients
6WResearch In News
- India Air Conditioner Market Set for Strong Rebound in 2026 After Weather-Led Correction and GST-Driven Recovery: 6Wresearch
- ADAS in India: How Automatic Emergency Braking, Blind Spot Detection & Driver Monitoring are Transforming Road Safety
- Doha a strategic location for EV manufacturing hub: IPA Qatar
- Demand for luxury TVs surging in the GCC, says Samsung
- Empowering Growth: The Thriving Journey of Bangladesh’s Cable Industry
- Demand for luxury TVs surging in the GCC, says Samsung
Latest Reports
- Nicaragua RPG Gaming Market (2026-2032)
- New Zealand RPG Gaming Market (2026-2032)
- Netherlands RPG Gaming Market (2026-2032)
- Nauru RPG Gaming Market (2026-2032)
- Namibia RPG Gaming Market (2026-2032)
- Mozambique RPG Gaming Market (2026-2032)
- Montenegro RPG Gaming Market (2026-2032)
- Mongolia RPG Gaming Market (2026-2032)
- Monaco RPG Gaming Market (2026-2032)
- Micronesia RPG Gaming Market (2026-2032)
Industry Events and Analyst Meet

HIMTEX 2026

India Refining Summit 2026

India EV Show 2026

EV tech India Expo 2026

Auto Tech Asia 2026
Whitepaper
- Middle East & Africa Commercial Security Market Click here to view more.
- Middle East & Africa Fire Safety Systems & Equipment Market Click here to view more.
- GCC Drone Market Click here to view more.
- Middle East Lighting Fixture Market Click here to view more.
- GCC Physical & Perimeter Security Market Click here to view more.