Australia Polycarbonate For Electrical And Electronics Market (2026-2032) | Growth, Forecast, Value, Segmentation, Outlook, Competitive Landscape, Analysis, Size & Revenue, Trends, Companies, Share, Industry
Market Forecast By End Use (IT Electronics, Electrical Enclosures) And Competitive Landscape
| Product Code: ETC6188666 | Publication Date: Sep 2024 | Updated Date: Mar 2026 | Product Type: Market Research Report | |
| Publisher: 6Wresearch | Author: Vasudha | No. of Pages: 75 | No. of Figures: 35 | No. of Tables: 20 |
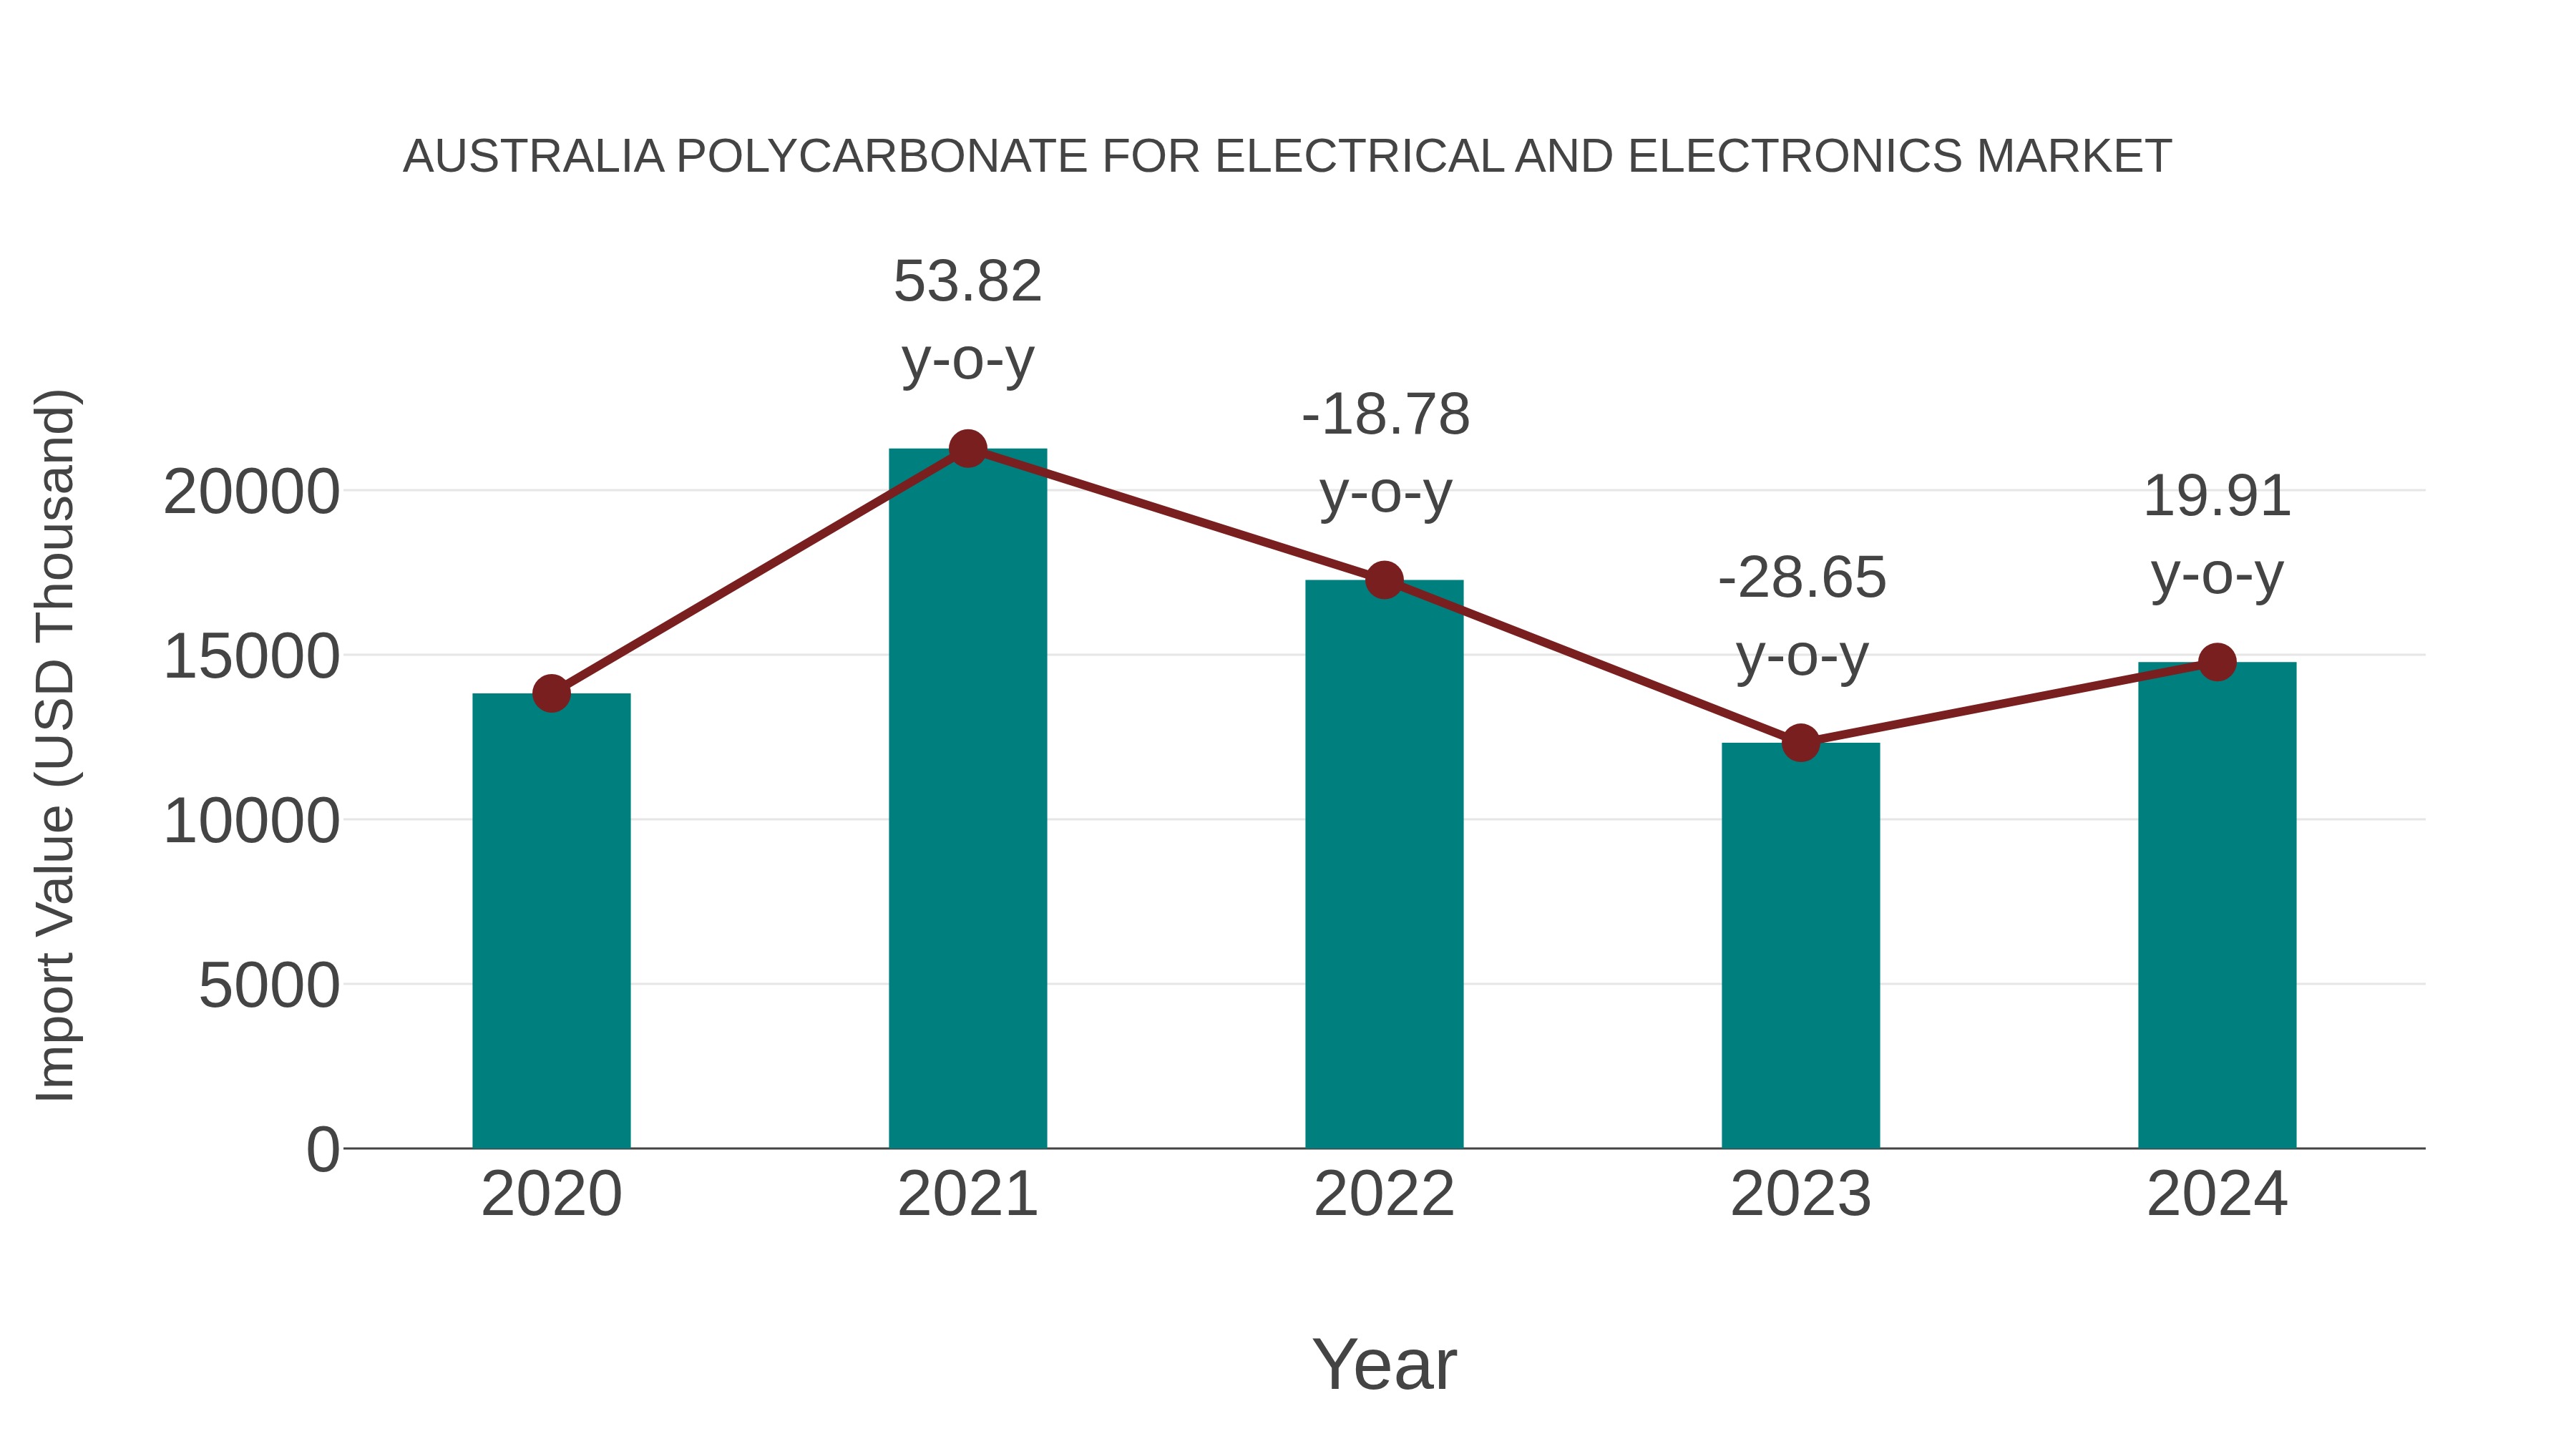
Australia Polycarbonate for Electrical and Electronics Market: Import Trend Analysis
Australia`s import trend for polycarbonate in the electrical and electronics market showed a growth rate of 19.91% from 2023 to 2024, with a compound annual growth rate (CAGR) of 1.68% from 2020 to 2024. This import momentum can be attributed to an increasing demand for high-quality materials in the sector, indicating market stability and sustained interest in polycarbonate for electrical and electronics applications.
Australia Polycarbonate For Electrical And Electronics Market Overview
In the electrical and electronics domain, polycarbonates durability, insulation properties, and flame resistance make it a preferred material. Australias growing renewable energy sector and smart appliance market drive demand for high-performance polymers like polycarbonate. Emphasis on electrical safety standards also influences market growth.
Trends of the market
Polycarbonate is witnessing increasing usage in Australias electrical and electronics industry due to its high insulation properties and durability. The growing miniaturization of electronic devices and the push for fire-retardant materials are encouraging the use of advanced polycarbonates, especially in connectors, switches, and housings.
Challenges of the market
The electrical and electronics sector in Australia demands high-performance materials, putting pressure on polycarbonate manufacturers to deliver enhanced thermal, flame-retardant, and durability features. Competition from cheaper engineering plastics and continuous miniaturization of electronic devices adds further challenges.
Investment opportunities in the Market
Australia`s consumer electronics and renewable energy sectors offer steady growth for polycarbonate applications. Investments focused on manufacturing high-quality, durable, and lightweight components can address demand for connectors, switch gears, and lighting. Local production capabilities would offer faster delivery and support the push for domestic manufacturing in electronics.
Government Policy of the market
The electrical and electronics sectors use of polycarbonate is governed by Australian Electrical Safety Standards and hazardous substances guidelines. Eco-design principles promoted under the Green Electronics Council initiatives encourage manufacturers to utilize recyclable and durable materials like polycarbonate.
Key Highlights of the Report:
- Australia Polycarbonate For Electrical And Electronics Market Outlook
- Market Size of Australia Polycarbonate For Electrical And Electronics Market, 2025
- Forecast of Australia Polycarbonate For Electrical And Electronics Market, 2032
- Historical Data and Forecast of Australia Polycarbonate For Electrical And Electronics Revenues & Volume for the Period 2022 - 2032F
- Australia Polycarbonate For Electrical And Electronics Market Trend Evolution
- Australia Polycarbonate For Electrical And Electronics Market Drivers and Challenges
- Australia Polycarbonate For Electrical And Electronics Price Trends
- Australia Polycarbonate For Electrical And Electronics Porter's Five Forces
- Australia Polycarbonate For Electrical And Electronics Industry Life Cycle
- Historical Data and Forecast of Australia Polycarbonate For Electrical And Electronics Market Revenues & Volume By End Use for the Period 2022 - 2032F
- Historical Data and Forecast of Australia Polycarbonate For Electrical And Electronics Market Revenues & Volume By IT Electronics for the Period 2022 - 2032F
- Historical Data and Forecast of Australia Polycarbonate For Electrical And Electronics Market Revenues & Volume By Electrical Enclosures for the Period 2022 - 2032F
- Australia Polycarbonate For Electrical And Electronics Import Export Trade Statistics
- Market Opportunity Assessment By End Use
- Australia Polycarbonate For Electrical And Electronics Top Companies Market Share
- Australia Polycarbonate For Electrical And Electronics Competitive Benchmarking By Technical and Operational Parameters
- Australia Polycarbonate For Electrical And Electronics Company Profiles
- Australia Polycarbonate For Electrical And Electronics Key Strategic Recommendations
Australia Polycarbonate For Electrical And Electronics Market (2026-2032): FAQs
6Wresearch actively monitors the Australia Polycarbonate For Electrical And Electronics Market and publishes its comprehensive annual report, highlighting emerging trends, growth drivers, revenue analysis, and forecast outlook. Our insights help businesses to make data-backed strategic decisions with ongoing market dynamics. Our analysts track relevent industries related to the Australia Polycarbonate For Electrical And Electronics Market, allowing our clients with actionable intelligence and reliable forecasts tailored to emerging regional needs.
Yes, we provide customisation as per your requirements. To learn more, feel free to contact us on sales@6wresearch.com
1 Executive Summary |
2 Introduction |
2.1 Key Highlights of the Report |
2.2 Report Description |
2.3 Market Scope & Segmentation |
2.4 Research Methodology |
2.5 Assumptions |
3 Australia Polycarbonate For Electrical And Electronics Market Overview |
3.1 Australia Country Macro Economic Indicators |
3.2 Australia Polycarbonate For Electrical And Electronics Market Revenues & Volume, 2022 & 2032F |
3.3 Australia Polycarbonate For Electrical And Electronics Market - Industry Life Cycle |
3.4 Australia Polycarbonate For Electrical And Electronics Market - Porter's Five Forces |
3.5 Australia Polycarbonate For Electrical And Electronics Market Revenues & Volume Share, By End Use, 2022 & 2032F |
4 Australia Polycarbonate For Electrical And Electronics Market Dynamics |
4.1 Impact Analysis |
4.2 Market Drivers |
4.2.1 Increasing demand for lightweight and durable materials in the electrical and electronics industry |
4.2.2 Growing adoption of polycarbonate materials due to their excellent thermal and electrical insulation properties |
4.2.3 Technological advancements leading to the development of innovative polycarbonate products for electrical and electronics applications |
4.3 Market Restraints |
4.3.1 Fluctuating prices of raw materials used in polycarbonate production impacting the overall cost of the material |
4.3.2 Stringent regulations and standards related to the use of polycarbonate in electrical and electronics applications |
4.3.3 Competition from alternative materials such as ABS, PVC, and nylon in the market |
5 Australia Polycarbonate For Electrical And Electronics Market Trends |
6 Australia Polycarbonate For Electrical And Electronics Market, By Types |
6.1 Australia Polycarbonate For Electrical And Electronics Market, By End Use |
6.1.1 Overview and Analysis |
6.1.2 Australia Polycarbonate For Electrical And Electronics Market Revenues & Volume, By End Use, 2022 - 2032F |
6.1.3 Australia Polycarbonate For Electrical And Electronics Market Revenues & Volume, By IT Electronics, 2022 - 2032F |
6.1.4 Australia Polycarbonate For Electrical And Electronics Market Revenues & Volume, By Electrical Enclosures, 2022 - 2032F |
7 Australia Polycarbonate For Electrical And Electronics Market Import-Export Trade Statistics |
7.1 Australia Polycarbonate For Electrical And Electronics Market Export to Major Countries |
7.2 Australia Polycarbonate For Electrical And Electronics Market Imports from Major Countries |
8 Australia Polycarbonate For Electrical And Electronics Market Key Performance Indicators |
8.1 Research and development investments in new polycarbonate formulations for electrical and electronics applications |
8.2 Adoption rate of polycarbonate materials by major electrical and electronics manufacturers in Australia |
8.3 Number of patents filed for new polycarbonate products specifically designed for electrical and electronics industry |
9 Australia Polycarbonate For Electrical And Electronics Market - Opportunity Assessment |
9.1 Australia Polycarbonate For Electrical And Electronics Market Opportunity Assessment, By End Use, 2022 & 2032F |
10 Australia Polycarbonate For Electrical And Electronics Market - Competitive Landscape |
10.1 Australia Polycarbonate For Electrical And Electronics Market Revenue Share, By Companies, 2025 |
10.2 Australia Polycarbonate For Electrical And Electronics Market Competitive Benchmarking, By Operating and Technical Parameters |
11 Company Profiles |
12 Recommendations |
13 Disclaimer |
Global Go To Market Strategy - 2030
Export potential enables firms to identify high-growth global markets with greater confidence by combining advanced trade intelligence with a structured quantitative methodology. The framework analyzes emerging demand trends and country-level import patterns while integrating macroeconomic and trade datasets such as GDP and population forecasts, bilateral import–export flows, tariff structures, elasticity differentials between developed and developing economies, geographic distance, and import demand projections. Using weighted trade values from 2020–2024 as the base period to project country-to-country export potential for 2030, these inputs are operationalized through calculated drivers such as gravity model parameters, tariff impact factors, and projected GDP per-capita growth. Through an analysis of hidden potentials, demand hotspots, and market conditions that are most favorable to success, this method enables firms to focus on target countries, maximize returns, and global expansion with data, backed by accuracy.
By factoring in the projected importer demand gap that is currently unmet and could be potential opportunity, it identifies the potential for the Exporter (Country) among 190 countries, against the general trade analysis, which identifies the biggest importer or exporter.
To discover high-growth global markets and optimize your business strategy:
Click Here
Pricing
- Single User License$ 1,995
- Department License$ 2,400
- Site License$ 3,120
- Global License$ 3,795

Leadership Perspectives from Industry Events
Search
Thought Leadership and Analyst Meet


Our Clients
6WResearch In News
- India Air Conditioner Market Set for Strong Rebound in 2026 After Weather-Led Correction and GST-Driven Recovery: 6Wresearch
- ADAS in India: How Automatic Emergency Braking, Blind Spot Detection & Driver Monitoring are Transforming Road Safety
- Doha a strategic location for EV manufacturing hub: IPA Qatar
- Demand for luxury TVs surging in the GCC, says Samsung
- Empowering Growth: The Thriving Journey of Bangladesh’s Cable Industry
- Demand for luxury TVs surging in the GCC, says Samsung
Latest Reports
- Poland Fire Protection Systems Market (2026-2032)
- Cape Verde Portable Hand-Thrown Extinguisher Market (2026-2032)
- Canada Portable Hand-Thrown Extinguisher Market (2026-2032)
- Cameroon Portable Hand-Thrown Extinguisher Market (2026-2032)
- Burundi Portable Hand-Thrown Extinguisher Market (2026-2032)
- Burkina Faso Portable Hand-Thrown Extinguisher Market (2026-2032)
- Bulgaria Portable Hand-Thrown Extinguisher Market (2026-2032)
- Brunei Portable Hand-Thrown Extinguisher Market (2026-2032)
- Botswana Portable Hand-Thrown Extinguisher Market (2026-2032)
- Bosnia and Herzegovina Portable Hand-Thrown Extinguisher Market (2026-2032)
Industry Events and Analyst Meet

HIMTEX 2026

India Refining Summit 2026

India EV Show 2026

EV tech India Expo 2026

Auto Tech Asia 2026
Whitepaper
- Middle East & Africa Commercial Security Market Click here to view more.
- Middle East & Africa Fire Safety Systems & Equipment Market Click here to view more.
- GCC Drone Market Click here to view more.
- Middle East Lighting Fixture Market Click here to view more.
- GCC Physical & Perimeter Security Market Click here to view more.