Australia Printing Plate Market (2026-2032) | Forecast, Analysis, Growth, Outlook, Share, Industry, Size, Revenue, Companies, Value & Trends
Market Forecast By Product Type (Flexographic Printing Plate, Lithographic Printing Plate, Letterpress Printing Plate, Digital Printing Plate), By End-users (Food & Beverages Industry, Electrical & Electronics Industry, Cosmetics & Personal Care Industry, Healthcare & Pharmaceutical Industry, Automotive Industry, Other Consumer Goods) And Competitive Landscape
| Product Code: ETC063054 | Publication Date: Aug 2021 | Updated Date: Mar 2026 | Product Type: Report | |
| Publisher: 6Wresearch | Author: Ravi Bhandari | No. of Pages: 70 | No. of Figures: 35 | No. of Tables: 5 |
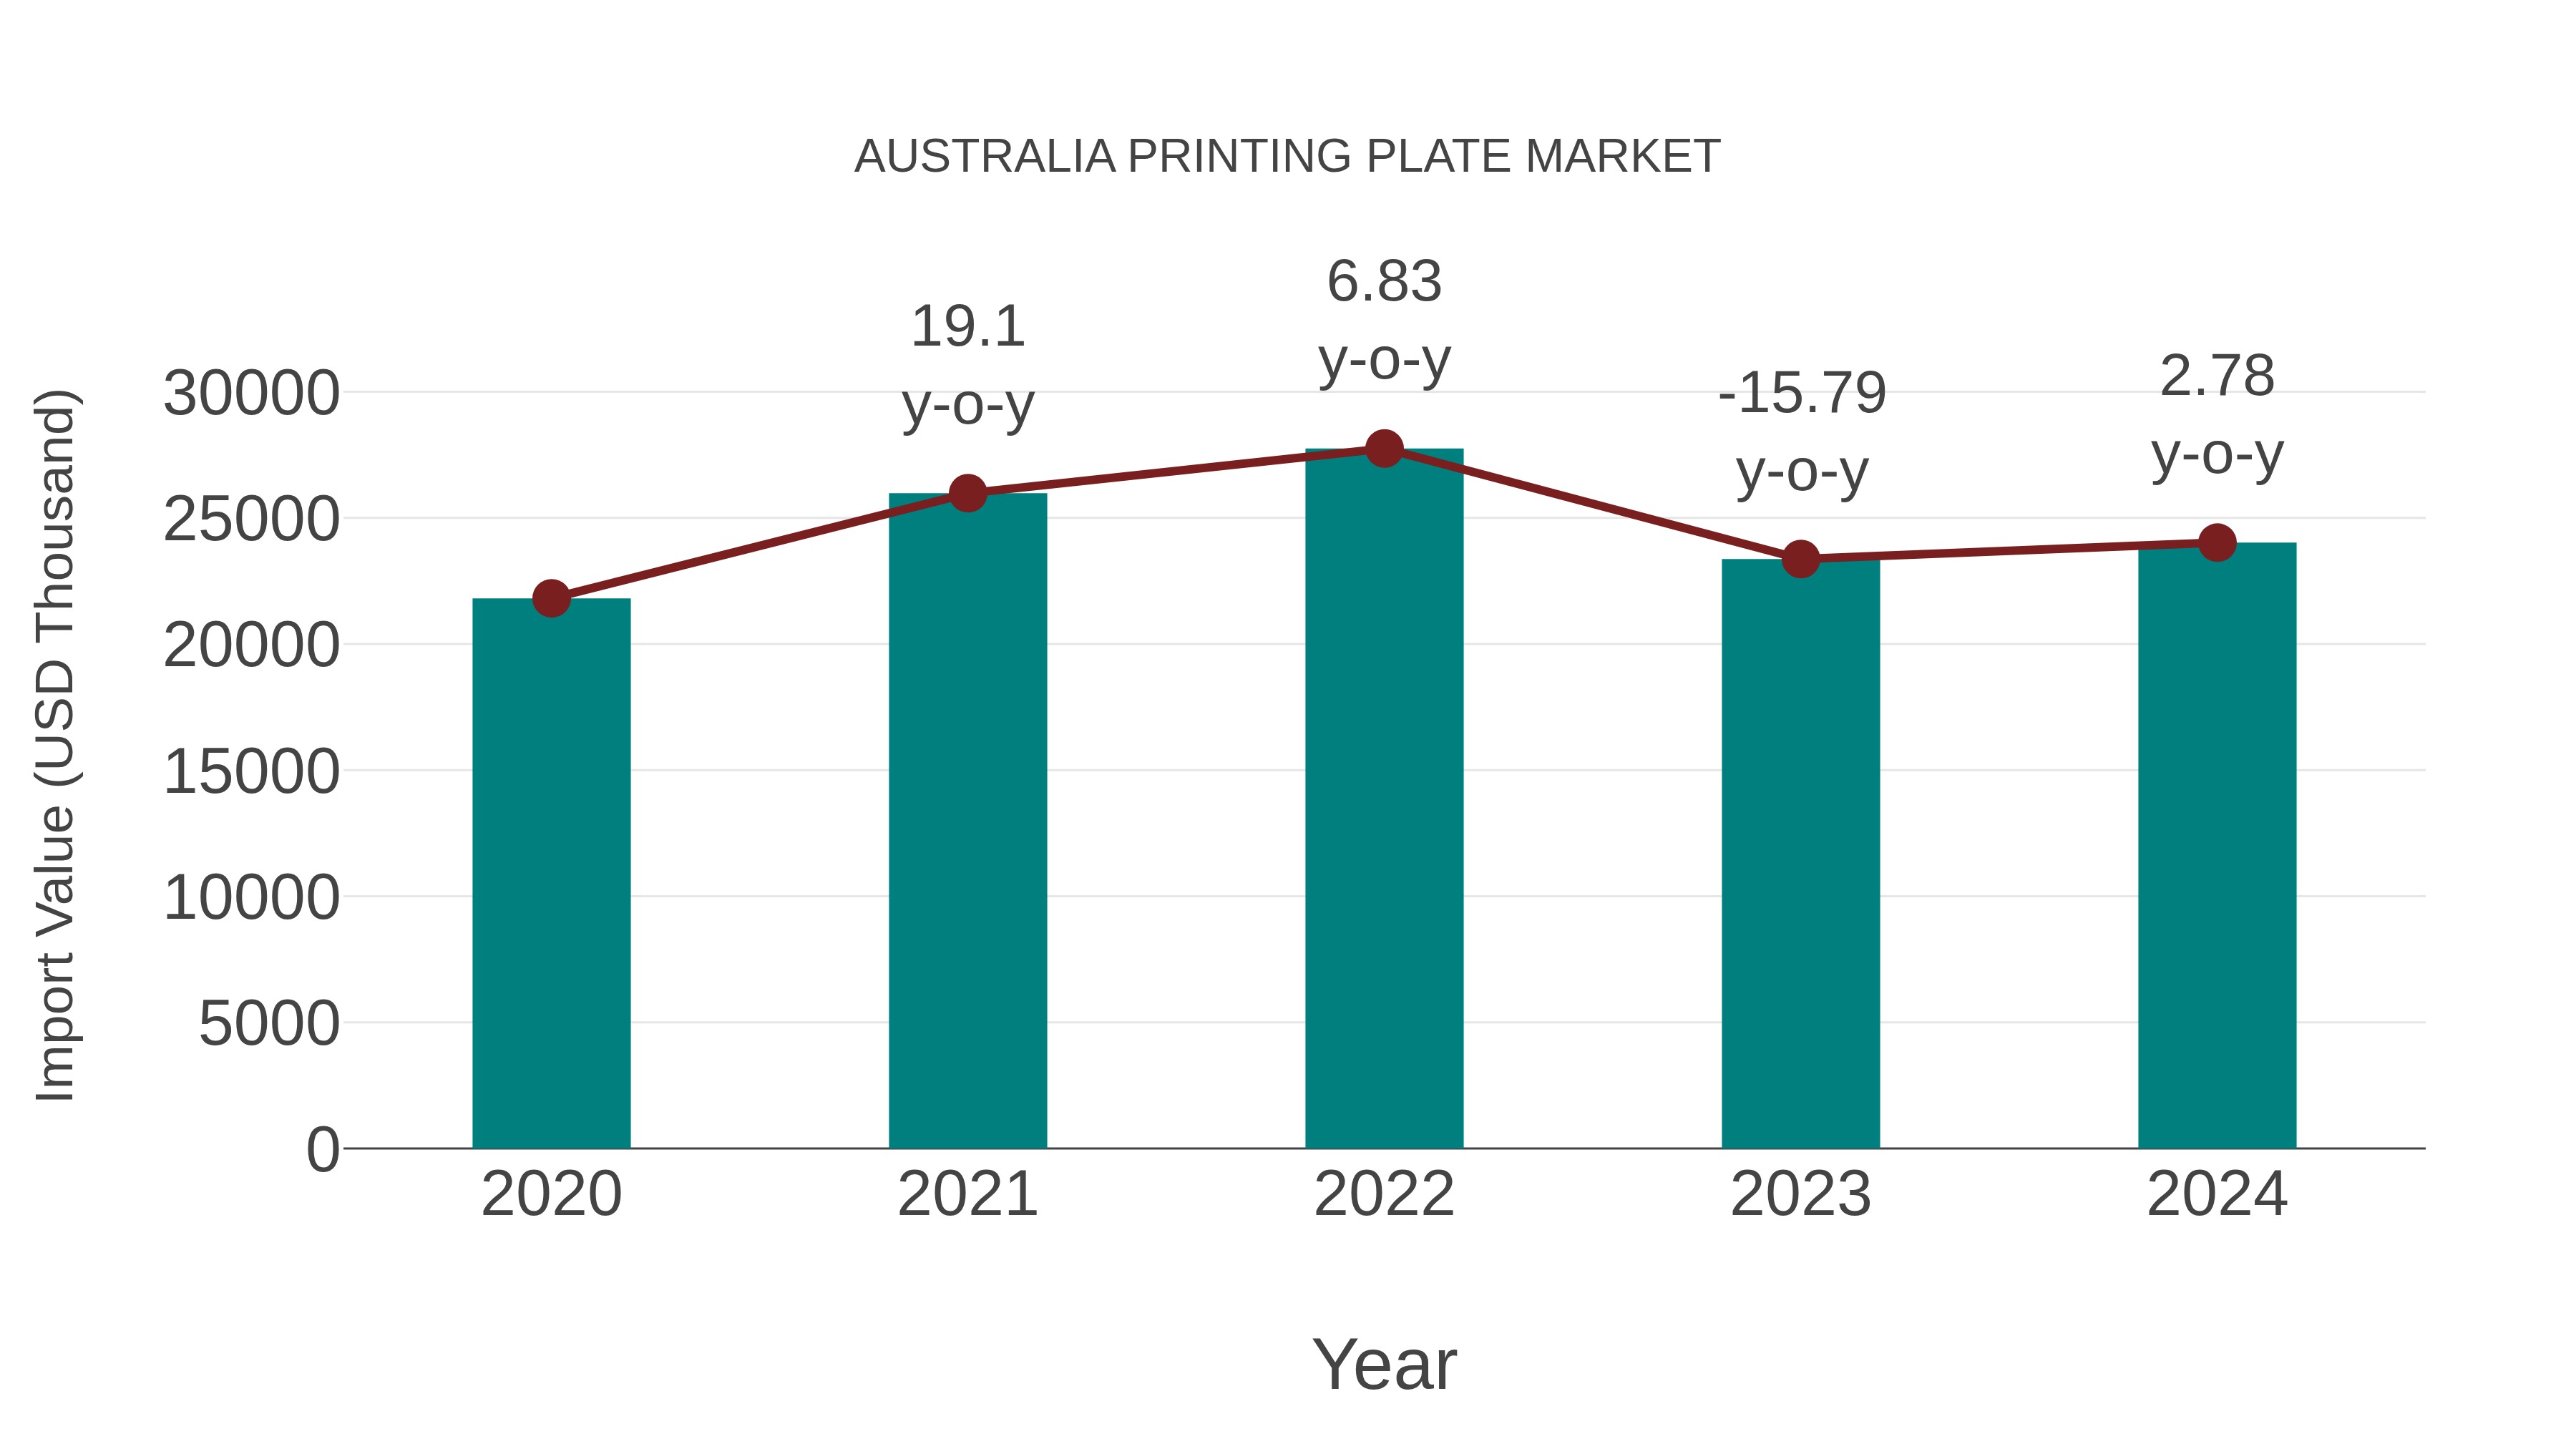
Australia Printing Plate Market: Import Trend Analysis
In the Australia printing plate market, the import trend showed a growth rate of 2.78% from 2023 to 2024, with a compound annual growth rate (CAGR) of 2.44% from 2020 to 2024. This growth could be attributed to a steady demand shift towards higher quality printing materials and market stability in the industry.
Australia Printing Plate Market Synopsis
The printing plate market in Australia serves the publishing, packaging, and commercial printing industries. With the shift toward digital and eco-friendly printing technologies, manufacturers are focusing on developing plates with reduced environmental impact.
Drivers of the market
The printing plate market in Australia is growing due to rising demand from the packaging industry and commercial printing businesses. With advancements in digital printing and eco-friendly plate technologies, the market is adapting to evolving consumer and industrial needs.
Challenges of the market
The shift toward digital and online media has reduced demand for traditional printing plates. High raw material costs and competition from imported products also pose pricing challenges for local manufacturers. Furthermore, sustainability concerns regarding chemical-based printing processes affect market growth.
Investment opportunities in the Market
The printing plate market in Australia is benefiting from advancements in digital printing and packaging industries. Despite a decline in traditional print media, the growth of flexible packaging, labels, and specialty printing is driving demand for high-quality printing plates. Investment opportunities lie in the development of eco-friendly and cost-efficient plate manufacturing technologies. Companies focusing on innovative and reusable plates can capture a growing share in the sustainable printing segment.
Government Policy of the market
The printing industry in Australia is affected by policies promoting digital transformation and environmental sustainability. Regulations on hazardous waste disposal affect the use of certain chemical-based printing plates. Government incentives for sustainable printing technologies encourage the adoption of eco-friendly alternatives, impacting market trends.
Key Highlights of the Report:
- Australia Printing Plate Market Outlook
- Market Size of Australia Printing Plate Market, 2025
- Forecast of Australia Printing Plate Market, 2032
- Historical Data and Forecast of Australia Printing Plate Revenues & Volume for the Period 2022-2032F
- Australia Printing Plate Market Trend Evolution
- Australia Printing Plate Market Drivers and Challenges
- Australia Printing Plate Price Trends
- Australia Printing Plate Porter's Five Forces
- Australia Printing Plate Industry Life Cycle
- Historical Data and Forecast of Australia Printing Plate Market Revenues & Volume By Product Type for the Period 2022-2032F
- Historical Data and Forecast of Australia Printing Plate Market Revenues & Volume By Flexographic Printing Plate for the Period 2022-2032F
- Historical Data and Forecast of Australia Printing Plate Market Revenues & Volume By Lithographic Printing Plate for the Period 2022-2032F
- Historical Data and Forecast of Australia Printing Plate Market Revenues & Volume By Letterpress Printing Plate for the Period 2022-2032F
- Historical Data and Forecast of Australia Printing Plate Market Revenues & Volume By Digital Printing Plate for the Period 2022-2032F
- Historical Data and Forecast of Australia Printing Plate Market Revenues & Volume By End-users for the Period 2022-2032F
- Historical Data and Forecast of Australia Printing Plate Market Revenues & Volume By Food & Beverages Industry for the Period 2022-2032F
- Historical Data and Forecast of Australia Printing Plate Market Revenues & Volume By Electrical & Electronics Industry for the Period 2022-2032F
- Historical Data and Forecast of Australia Printing Plate Market Revenues & Volume By Cosmetics & Personal Care Industry for the Period 2022-2032F
- Historical Data and Forecast of Australia Printing Plate Market Revenues & Volume By Healthcare & Pharmaceutical Industry for the Period 2022-2032F
- Historical Data and Forecast of Australia Printing Plate Market Revenues & Volume By Automotive Industry for the Period 2022-2032F
- Historical Data and Forecast of Australia Printing Plate Market Revenues & Volume By Other Consumer Goods for the Period 2022-2032F
- Australia Printing Plate Import Export Trade Statistics
- Market Opportunity Assessment By Product Type
- Market Opportunity Assessment By End-users
- Australia Printing Plate Top Companies Market Share
- Australia Printing Plate Competitive Benchmarking By Technical and Operational Parameters
- Australia Printing Plate Company Profiles
- Australia Printing Plate Key Strategic Recommendations
Australia Printing Plate Market (2026-2032): FAQs
6Wresearch actively monitors the Australia Printing Plate Market and publishes its comprehensive annual report, highlighting emerging trends, growth drivers, revenue analysis, and forecast outlook. Our insights help businesses to make data-backed strategic decisions with ongoing market dynamics. Our analysts track relevent industries related to the Australia Printing Plate Market, allowing our clients with actionable intelligence and reliable forecasts tailored to emerging regional needs.
Yes, we provide customisation as per your requirements. To learn more, feel free to contact us on sales@6wresearch.com
1 Executive Summary |
2 Introduction |
2.1 Key Highlights of the Report |
2.2 Report Description |
2.3 Market Scope & Segmentation |
2.4 Research Methodology |
2.5 Assumptions |
3 Australia Printing Plate Market Overview |
3.1 Australia Country Macro Economic Indicators |
3.2 Australia Printing Plate Market Revenues & Volume, 2022 & 2032F |
3.3 Australia Printing Plate Market - Industry Life Cycle |
3.4 Australia Printing Plate Market - Porter's Five Forces |
3.5 Australia Printing Plate Market Revenues & Volume Share, By Product Type, 2022 & 2032F |
3.6 Australia Printing Plate Market Revenues & Volume Share, By End-users, 2022 & 2032F |
4 Australia Printing Plate Market Dynamics |
4.1 Impact Analysis |
4.2 Market Drivers |
4.2.1 Technological advancements in printing plate materials and manufacturing processes |
4.2.2 Growth in the printing industry and increasing demand for high-quality printing plates |
4.2.3 Increasing adoption of digital printing technology in Australia |
4.3 Market Restraints |
4.3.1 Fluctuating raw material prices impacting production costs |
4.3.2 Competition from alternative printing technologies like digital printing |
4.3.3 Economic factors affecting the overall printing industry in Australia |
5 Australia Printing Plate Market Trends |
6 Australia Printing Plate Market, By Types |
6.1 Australia Printing Plate Market, By Product Type |
6.1.1 Overview and Analysis |
6.1.2 Australia Printing Plate Market Revenues & Volume, By Product Type, 2022-2032F |
6.1.3 Australia Printing Plate Market Revenues & Volume, By Flexographic Printing Plate, 2022-2032F |
6.1.4 Australia Printing Plate Market Revenues & Volume, By Lithographic Printing Plate, 2022-2032F |
6.1.5 Australia Printing Plate Market Revenues & Volume, By Letterpress Printing Plate, 2022-2032F |
6.1.6 Australia Printing Plate Market Revenues & Volume, By Digital Printing Plate, 2022-2032F |
6.2 Australia Printing Plate Market, By End-users |
6.2.1 Overview and Analysis |
6.2.2 Australia Printing Plate Market Revenues & Volume, By Food & Beverages Industry, 2022-2032F |
6.2.3 Australia Printing Plate Market Revenues & Volume, By Electrical & Electronics Industry, 2022-2032F |
6.2.4 Australia Printing Plate Market Revenues & Volume, By Cosmetics & Personal Care Industry, 2022-2032F |
6.2.5 Australia Printing Plate Market Revenues & Volume, By Healthcare & Pharmaceutical Industry, 2022-2032F |
6.2.6 Australia Printing Plate Market Revenues & Volume, By Automotive Industry, 2022-2032F |
6.2.7 Australia Printing Plate Market Revenues & Volume, By Other Consumer Goods, 2022-2032F |
7 Australia Printing Plate Market Import-Export Trade Statistics |
7.1 Australia Printing Plate Market Export to Major Countries |
7.2 Australia Printing Plate Market Imports from Major Countries |
8 Australia Printing Plate Market Key Performance Indicators |
8.1 Average order value per customer |
8.2 Rate of adoption of eco-friendly printing plate materials |
8.3 Customer satisfaction and retention rates |
8.4 Efficiency of production processes in terms of waste reduction and resource optimization |
8.5 Innovation rate in developing new printing plate technologies and products |
9 Australia Printing Plate Market - Opportunity Assessment |
9.1 Australia Printing Plate Market Opportunity Assessment, By Product Type, 2022 & 2032F |
9.2 Australia Printing Plate Market Opportunity Assessment, By End-users, 2022 & 2032F |
10 Australia Printing Plate Market - Competitive Landscape |
10.1 Australia Printing Plate Market Revenue Share, By Companies, 2025 |
10.2 Australia Printing Plate Market Competitive Benchmarking, By Operating and Technical Parameters |
11 Company Profiles |
12 Recommendations |
13 Disclaimer |
Global Go To Market Strategy - 2030
Export potential enables firms to identify high-growth global markets with greater confidence by combining advanced trade intelligence with a structured quantitative methodology. The framework analyzes emerging demand trends and country-level import patterns while integrating macroeconomic and trade datasets such as GDP and population forecasts, bilateral import–export flows, tariff structures, elasticity differentials between developed and developing economies, geographic distance, and import demand projections. Using weighted trade values from 2020–2024 as the base period to project country-to-country export potential for 2030, these inputs are operationalized through calculated drivers such as gravity model parameters, tariff impact factors, and projected GDP per-capita growth. Through an analysis of hidden potentials, demand hotspots, and market conditions that are most favorable to success, this method enables firms to focus on target countries, maximize returns, and global expansion with data, backed by accuracy.
By factoring in the projected importer demand gap that is currently unmet and could be potential opportunity, it identifies the potential for the Exporter (Country) among 190 countries, against the general trade analysis, which identifies the biggest importer or exporter.
To discover high-growth global markets and optimize your business strategy:
Click Here
Pricing
- Single User License$ 1,995
- Department License$ 2,400
- Site License$ 3,120
- Global License$ 3,795

Leadership Perspectives from Industry Events
Search
Thought Leadership and Analyst Meet


Our Clients
6WResearch In News
- India Air Conditioner Market Set for Strong Rebound in 2026 After Weather-Led Correction and GST-Driven Recovery: 6Wresearch
- ADAS in India: How Automatic Emergency Braking, Blind Spot Detection & Driver Monitoring are Transforming Road Safety
- Doha a strategic location for EV manufacturing hub: IPA Qatar
- Demand for luxury TVs surging in the GCC, says Samsung
- Empowering Growth: The Thriving Journey of Bangladesh’s Cable Industry
- Demand for luxury TVs surging in the GCC, says Samsung
Latest Reports
- Poland Fire Protection Systems Market (2026-2032)
- Cape Verde Portable Hand-Thrown Extinguisher Market (2026-2032)
- Canada Portable Hand-Thrown Extinguisher Market (2026-2032)
- Cameroon Portable Hand-Thrown Extinguisher Market (2026-2032)
- Burundi Portable Hand-Thrown Extinguisher Market (2026-2032)
- Burkina Faso Portable Hand-Thrown Extinguisher Market (2026-2032)
- Bulgaria Portable Hand-Thrown Extinguisher Market (2026-2032)
- Brunei Portable Hand-Thrown Extinguisher Market (2026-2032)
- Botswana Portable Hand-Thrown Extinguisher Market (2026-2032)
- Bosnia and Herzegovina Portable Hand-Thrown Extinguisher Market (2026-2032)
Industry Events and Analyst Meet

HIMTEX 2026

India Refining Summit 2026

India EV Show 2026

EV tech India Expo 2026

Auto Tech Asia 2026
Whitepaper
- Middle East & Africa Commercial Security Market Click here to view more.
- Middle East & Africa Fire Safety Systems & Equipment Market Click here to view more.
- GCC Drone Market Click here to view more.
- Middle East Lighting Fixture Market Click here to view more.
- GCC Physical & Perimeter Security Market Click here to view more.