Australia Rare Earth & Products Market (2026-2032) | Trends, Growth, Companies, Forecast, Industry, Revenue, Share, Analysis, Outlook, Value & Size
Market Forecast By Product Types (Cerium, Dysprosium, Erbium, Europium, Gadolinium, Holmium, Lanthanum, Others), By Applications (Magnets, Catalysts, Metallurgy, Polishing, Glass, Phosphors, Ceramics, Others) And Competitive Landscape
| Product Code: ETC008755 | Publication Date: Oct 2020 | Updated Date: Jun 2026 | Product Type: Report | |
| Publisher: 6Wresearch | Author: Ravi Bhandari | No. of Pages: 70 | No. of Figures: 35 | No. of Tables: 5 |
Australia Rare Earth & Products Market Summary
The australia rare earth & products market was estimated at USD 214 Million in 2025 and is projected to reach USD 251 Million by 2032, growing at a CAGR of 2.8% from 2026 to 2032.
Australia Rare Earth & Products Market Year-wise Growth Rate and Key Drivers
This graph highlights how the Australia Rare Earth & Products Market has steadily grown over the past five years, supported by major growth factors.
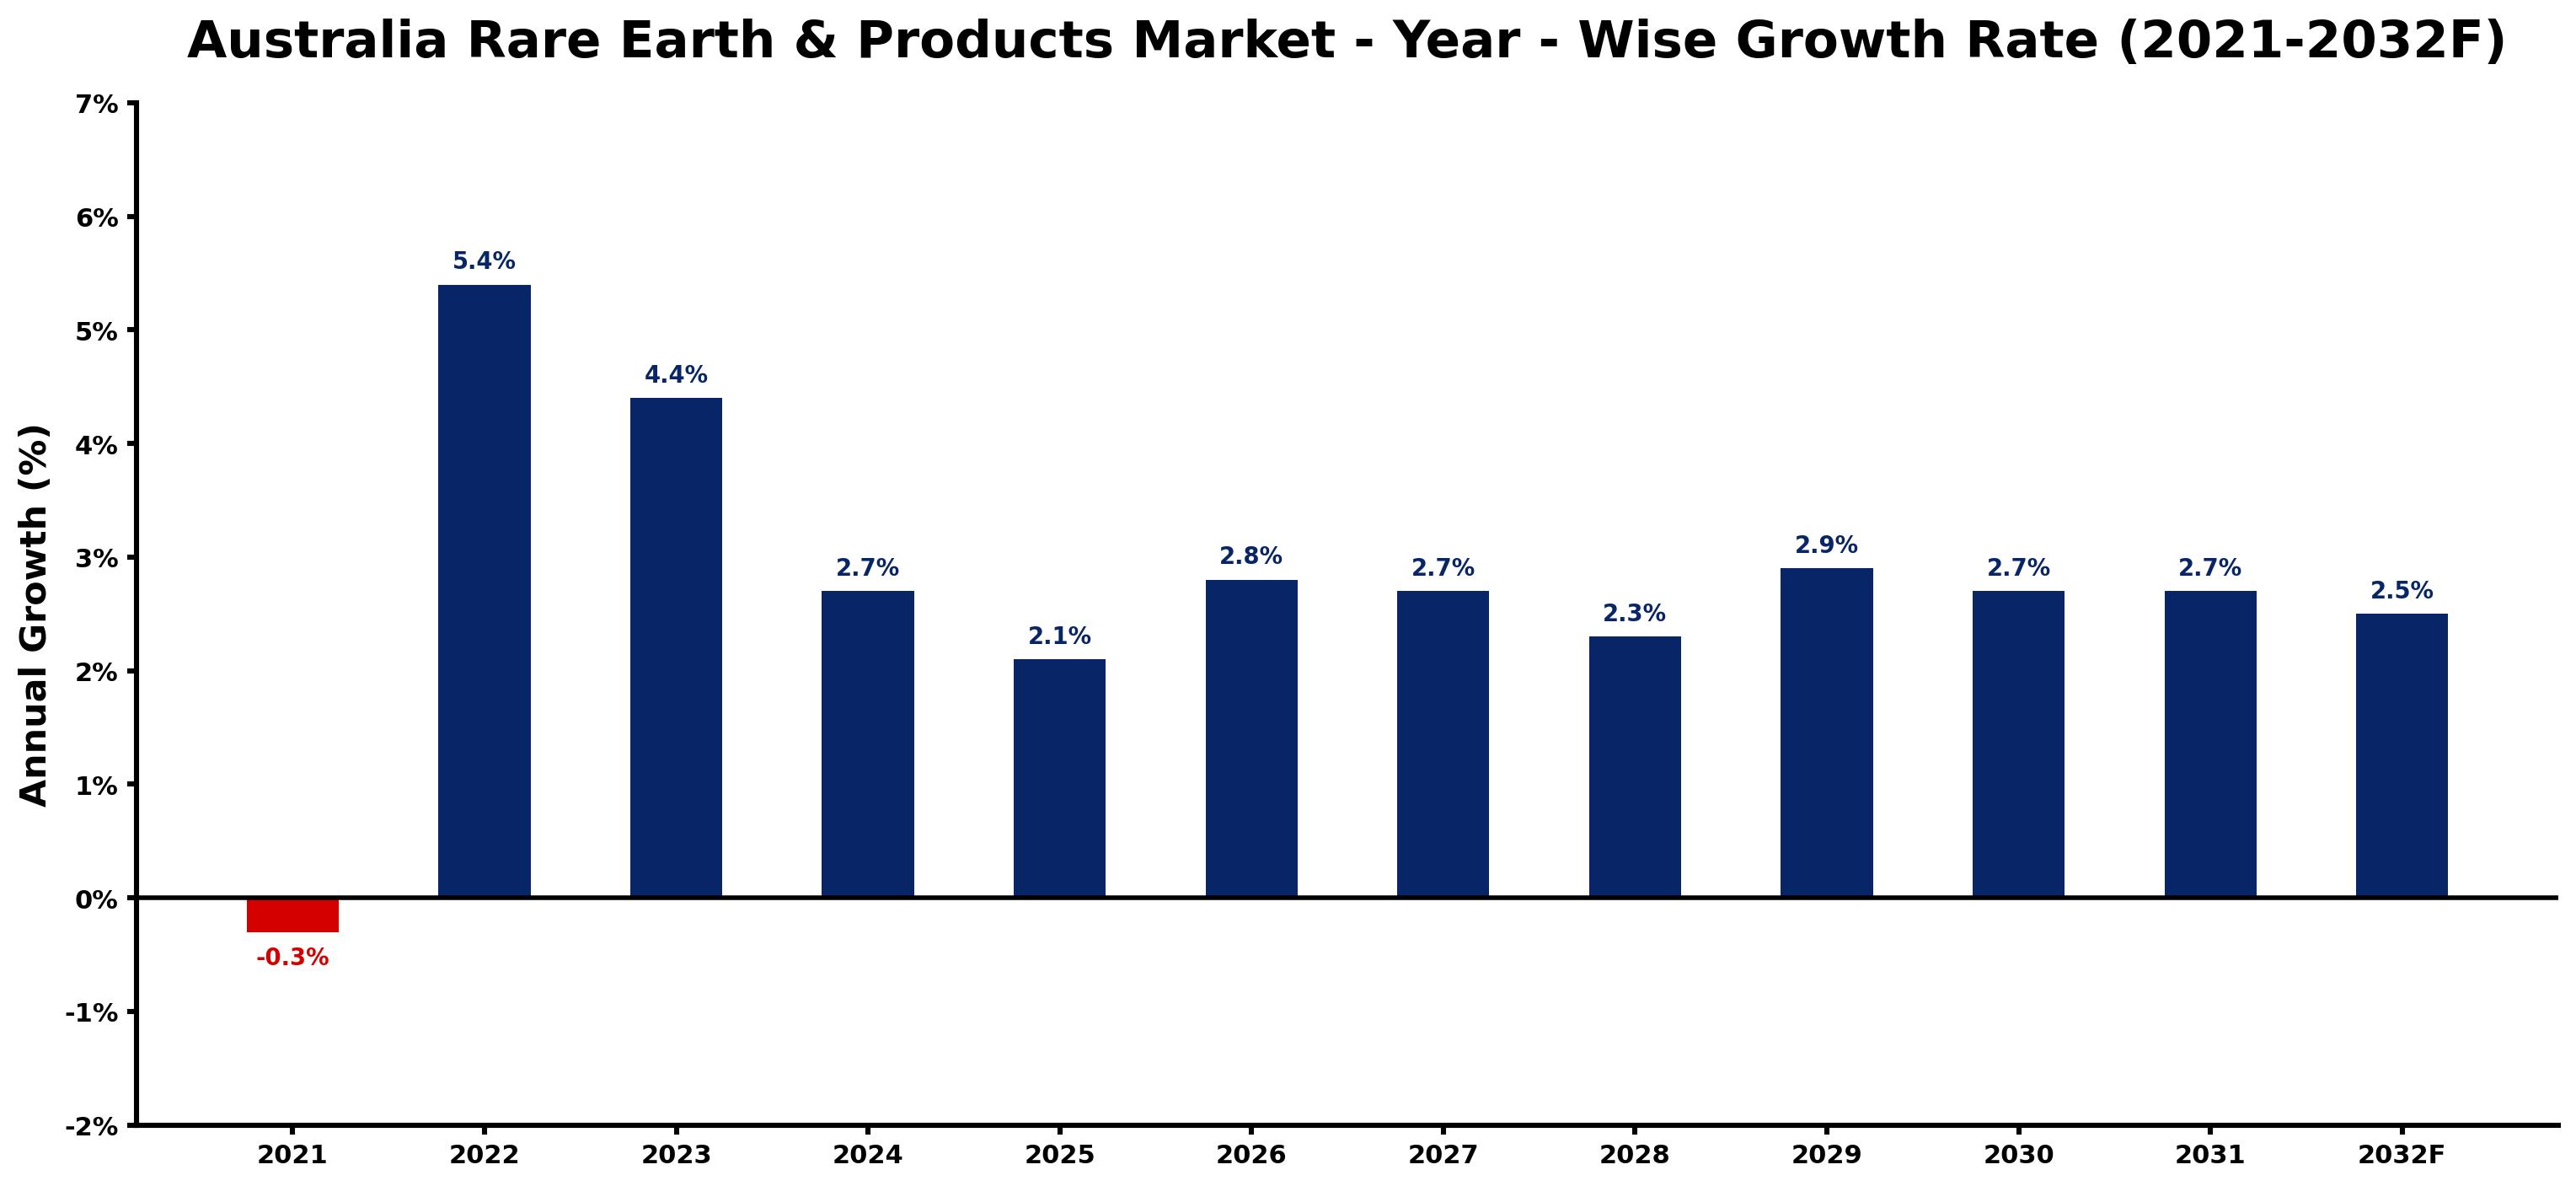
The table below presents the year wise growth rates along with the key drivers influencing the market
| Year | Growth Rate | Major Drivers |
| 2021 | -0.3% | Global supply chain disruptions hindered the availability of critical inputs, stalling production in the rare earth sector. |
| 2022 | 5.4% | Emerging technologies highlight Australia's potential to dominate the global rare earth sector. |
| 2023 | 4.4% | Supply chain diversification becomes essential, shifting focus towards local sourcing initiatives. |
| 2024 | 2.7% | Key partnerships between companies strengthen the ecosystem for rare earth extraction. |
| 2025 | 2.1% | Sustainability practices reshape industry standards, driving pressure for eco-friendly processes. |
| 2026 | 2.8% | Global competition prompts Australian firms to innovate in processing techniques effectively. |
| 2027 | 2.7% | Market volatility encourages strategic planning, with companies emphasizing risk management frameworks. |
| 2028 | 2.3% | Rising interest in electric vehicles elevates the significance of rare earth materials substantially. |
| 2029 | 2.9% | Technological breakthroughs in recycling rare earth elements create new revenue streams. |
| 2030 | 2.7% | Focus on renewable energy projects enhances the demand for localized rare earth supplies. |
| 2031 | 2.7% | Collaborations between government and private sectors foster a robust market environment. |
| 2032 | 2.5% | Research institutions actively engage with industries, fueling innovation and commercialization efforts. |
Note - Market size estimations and growth projections presented in this report are based on 6Wresearch's advanced forecasting approach, validated with industry datasets as of June 2026.
Australia Rare Earth & Products Market Synopsis
The Australia Rare Earth Products Market is projected to reach 2.8% and witness significant growth during the forecast period (2026-2032). This growth is driven by Australia's abundant reserves of rare earth minerals coupled with escalating demand from various sectors, including technology, defense, and renewable energy. Noteworthy government initiatives aimed at enhancing domestic processing capabilities and reducing reliance on Chinese imports are crucial to shaping the market dynamics. As electric vehicles and wind energy technologies expand, the demand for rare earth-based components is expected to intensify further. However, challenges regarding processing methods, environmental impacts, and increasing global competition remain prevalent within the sector.
Australia Rare Earth & Products Market Growth Drivers
The Australia Rare Earth & Products Market is experiencing growth due to several significant factors:
- There is a growing demand for critical minerals in electronics, renewable energy, and defense sectors, which drives the market for rare earth products.
- Government initiatives focused on boosting domestic mining and processing infrastructure are enhancing the market landscape.
- Global diversification efforts in supply chains are pushing Australian rare earth products into more competitive positions internationally.
- The remarkable expansion in electric vehicle production necessitates an increase in rare earth components, thus providing a robust market opportunity.
- Technological advancements in renewable energy, such as wind turbines, are further amplifying the demand for rare earth materials, which are integral to these technologies.
Australia Rare Earth & Products Market Challenges and Restraints
Despite its growth potential, the Australia Rare Earth & Products Market faces significant challenges:
- The costly extraction and processing of rare earth minerals can limit the profitability of operations within the sector.
- Dependence on global markets, particularly exports to China, exposes Australian suppliers to geopolitical risks and trade policy fluctuations.
- Environmental concerns surrounding mining operations are leading to stricter regulations, which increase compliance burdens on businesses.
- Processing challenges, including technological limitations and high energy consumption, hinder the efficiency of producing rare earth products.
- Competition from other countries with lower production costs can put pressure on the pricing and market share of Australian rare earth products.
Australia Rare Earth & Products Market Investment Opportunities
The Australia Rare Earth & Products Market offers intriguing investment opportunities:
- As the demand for rare earth elements rises in high-tech industries, significant investment in mining and processing technologies presents a lucrative opportunity.
- Government policies promoting local processing initiatives open avenues for new businesses to enter and expand within the market.
- International collaborations for research and development in rare earth applications foster innovation, creating further investment potential.
- Investment in sustainable mining practices could position companies favorably as environmental regulations tighten.
- Opportunities exist for investments in infrastructure improvements, enhancing supply chain efficiency within the rare earth product landscape.
Australia Rare Earth & Products Market Government Investment and Initiatives
The Australian government plays a pivotal role in shaping the rare earth products market through various investment and policy initiatives:
- Through its Critical Minerals Strategy, the government emphasizes the importance of domestic mining, refining, and processing to reduce reliance on foreign suppliers.
- A range of incentives and funding programs are designed to bolster rare earth production, supporting sectors such as electronics and renewable energy.
- Government efforts to streamline regulations associated with mining operations facilitate an easier path for industry participants to navigate compliance requirements.
- Investment in research and development under government auspices aims to enhance the efficiency of rare earth extraction and processing technologies.
- Public spending on infrastructure development for mining operations further supports the overall growth of the rare earth products market.
Australia Rare Earth & Products Market Latest Developments (May 2025 - June 2026)
Recent developments from May 2025 to June 2026 indicate a positive trajectory for the Australia Rare Earth & Products Market:
- The government has launched new initiatives to encourage the establishment of processing facilities aimed at increasing domestic capabilities.
- Environmental regulations have been increasingly enforced, prompting companies to adopt more sustainable mining practices.
- Research partnerships between public and private entities have been formed to innovate processing technologies and enhance productivity.
- Organizations have ramped up efforts to diversify supply chains, mitigating risks associated with dependence on international trade.
- Investment in electric vehicle infrastructure and renewable energy projects has surged, further driving the demand for rare earth components.
Australia Rare Earth & Products Market - Key Attractiveness of the Report
- 10 Years of Market Numbers
- Historical Data Starting from 2022 to 2025
- Base Year: 2025
- Forecast Data until 2032
- Key Performance Indicators Impacting the Market
- Major Upcoming Developments and Projects
Key Highlights of the Report:
- Australia Rare Earth & Products Market Outlook
- Market Size of Australia Rare Earth & Products Market, 2025
- Forecast of Australia Rare Earth & Products Market, 2032
- Historical Data and Forecast of Australia Rare Earth & Products Revenues & Volume for the Period 2022-2032F
- Australia Rare Earth & Products Market Trend Evolution
- Australia Rare Earth & Products Market Drivers and Challenges
- Australia Rare Earth & Products Price Trends
- Australia Rare Earth & Products Porter's Five Forces
- Australia Rare Earth & Products Industry Life Cycle
- Historical Data and Forecast of Australia Rare Earth & Products Market Revenues & Volume By Product Types for the Period 2022-2032F
- Historical Data and Forecast of Australia Rare Earth & Products Market Revenues & Volume By Cerium for the Period 2022-2032F
- Historical Data and Forecast of Australia Rare Earth & Products Market Revenues & Volume By Dysprosium for the Period 2022-2032F
- Historical Data and Forecast of Australia Rare Earth & Products Market Revenues & Volume By Erbium for the Period 2022-2032F
- Historical Data and Forecast of Australia Rare Earth & Products Market Revenues & Volume By Europium for the Period 2022-2032F
- Historical Data and Forecast of Australia Rare Earth & Products Market Revenues & Volume By Gadolinium for the Period 2022-2032F
- Historical Data and Forecast of Australia Rare Earth & Products Market Revenues & Volume By Holmium for the Period 2022-2032F
- Historical Data and Forecast of Australia Rare Earth & Products Market Revenues & Volume By Lanthanum for the Period 2022-2032F
- Historical Data and Forecast of Australia Cerium Rare Earth & Products Market Revenues & Volume By Others for the Period 2022-2032F
- Historical Data and Forecast of Australia Rare Earth & Products Market Revenues & Volume By Applications for the Period 2022-2032F
- Historical Data and Forecast of Australia Rare Earth & Products Market Revenues & Volume By Magnets for the Period 2022-2032F
- Historical Data and Forecast of Australia Rare Earth & Products Market Revenues & Volume By Catalysts for the Period 2022-2032F
- Historical Data and Forecast of Australia Rare Earth & Products Market Revenues & Volume By Metallurgy for the Period 2022-2032F
- Historical Data and Forecast of Australia Rare Earth & Products Market Revenues & Volume By Polishing for the Period 2022-2032F
- Historical Data and Forecast of Australia Rare Earth & Products Market Revenues & Volume By Glass for the Period 2022-2032F
- Historical Data and Forecast of Australia Rare Earth & Products Market Revenues & Volume By Phosphors for the Period 2022-2032F
- Historical Data and Forecast of Australia Rare Earth & Products Market Revenues & Volume By Ceramics for the Period 2022-2032F
- Historical Data and Forecast of Australia Rare Earth & Products Market Revenues & Volume By Others for the Period 2022-2032F
- Australia Rare Earth & Products Import Export Trade Statistics
- Market Opportunity Assessment By Product Types
- Market Opportunity Assessment By Applications
- Australia Rare Earth & Products Top Companies Market Share
- Australia Rare Earth & Products Competitive Benchmarking By Technical and Operational Parameters
- Australia Rare Earth & Products Company Profiles
- Australia Rare Earth & Products Key Strategic Recommendations
Frequently Asked Questions About the Market Study (FAQs):
The growth is driven primarily by increased demand from technology, defense, and renewable energy sectors, alongside government initiatives aimed at enhancing domestic processing capabilities.
Challenges include high extraction and processing costs, reliance on exports, environmental concerns related to mining, and competition from lower-cost producers globally.
The government supports the market through its Critical Minerals Strategy, which promotes domestic mining and processing, incentivizes local production, and streamlines regulations to facilitate industry growth.
Investment opportunities are abundant in mining, processing technologies, infrastructure development, and sustainable practices as demand for rare earth elements continues to rise in high-tech industries.
6Wresearch actively monitors the Australia Rare Earth & Products Market and publishes its comprehensive annual report, highlighting emerging trends, growth drivers, revenue analysis, and forecast outlook. Our insights help businesses to make data-backed strategic decisions with ongoing market dynamics. Our analysts track relevent industries related to the Australia Rare Earth & Products Market, allowing our clients with actionable intelligence and reliable forecasts tailored to emerging regional needs.
Yes, we provide customisation as per your requirements. To learn more, feel free to contact us on sales@6wresearch.com
1 Executive Summary |
2 Introduction |
2.1 Key Highlights of the Report |
2.2 Report Description |
2.3 Market Scope & Segmentation |
2.4 Research Methodology |
2.5 Assumptions |
3 Australia Rare Earth & Products Market Overview |
3.1 Australia Country Macro Economic Indicators |
3.2 Australia Rare Earth & Products Market Revenues & Volume, 2022 & 2032F |
3.3 Australia Rare Earth & Products Market - Industry Life Cycle |
3.4 Australia Rare Earth & Products Market - Porter's Five Forces |
3.5 Australia Rare Earth & Products Market Revenues & Volume Share, By Product Types, 2022 & 2032F |
3.6 Australia Rare Earth & Products Market Revenues & Volume Share, By Applications, 2022 & 2032F |
4 Australia Rare Earth & Products Market Dynamics |
4.1 Impact Analysis |
4.2 Market Drivers |
4.2.1 Increasing demand for rare earth elements in high-tech industries such as electronics, renewable energy, and electric vehicles. |
4.2.2 Growing focus on sustainable practices and the shift towards clean energy sources. |
4.2.3 Favorable government policies and investments in rare earth mining and processing in Australia. |
4.3 Market Restraints |
4.3.1 Volatility in rare earth prices due to supply chain disruptions and geopolitical tensions. |
4.3.2 Environmental concerns related to rare earth mining and processing activities. |
4.3.3 Competition from other rare earth-producing countries impacting Australia's market share. |
5 Australia Rare Earth & Products Market Trends |
6 Australia Rare Earth & Products Market, By Types |
6.1 Australia Rare Earth & Products Market, By Product Types |
6.1.1 Overview and Analysis |
6.1.2 Australia Rare Earth & Products Market Revenues & Volume, By Product Types, 2022-2032F |
6.1.3 Australia Rare Earth & Products Market Revenues & Volume, By Cerium, 2022-2032F |
6.1.4 Australia Rare Earth & Products Market Revenues & Volume, By Dysprosium, 2022-2032F |
6.1.5 Australia Rare Earth & Products Market Revenues & Volume, By Erbium, 2022-2032F |
6.1.6 Australia Rare Earth & Products Market Revenues & Volume, By Europium, 2022-2032F |
6.1.7 Australia Rare Earth & Products Market Revenues & Volume, By Gadolinium, 2022-2032F |
6.1.8 Australia Rare Earth & Products Market Revenues & Volume, By Holmium, 2022-2032F |
6.1.9 Australia Rare Earth & Products Market Revenues & Volume, By Others, 2022-2032F |
6.1.10 Australia Rare Earth & Products Market Revenues & Volume, By Others, 2022-2032F |
6.2 Australia Rare Earth & Products Market, By Applications |
6.2.1 Overview and Analysis |
6.2.2 Australia Rare Earth & Products Market Revenues & Volume, By Magnets, 2022-2032F |
6.2.3 Australia Rare Earth & Products Market Revenues & Volume, By Catalysts, 2022-2032F |
6.2.4 Australia Rare Earth & Products Market Revenues & Volume, By Metallurgy, 2022-2032F |
6.2.5 Australia Rare Earth & Products Market Revenues & Volume, By Polishing, 2022-2032F |
6.2.6 Australia Rare Earth & Products Market Revenues & Volume, By Glass, 2022-2032F |
6.2.7 Australia Rare Earth & Products Market Revenues & Volume, By Phosphors, 2022-2032F |
6.2.8 Australia Rare Earth & Products Market Revenues & Volume, By Others, 2022-2032F |
6.2.9 Australia Rare Earth & Products Market Revenues & Volume, By Others, 2022-2032F |
7 Australia Rare Earth & Products Market Import-Export Trade Statistics |
7.1 Australia Rare Earth & Products Market Export to Major Countries |
7.2 Australia Rare Earth & Products Market Imports from Major Countries |
8 Australia Rare Earth & Products Market Key Performance Indicators |
8.1 Environmental sustainability metrics related to rare earth mining and processing operations. |
8.2 Research and development investments in innovative rare earth extraction and processing technologies. |
8.3 Percentage of rare earth elements recycled or reused in manufacturing processes. |
8.4 Adoption rate of rare earth substitutes or alternatives in key industries. |
9 Australia Rare Earth & Products Market - Opportunity Assessment |
9.1 Australia Rare Earth & Products Market Opportunity Assessment, By Product Types, 2022 & 2032F |
9.2 Australia Rare Earth & Products Market Opportunity Assessment, By Applications, 2022 & 2032F |
10 Australia Rare Earth & Products Market - Competitive Landscape |
10.1 Australia Rare Earth & Products Market Revenue Share, By Companies, 2025 |
10.2 Australia Rare Earth & Products Market Competitive Benchmarking, By Operating and Technical Parameters |
11 Company Profiles |
12 Recommendations |
13 Disclaimer |
Global Go To Market Strategy - 2030
Export potential enables firms to identify high-growth global markets with greater confidence by combining advanced trade intelligence with a structured quantitative methodology. The framework analyzes emerging demand trends and country-level import patterns while integrating macroeconomic and trade datasets such as GDP and population forecasts, bilateral import–export flows, tariff structures, elasticity differentials between developed and developing economies, geographic distance, and import demand projections. Using weighted trade values from 2020–2024 as the base period to project country-to-country export potential for 2030, these inputs are operationalized through calculated drivers such as gravity model parameters, tariff impact factors, and projected GDP per-capita growth. Through an analysis of hidden potentials, demand hotspots, and market conditions that are most favorable to success, this method enables firms to focus on target countries, maximize returns, and global expansion with data, backed by accuracy.
By factoring in the projected importer demand gap that is currently unmet and could be potential opportunity, it identifies the potential for the Exporter (Country) among 190 countries, against the general trade analysis, which identifies the biggest importer or exporter.
To discover high-growth global markets and optimize your business strategy:
Click Here
Pricing
- Single User License$ 1,995
- Department License$ 2,400
- Site License$ 3,120
- Global License$ 3,795

Leadership Perspectives from Industry Events
Search
Thought Leadership and Analyst Meet


Our Clients
6WResearch In News
- India Air Conditioner Market Set for Strong Rebound in 2026 After Weather-Led Correction and GST-Driven Recovery: 6Wresearch
- ADAS in India: How Automatic Emergency Braking, Blind Spot Detection & Driver Monitoring are Transforming Road Safety
- Doha a strategic location for EV manufacturing hub: IPA Qatar
- Demand for luxury TVs surging in the GCC, says Samsung
- Empowering Growth: The Thriving Journey of Bangladesh’s Cable Industry
- Demand for luxury TVs surging in the GCC, says Samsung
Latest Reports
- Nicaragua RPG Gaming Market (2026-2032)
- New Zealand RPG Gaming Market (2026-2032)
- Netherlands RPG Gaming Market (2026-2032)
- Nauru RPG Gaming Market (2026-2032)
- Namibia RPG Gaming Market (2026-2032)
- Mozambique RPG Gaming Market (2026-2032)
- Montenegro RPG Gaming Market (2026-2032)
- Mongolia RPG Gaming Market (2026-2032)
- Monaco RPG Gaming Market (2026-2032)
- Micronesia RPG Gaming Market (2026-2032)
Industry Events and Analyst Meet

EV India Expo 2026

HIMTEX 2026

India Refining Summit 2026

India EV Show 2026

EV tech India Expo 2026
Whitepaper
- Middle East & Africa Commercial Security Market Click here to view more.
- Middle East & Africa Fire Safety Systems & Equipment Market Click here to view more.
- GCC Drone Market Click here to view more.
- Middle East Lighting Fixture Market Click here to view more.
- GCC Physical & Perimeter Security Market Click here to view more.