Australia Salt Market (2026-2032) | Outlook, Revenue, Companies, Size, Industry, Share, Trends, Forecast, Growth, Analysis, Value
Market Forecast By Type (Rock Salt, Brine, Solar Salt, Others), By Applications (Chemical Processing, Road De-icing, Food Processing, Others) And Competitive Landscape
| Product Code: ETC074514 | Publication Date: Jun 2021 | Updated Date: Apr 2026 | Product Type: Report | |
| Publisher: 6Wresearch | Author: Ravi Bhandari | No. of Pages: 70 | No. of Figures: 35 | No. of Tables: 5 |
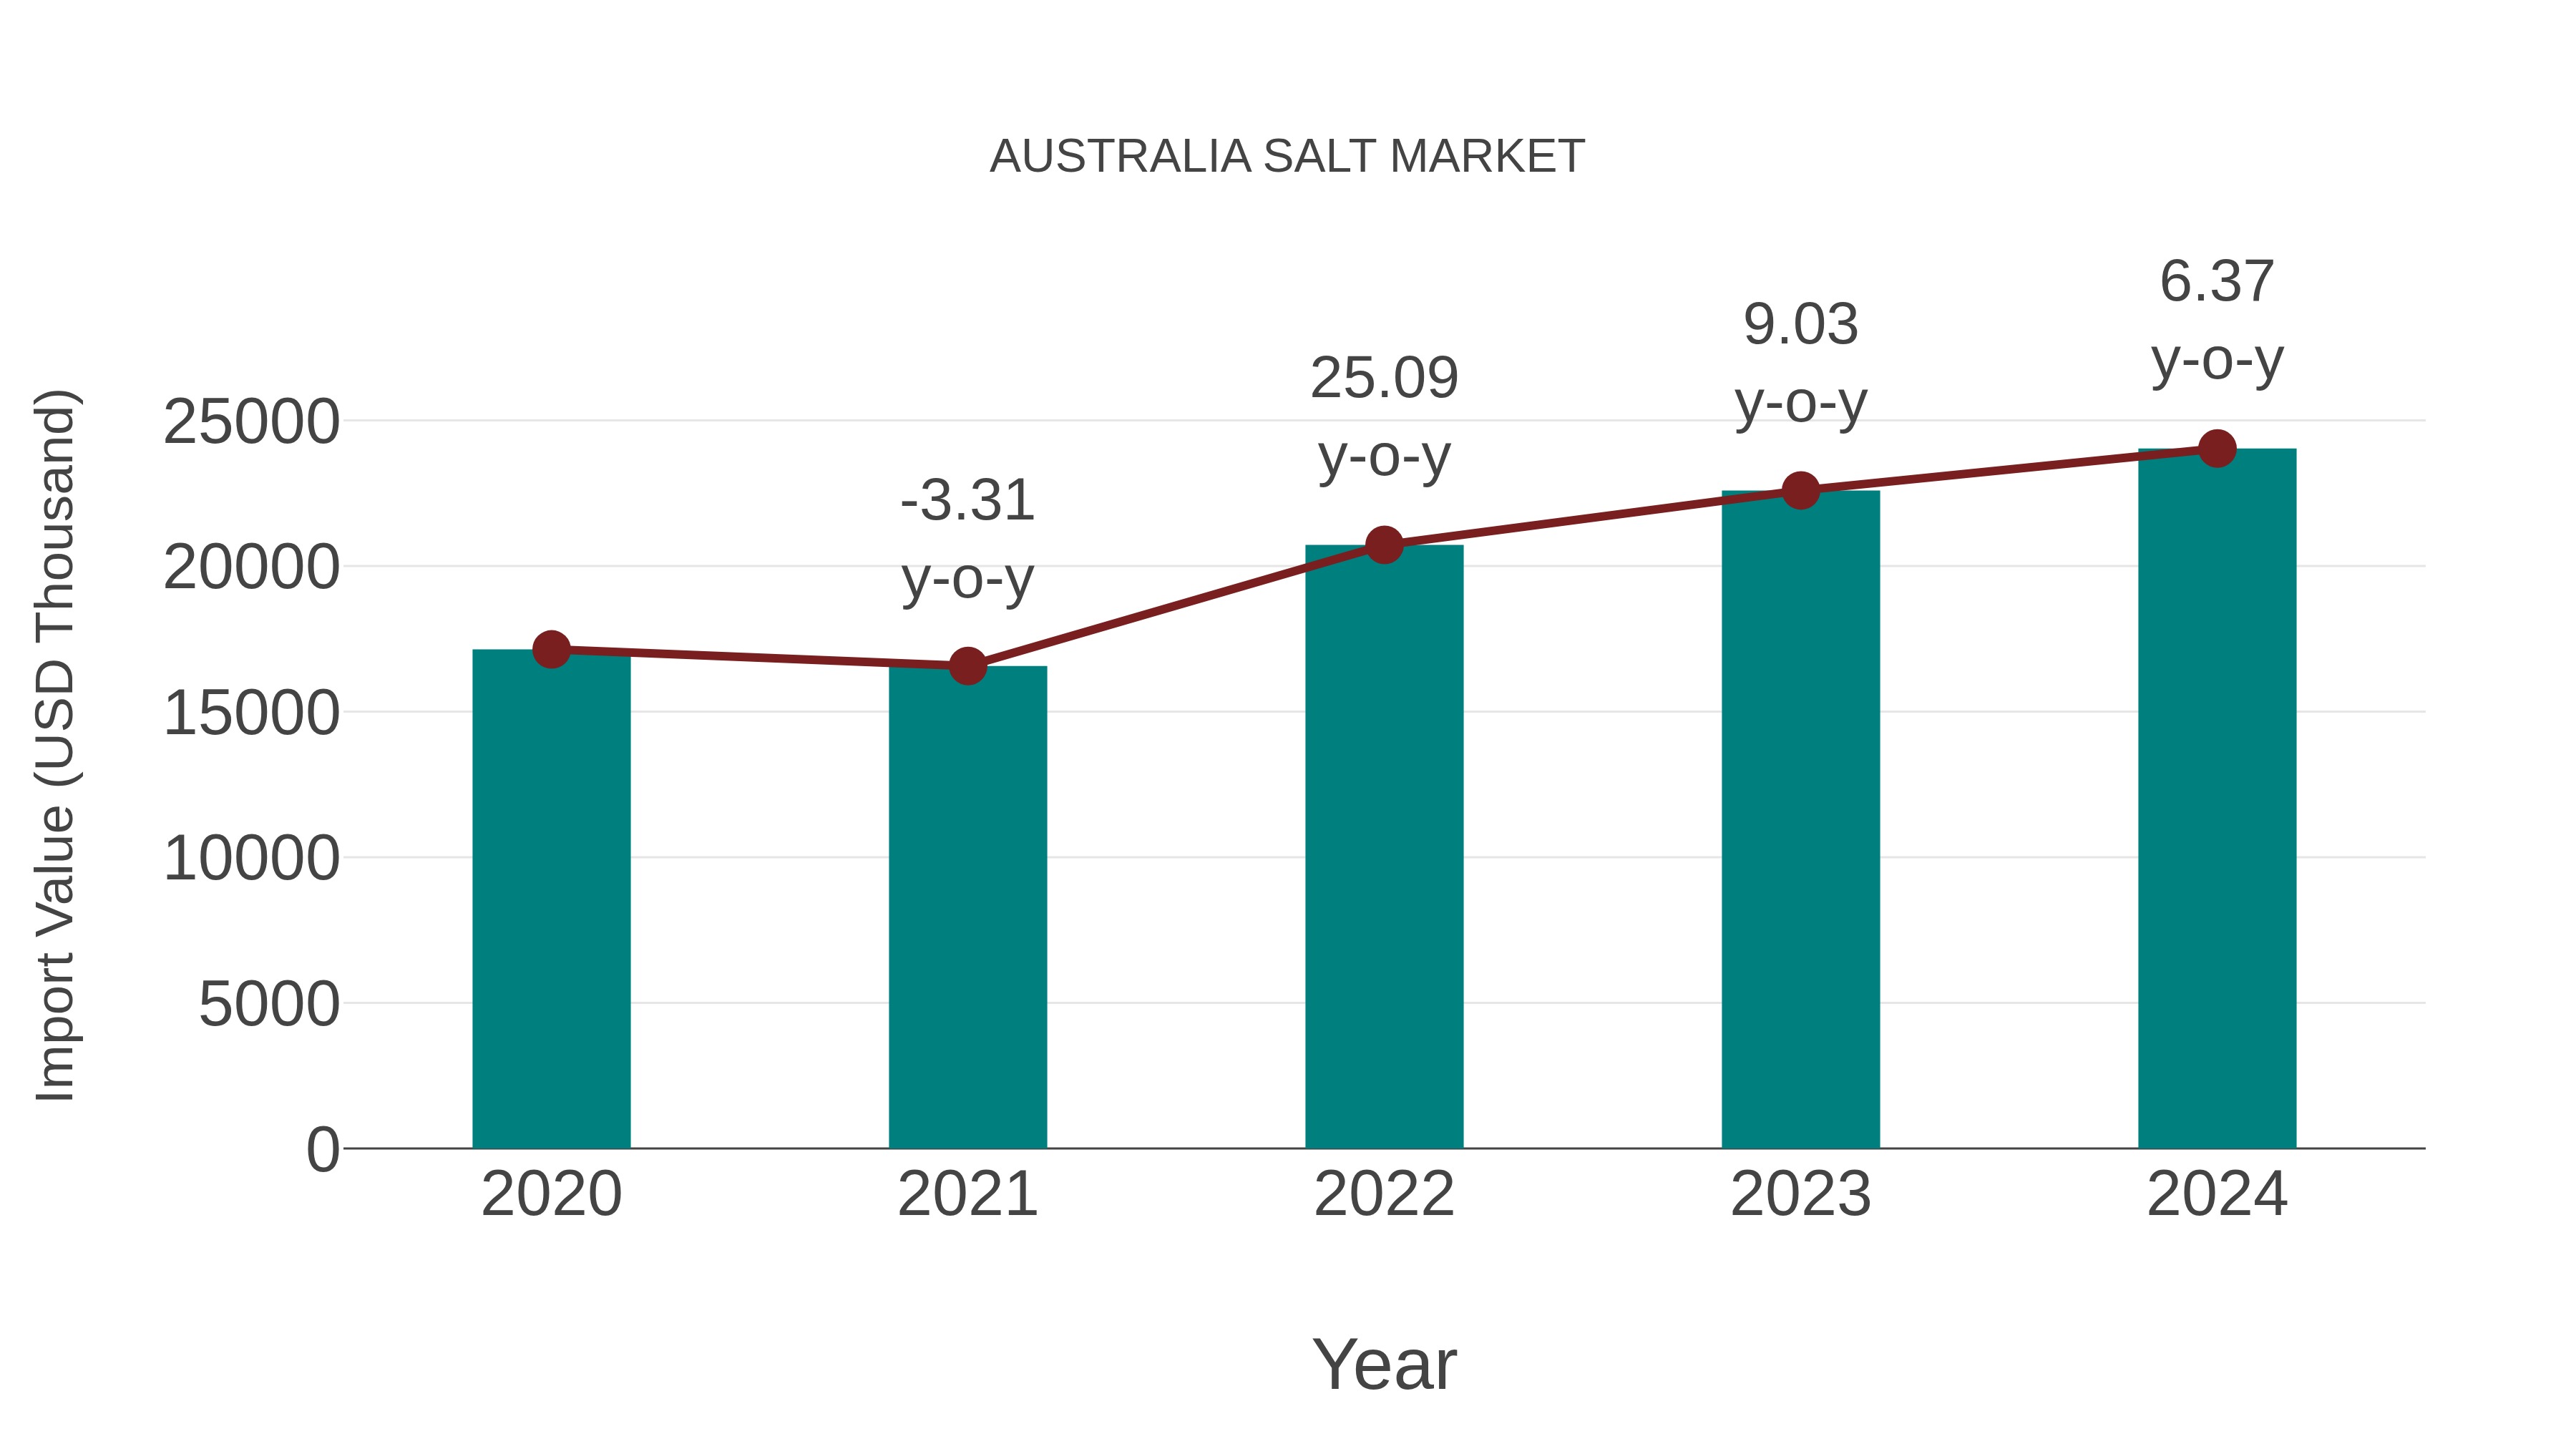
Australia Salt Market: Import Trend Analysis
In the Australia salt market, the import trend showed a growth rate of 6.37% from 2023 to 2024, with a compound annual growth rate (CAGR) of 8.83% from 2020 to 2024. This import momentum can be attributed to increasing demand for salt in various industries, indicating market stability and sustained trade activity during this period.
Australia Salt Market Growth Rate
According to 6Wresearch internal database and industry insights, the Australia Salt Market is projected to grow at a compound annual growth rate (CAGR) of 5.4% during the forecast period 2026–2032.
Topics Covered in the Australia Salt Market Report
The Australia Salt Market report thoroughly covers the market by type and applications. It provides an unbiased and detailed analysis of ongoing market trends, opportunities, challenges, and market drivers, helping stakeholders align their strategies with current and future market dynamics.
Australia Salt Market Highlights
| Report Name | Australia Salt Market |
| Forecast period | 2026-2032 |
| CAGR | 5.4% |
| Growing Sector |
Chemicals & Industrial Materials |
Australia Salt Market Synopsis
The Australia Salt Market is expected to undergo stable growth over the forecast period. This growth is proliferated by increasing industrialization, expansion of chemical and food processing industries, and rising infrastructure development activities. Salt plays a crucial role in manufacturing, water treatment, de‑icing solutions, and numerus chemical processes, making it an important raw material across sectors. Advancements in logistics and supply chain chains within Australia are helping in increased product obtainability and distribution. Rising concentration on food safety and quality is also encouraging the requirement for high‑purity salt used in food processing applications.
Evaluation of Growth Drivers in the Australia Salt Market
Below mentioned are some prominent drivers and their influence on the Australia Salt Market dynamics:
| Drivers | Primary Segment Affected | Why It Matters (Evidence) |
| Growth in Chemical Processing | Applications | Salt is a key raw material in many chemical manufacturing processes. |
| Expansion of Food Industry | Food Processing | Rising intake of processed foods increases the requirement for food grade salt. |
| Infrastructure Development | Road De‑icing | Increasing road networks and transport systems require de‑icing solutions. |
| Water Treatment Demand | Industrial Uses | Salt is essential for water softening and purification systems. |
The Australia Salt Market Size is projected to grow at a compound annual growth rate (CAGR) of 5.4% from 2026 to 2032. Through increasing consumption of salt in chemical processing industries, growing intake in packaged and processed foods, and growing infrastructure needing de‑icing applications proliferates the Australia Salt Market Growth. Rising industrial output and urban growth are boosting the need for salt across various applications. Market demand is expanding owing to increasing money allocation in water treatment and purification systems. With emerging industrial sectors and value‑added salt products, the market is poised for steady expansion.
Evaluation of Restraints in the Australia Salt Market
Below mentioned are some major restraints and their influence on the Australia Salt Market dynamics:
| Restraints | Primary Segment Affected | What This Means (Evidence) |
| Price Fluctuations | All Segments | Variability in raw material costs affects profit margins and pricing. |
| Environmental Regulations | Production & Mining | Stricter norms on salt mining operations can constrain supply. |
| Logistics Limitations | Distribution | Transportation challenges in remote areas increases distribution costs. |
| Competition from Substitutes | Certain Applications | Substitute de‑icing and chemical agents impact salt requirement in some uses |
Australia Salt Market Challenges
The Australia Salt Industry go through several challenges. It consists of price volatility owing to transportation prices, which can affect market stability and environmental regulations regarding mining and production processes may restrict growth or raise compliance prices for producers. Logistical challenges in delivering bulk salt to remote or inland regions add distribution prices. Competition from substitute products such as developed de‑icing chemicals or substitute industrial reagents can restrict salt intake in niche sections. These challenges need industry players to adapt by augmenting efficiency in supply chains, embracing creative innovation in product development, and complying with strict environmental standards to remain competitive in the market.
Australia Salt Market Trends
Several notable trends are shaping the Australia Salt Market dynamics:
- Rise in High‑Purity Salt Products: For specialized food and chemical applications manufacturers are highly creating high‑quality salt grades.
- Increased Adoption in Water Treatment: Usage of salt in residential and industrial water softening/purification systems is getting famous.
- Growth of Value‑Added Salt Products: Specialty salts are becoming famous amongst consumers. They include salts that consist of low‑sodium and fortified salts.
- Integration with Sustainable Practices: Producers are deploying environmentally conscious extraction and production methods.
Investment Opportunities in the Australia Salt Industry
Some notable investment opportunities in the Australia Salt Market include:
- Premium Salt Product Development: Prospects in specialty and value‑added salt products aiming at food and pharmaceutical industries.
- Enhanced Processing & Storage Infrastructure: For augmented supply chain efficiency, allocation of funds in modern processing facilities are advantages for it.
- Water Treatment Systems & Solutions: Money allocation in salt supply chains aligned with growing water treatment and purification infrastructure.
Top 5 Leading Players in the Australia Salt Market
Below is the list of prominent companies leading in the Australia Salt Market:
1. Dampier Salt Limited
| Company Name | Dampier Salt Limited |
|---|---|
| Established Year | 1971 |
| Headquarters | Western Australia, Australia |
| Official Website | - |
Dampier Salt Limited, a subsidiary of Rio Tinto, is one of Australia’s largest producers of salt, mainly through extensive solar evaporation operations in Western Australia.
2. Cheetham Salt Limited
| Company Name | Cheetham Salt Limited |
|---|---|
| Established Year | 1888 |
| Headquarters | Victoria, Australia |
| Official Website | Click Here |
Cheetham Salt Limited is one of Australia’s oldest salt producers, with functions that include harvesting natural sea salt and manufacturing refined salt products.
3. BCI Minerals Limited
| Company Name | BCI Minerals Limited |
|---|---|
| Established Year | 2006 |
| Headquarters | Perth, Western Australia, Australia |
| Official Website | Click Here |
BCI Minerals Limited is an evolving force in the Australian salt market, focusing on the development of large scale salt and mineral projects.
4. Shark Bay Salt Pty Ltd
| Company Name | Shark Bay Salt Pty Ltd |
|---|---|
| Established Year | 1968 |
| Headquarters | Shark Bay, Western Australia, Australia |
| Official Website | - |
Shark Bay Salt Pty Ltd functions salt production facilities in the Shark Bay region, known for high quality sea salt harvested through solar evaporation.
5. Australian Saltworks
| Company Name | Australian Saltworks |
|---|---|
| Established Year | 1892 |
| Headquarters | Mulgundawa, South Australia, Australia |
| Official Website | Click Here |
Australian Saltworks is a heritage salt producer with a long history in the Australian salt industry.
Government Regulations Introduced in the Australia Salt Market
According to Australian government data, several regulatory frameworks are introduced to proliferate the salt market. To ensure quality and safety requirements for salt products used in food and consumable applications , various standards are established by the Food Standards Australia New Zealand (FSANZ). To safeguard ecosystems and labour safety ,the government enforces workplace and environmental compliance measures for salt extraction sites and chemical uses. To evolve the operating environment for salt producers, policies supporting industrial safety standards, responsible waste management, and water resource protection are helping in transforming the environment.
Future Insights of the Australia Salt Market
The Australia Salt Market is poised for stable growth owing to continuous industrial growth, rising requirement from major applications such as chemical processing and food processing, and rising urbanization. Persistent technological advancements in production will augment product quality and functional efficiencies. To redefine extraction and manufacturing processes, rising concentration on sustainable production practices and environmental compliance assist in transforming them. Growth in road infrastructure development along with water treatment needs will maintain the need for bulk and formulated salt products.
Market Segmentation Analysis
The report offers a comprehensive study of the following market segments and their leading categories:
By Type – Rock Salt to dominate the market:
According to Mansi Ahuja, Senior Research Analyst at 6Wresearch, Rock salt is expected to dominate the Australia Salt Market share due to its broad use in chemical processing, road de‑icing, water treatment, and industrial applications.
By Applications – Chemical Processing to dominate the market:
Chemical processing applications are anticipated to lead the Australia Salt Market Share and salt is a crucial input in chlorine, caustic soda, soda ash and other chemical manufacturing processes, proliferating substantial demand from the chemical industry.
Key Attractiveness of the Report
- 10 Years of Market Numbers.
- Historical Data Starting from 2022 to 2025.
- Base Year: 2025.
- Forecast Data until 2032.
- Key Performance Indicators Impacting the Market.
- Major Upcoming Developments and Projects.
Key Highlights of the Report:
- Australia Salt Market Outlook
- Market Size of Australia Salt Market, 2025
- Forecast of Australia Salt Market, 2032
- Historical Data and Forecast of Australia Salt Revenues & Volume for the Period 2022-2032
- Australia Salt Market Trend Evolution
- Australia Salt Market Drivers and Challenges
- Australia Salt Price Trends
- Australia Salt Porter's Five Forces
- Australia Salt Industry Life Cycle
- Historical Data and Forecast of Australia Salt Market Revenues & Volume By Type for the Period 2022-2032
- Historical Data and Forecast of Australia Salt Market Revenues & Volume By Rock Salt for the Period 2022-2032
- Historical Data and Forecast of Australia Salt Market Revenues & Volume By Brine? for the Period 2022-2032
- Historical Data and Forecast of Australia Salt Market Revenues & Volume By Solar Salt for the Period 2022-2032
- Historical Data and Forecast of Australia Salt Market Revenues & Volume By Others for the Period 2022-2032
- Historical Data and Forecast of Australia Salt Market Revenues & Volume By Applications for the Period 2022-2032
- Historical Data and Forecast of Australia Salt Market Revenues & Volume By Chemical Processing for the Period 2022-2032
- Historical Data and Forecast of Australia Salt Market Revenues & Volume By Road De-icing for the Period 2022-2032
- Historical Data and Forecast of Australia Salt Market Revenues & Volume By Food Processing for the Period 2022-2032
- Historical Data and Forecast of Australia Salt Market Revenues & Volume By Others for the Period 2022-2032
- Australia Salt Import Export Trade Statistics
- Market Opportunity Assessment By Type
- Market Opportunity Assessment By Applications
- Australia Salt Top Companies Market Share
- Australia Salt Competitive Benchmarking By Technical and Operational Parameters
- Australia Salt Company Profiles
- Australia Salt Key Strategic Recommendations
Market Covered
The report offers a comprehensive study of the subsequent market segments:
By Type
- Rock Salt
- Brine
- Solar Salt
- Others
By Applications
- Chemical Processing
- Road De‑icing
- Food Processing
- Others
Australia Salt Market (2026-2032): FAQs
The Australia Salt Market is expected to grow at a CAGR of 5.4% during the forecast period.
Salt demand is proliferated by chemical processing industries, food processing, road de icing, and industrial water treatment applications
The growth of the Australia Salt Market is primarily proliferated by the increasing demand from industries such as chemical processing, food processing, and road de‑icing.
The Australia Salt Market goes through several challenges, including price volatility
due to fluctuating transportation costs, which impact market stability.
6Wresearch actively monitors the Australia Salt Market and publishes its comprehensive annual report, highlighting emerging trends, growth drivers, revenue analysis, and forecast outlook. Our insights help businesses to make data-backed strategic decisions with ongoing market dynamics. Our analysts track relevent industries related to the Australia Salt Market, allowing our clients with actionable intelligence and reliable forecasts tailored to emerging regional needs.
Yes, we provide customisation as per your requirements. To learn more, feel free to contact us on sales@6wresearch.com
| 1 Executive Summary |
| 2 Introduction |
| 2.1 Key Highlights of the Report |
| 2.2 Report Description |
| 2.3 Market Scope & Segmentation |
| 2.4 Research Methodology |
| 2.5 Assumptions |
| 3 Australia Salt Market Overview |
| 3.1 Australia Country Macro Economic Indicators |
| 3.2 Australia Salt Market Revenues & Volume, 2022 & 2032F |
| 3.3 Australia Salt Market - Industry Life Cycle |
| 3.4 Australia Salt Market - Porter's Five Forces |
| 3.5 Australia Salt Market Revenues & Volume Share, By Type, 2022 & 2032F |
| 3.6 Australia Salt Market Revenues & Volume Share, By Applications, 2022 & 2032F |
| 4 Australia Salt Market Dynamics |
| 4.1 Impact Analysis |
| 4.2 Market Drivers |
| 4.2.1 Increasing health awareness leading to higher demand for natural and mineral-rich salts |
| 4.2.2 Growth in the food and beverage industry driving the consumption of salts for flavor enhancement |
| 4.2.3 Rising popularity of gourmet and specialty salts in culinary applications |
| 4.3 Market Restraints |
| 4.3.1 Health concerns related to high salt intake leading to a shift towards low-sodium alternatives |
| 4.3.2 Fluctuating raw material prices impacting the production costs of salt manufacturers |
| 5 Australia Salt Market Trends |
| 6 Australia Salt Market, By Types |
| 6.1 Australia Salt Market, By Type |
| 6.1.1 Overview and Analysis |
| 6.1.2 Australia Salt Market Revenues & Volume, By Type, 2022-2032F |
| 6.1.3 Australia Salt Market Revenues & Volume, By Rock Salt, 2022-2032F |
| 6.1.4 Australia Salt Market Revenues & Volume, By Brine , 2022-2032F |
| 6.1.5 Australia Salt Market Revenues & Volume, By Solar Salt, 2022-2032F |
| 6.1.6 Australia Salt Market Revenues & Volume, By Others, 2022-2032F |
| 6.2 Australia Salt Market, By Applications |
| 6.2.1 Overview and Analysis |
| 6.2.2 Australia Salt Market Revenues & Volume, By Chemical Processing, 2022-2032F |
| 6.2.3 Australia Salt Market Revenues & Volume, By Road De-icing, 2022-2032F |
| 6.2.4 Australia Salt Market Revenues & Volume, By Food Processing, 2022-2032F |
| 6.2.5 Australia Salt Market Revenues & Volume, By Others, 2022-2032F |
| 7 Australia Salt Market Import-Export Trade Statistics |
| 7.1 Australia Salt Market Export to Major Countries |
| 7.2 Australia Salt Market Imports from Major Countries |
| 8 Australia Salt Market Key Performance Indicators |
| 8.1 Consumer preferences for organic and unprocessed salts |
| 8.2 Adoption rates of low-sodium salt substitutes in the market |
| 8.3 Demand for premium and specialty salt products in the food industry |
| 9 Australia Salt Market - Opportunity Assessment |
| 9.1 Australia Salt Market Opportunity Assessment, By Type, 2022 & 2032F |
| 9.2 Australia Salt Market Opportunity Assessment, By Applications, 2022 & 2032F |
| 10 Australia Salt Market - Competitive Landscape |
| 10.1 Australia Salt Market Revenue Share, By Companies, 2025 |
| 10.2 Australia Salt Market Competitive Benchmarking, By Operating and Technical Parameters |
| 11 Company Profiles |
| 12 Recommendations |
| 13 Disclaimer |
Global Go To Market Strategy - 2030
Export potential enables firms to identify high-growth global markets with greater confidence by combining advanced trade intelligence with a structured quantitative methodology. The framework analyzes emerging demand trends and country-level import patterns while integrating macroeconomic and trade datasets such as GDP and population forecasts, bilateral import–export flows, tariff structures, elasticity differentials between developed and developing economies, geographic distance, and import demand projections. Using weighted trade values from 2020–2024 as the base period to project country-to-country export potential for 2030, these inputs are operationalized through calculated drivers such as gravity model parameters, tariff impact factors, and projected GDP per-capita growth. Through an analysis of hidden potentials, demand hotspots, and market conditions that are most favorable to success, this method enables firms to focus on target countries, maximize returns, and global expansion with data, backed by accuracy.
By factoring in the projected importer demand gap that is currently unmet and could be potential opportunity, it identifies the potential for the Exporter (Country) among 190 countries, against the general trade analysis, which identifies the biggest importer or exporter.
To discover high-growth global markets and optimize your business strategy:
Click Here
Pricing
- Single User License$ 1,995
- Department License$ 2,400
- Site License$ 3,120
- Global License$ 3,795

Leadership Perspectives from Industry Events
Search
Thought Leadership and Analyst Meet


Our Clients
6WResearch In News
- India Air Conditioner Market Set for Strong Rebound in 2026 After Weather-Led Correction and GST-Driven Recovery: 6Wresearch
- ADAS in India: How Automatic Emergency Braking, Blind Spot Detection & Driver Monitoring are Transforming Road Safety
- Doha a strategic location for EV manufacturing hub: IPA Qatar
- Demand for luxury TVs surging in the GCC, says Samsung
- Empowering Growth: The Thriving Journey of Bangladesh’s Cable Industry
- Demand for luxury TVs surging in the GCC, says Samsung
Latest Reports
- Nicaragua RPG Gaming Market (2026-2032)
- New Zealand RPG Gaming Market (2026-2032)
- Netherlands RPG Gaming Market (2026-2032)
- Nauru RPG Gaming Market (2026-2032)
- Namibia RPG Gaming Market (2026-2032)
- Mozambique RPG Gaming Market (2026-2032)
- Montenegro RPG Gaming Market (2026-2032)
- Mongolia RPG Gaming Market (2026-2032)
- Monaco RPG Gaming Market (2026-2032)
- Micronesia RPG Gaming Market (2026-2032)
Industry Events and Analyst Meet

HIMTEX 2026

India Refining Summit 2026

India EV Show 2026

EV tech India Expo 2026

Auto Tech Asia 2026
Whitepaper
- Middle East & Africa Commercial Security Market Click here to view more.
- Middle East & Africa Fire Safety Systems & Equipment Market Click here to view more.
- GCC Drone Market Click here to view more.
- Middle East Lighting Fixture Market Click here to view more.
- GCC Physical & Perimeter Security Market Click here to view more.