Australia Slack Wax Market (2026-2032) | Share, Trends, Forecast, Industry, Competitive Landscape, Growth, Companies, Segmentation, Analysis, Value, Outlook, Size & Revenue
Market Forecast By Grade (Light Grade, Heavy Grade), By Application (Paraffin Wax, Construction Boards, Candle Manufacturing, Others) And Competitive Landscape
| Product Code: ETC6191080 | Publication Date: Sep 2024 | Updated Date: Mar 2026 | Product Type: Market Research Report | |
| Publisher: 6Wresearch | Author: Shubham Deep | No. of Pages: 75 | No. of Figures: 35 | No. of Tables: 20 |
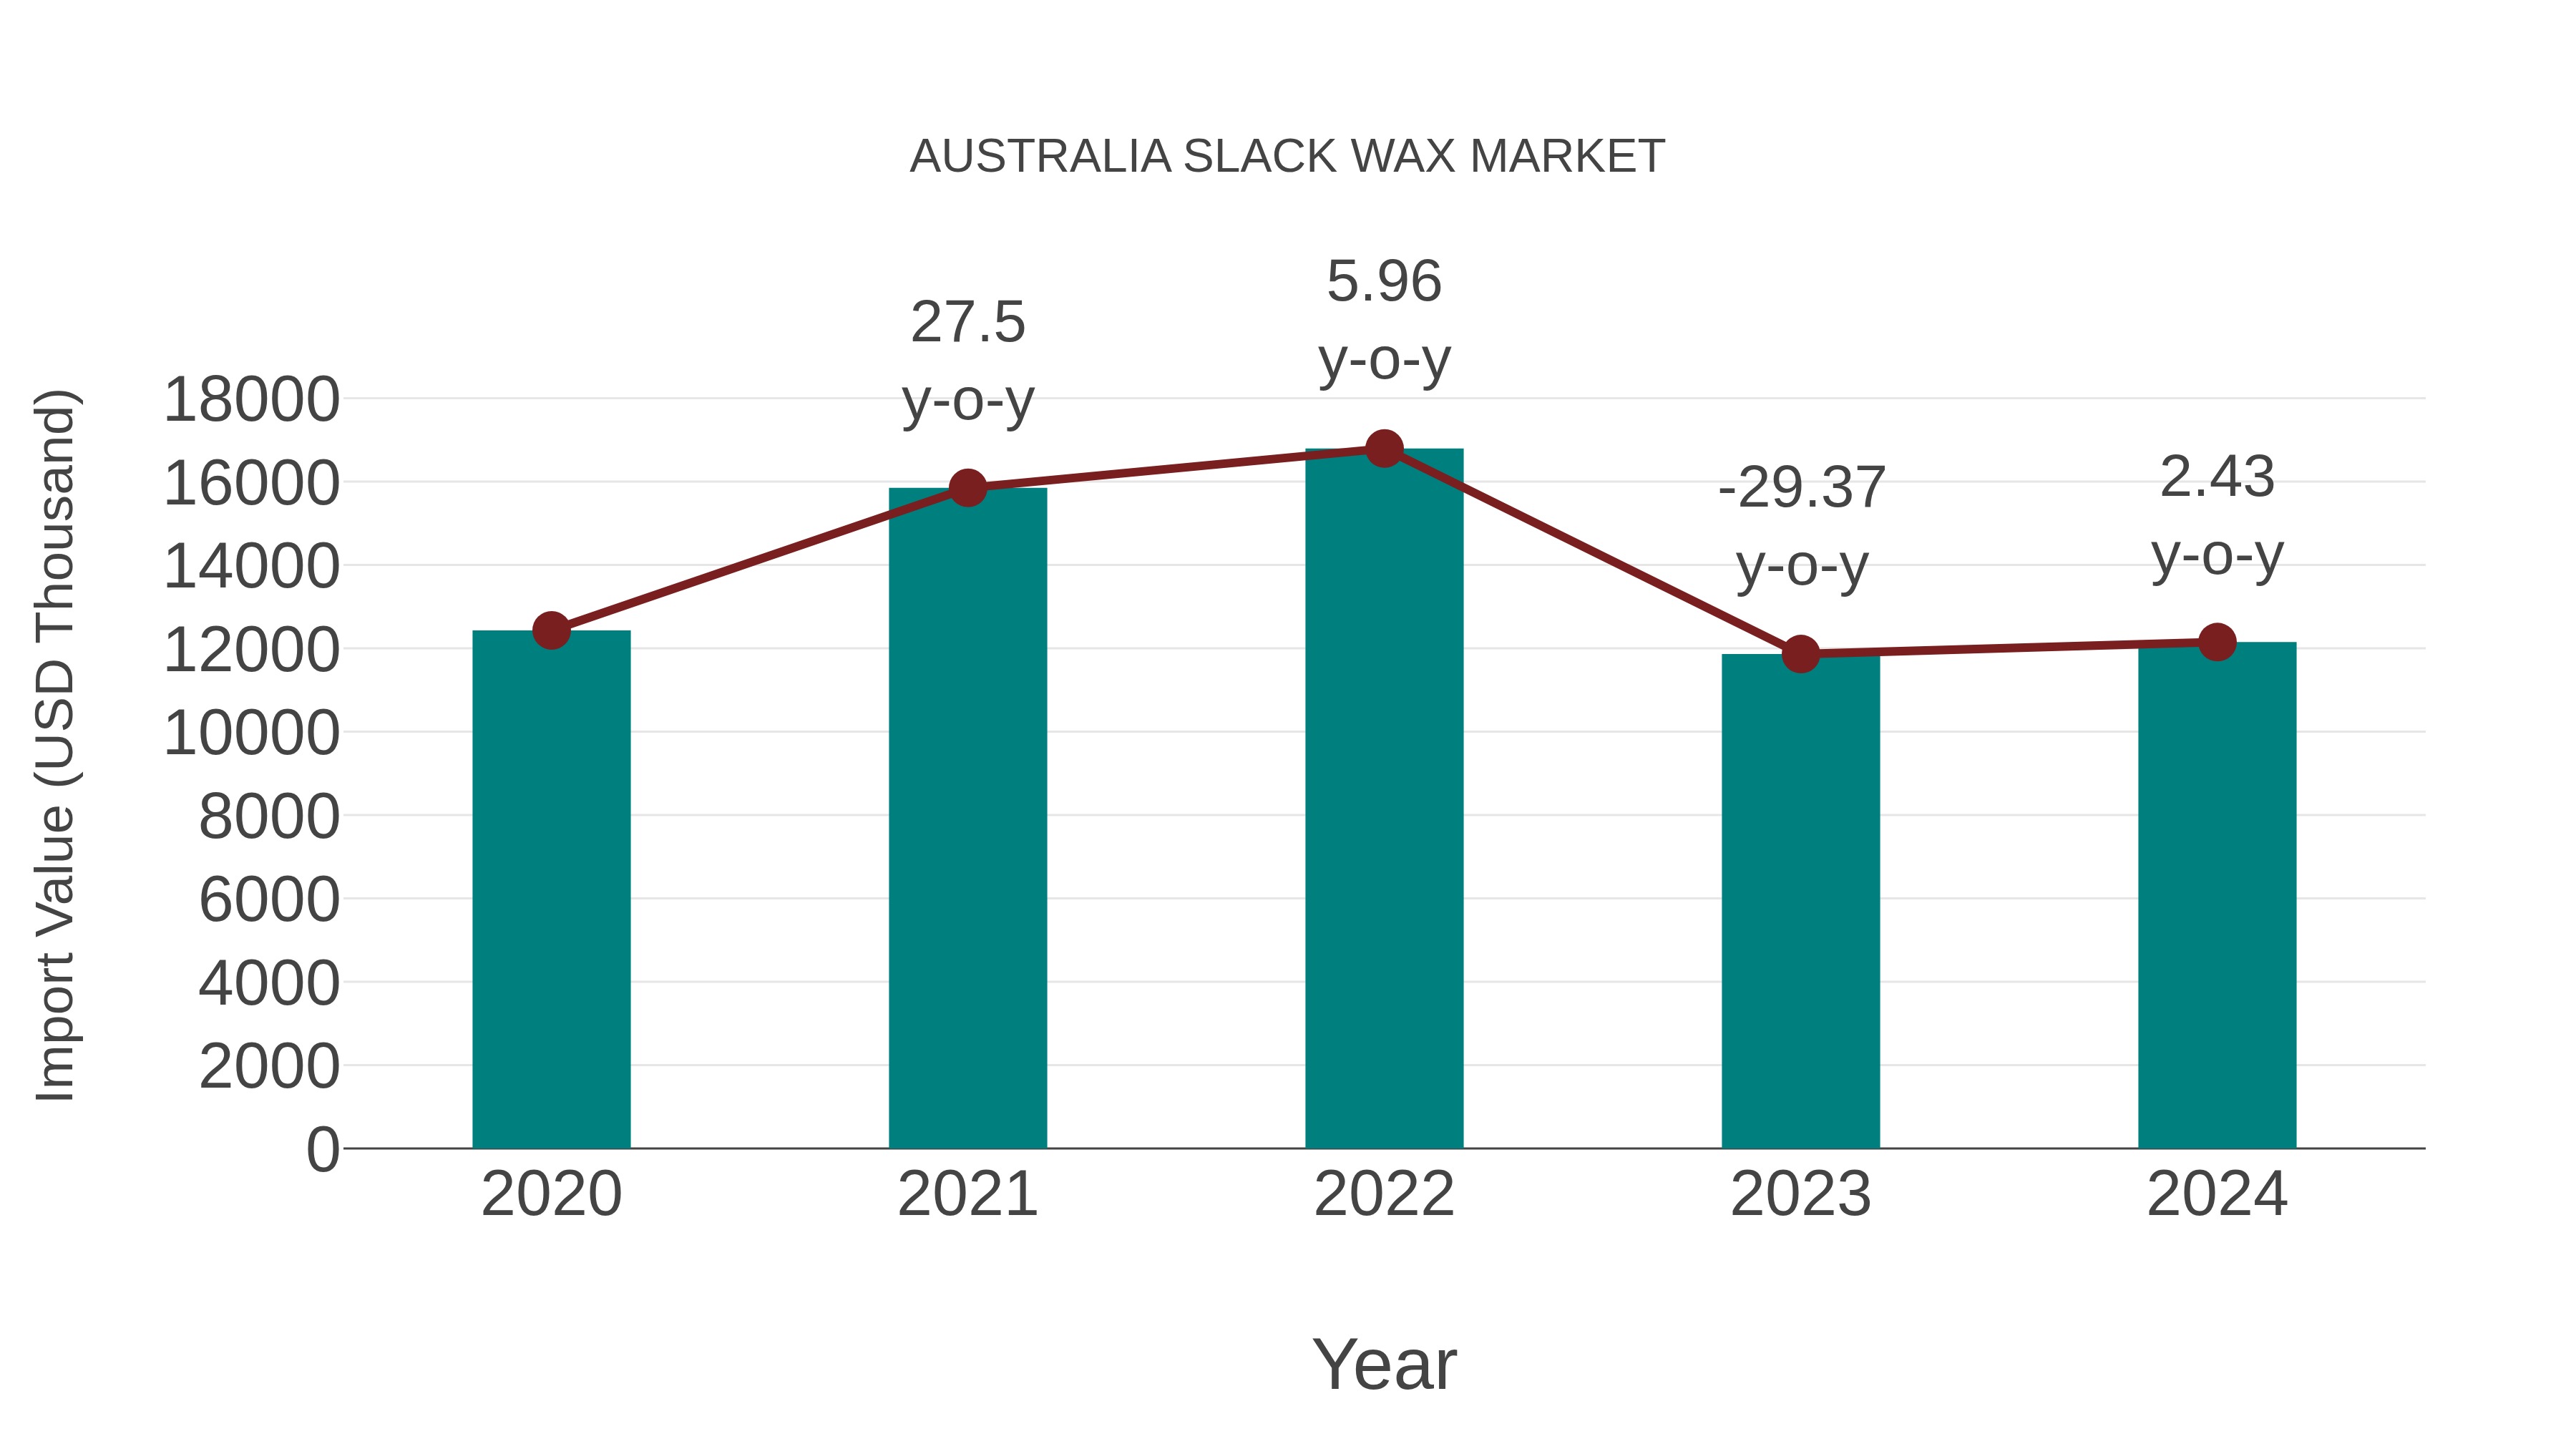
Australia Slack Wax Market: Import Trend Analysis
In the Australia slack wax market, the import trend showed a growth rate of 2.43% from 2023 to 2024, with a compound annual growth rate (CAGR) of -0.57% from 2020 to 2024. This decline in CAGR can be attributed to shifting demand dynamics influenced by changing trade policies impacting market stability.
Australia Slack Wax Market Overview
In Australia, the slack wax market is primarily influenced by its application in manufacturing candles, polishes, matches, and other industrial products. Sourced as a by-product from lubricating oil refining, slack wax is traded locally and also imported. Market growth is steady but moderate, impacted by the shift towards more eco-friendly and synthetic alternatives. However, niche industries, especially those using wax for sealing and protective coatings, continue to create demand.
Drivers of the market
The slack wax market in Australia is experiencing a moderate growth trend due to its applications in industries such as candle manufacturing, lubricants, and emulsions. Growing demand for eco-friendly and biodegradable wax formulations is influencing the development of cleaner slack wax variants. Moreover, the domestic production is being complemented by imports from Asia-Pacific countries, creating a competitive landscape with price sensitivity as a key market factor.
Challenges of the market
The slack wax market contends with supply chain disruptions, especially given its reliance on crude oil and petroleum derivatives, which are subject to volatile global prices. Environmental regulations in Australia impose strict standards on wax processing and emissions, leading to higher compliance costs for manufacturers. There is also increasing demand for sustainable and bio-based alternatives, which challenges traditional slack wax producers to innovate or face declining demand. Fluctuations in demand from end-use industries such as candles, cosmetics, and rubber complicate market stability.
Investment opportunities in the Market
Australias slack wax market offers promising prospects tied to the growing use of wax derivatives in cosmetics, pharmaceuticals, and industrial applications. Investments in refining processes to produce higher purity waxes and developing environmentally friendly extraction methods can attract demand from green industries. Additionally, expansion into value-added wax products such as microcrystalline waxes and specialty wax blends can create niche markets with higher profit margins.
Government Policy of the market
The slack wax market in Australia is regulated primarily through environmental policies due to the petrochemical origins of slack wax. The government imposes strict environmental protection standards through agencies like the Department of Agriculture, Water and the Environment, aiming to reduce pollution and ensure sustainable handling of wax by-products. Regulations on chemical usage, waste disposal, and emissions indirectly impact slack wax production and use.
Key Highlights of the Report:
- Australia Slack Wax Market Outlook
- Market Size of Australia Slack Wax Market, 2025
- Forecast of Australia Slack Wax Market, 2032
- Historical Data and Forecast of Australia Slack Wax Revenues & Volume for the Period 2022 - 2032F
- Australia Slack Wax Market Trend Evolution
- Australia Slack Wax Market Drivers and Challenges
- Australia Slack Wax Price Trends
- Australia Slack Wax Porter's Five Forces
- Australia Slack Wax Industry Life Cycle
- Historical Data and Forecast of Australia Slack Wax Market Revenues & Volume By Grade for the Period 2022 - 2032F
- Historical Data and Forecast of Australia Slack Wax Market Revenues & Volume By Light Grade for the Period 2022 - 2032F
- Historical Data and Forecast of Australia Slack Wax Market Revenues & Volume By Heavy Grade for the Period 2022 - 2032F
- Historical Data and Forecast of Australia Slack Wax Market Revenues & Volume By Application for the Period 2022 - 2032F
- Historical Data and Forecast of Australia Slack Wax Market Revenues & Volume By Paraffin Wax for the Period 2022 - 2032F
- Historical Data and Forecast of Australia Slack Wax Market Revenues & Volume By Construction Boards for the Period 2022 - 2032F
- Historical Data and Forecast of Australia Slack Wax Market Revenues & Volume By Candle Manufacturing for the Period 2022 - 2032F
- Historical Data and Forecast of Australia Slack Wax Market Revenues & Volume By Others for the Period 2022 - 2032F
- Australia Slack Wax Import Export Trade Statistics
- Market Opportunity Assessment By Grade
- Market Opportunity Assessment By Application
- Australia Slack Wax Top Companies Market Share
- Australia Slack Wax Competitive Benchmarking By Technical and Operational Parameters
- Australia Slack Wax Company Profiles
- Australia Slack Wax Key Strategic Recommendations
Australia Slack Wax Market (2026-2032): FAQs
6Wresearch actively monitors the Australia Slack Wax Market and publishes its comprehensive annual report, highlighting emerging trends, growth drivers, revenue analysis, and forecast outlook. Our insights help businesses to make data-backed strategic decisions with ongoing market dynamics. Our analysts track relevent industries related to the Australia Slack Wax Market, allowing our clients with actionable intelligence and reliable forecasts tailored to emerging regional needs.
Yes, we provide customisation as per your requirements. To learn more, feel free to contact us on sales@6wresearch.com
1 Executive Summary |
2 Introduction |
2.1 Key Highlights of the Report |
2.2 Report Description |
2.3 Market Scope & Segmentation |
2.4 Research Methodology |
2.5 Assumptions |
3 Australia Slack Wax Market Overview |
3.1 Australia Country Macro Economic Indicators |
3.2 Australia Slack Wax Market Revenues & Volume, 2022 & 2032F |
3.3 Australia Slack Wax Market - Industry Life Cycle |
3.4 Australia Slack Wax Market - Porter's Five Forces |
3.5 Australia Slack Wax Market Revenues & Volume Share, By Grade, 2022 & 2032F |
3.6 Australia Slack Wax Market Revenues & Volume Share, By Application, 2022 & 2032F |
4 Australia Slack Wax Market Dynamics |
4.1 Impact Analysis |
4.2 Market Drivers |
4.2.1 Growing demand for slack wax in various industries such as cosmetics, pharmaceuticals, and rubber. |
4.2.2 Increasing use of slack wax in the manufacturing of candles and polishes. |
4.2.3 Favorable government regulations supporting the production and export of slack wax. |
4.3 Market Restraints |
4.3.1 Fluctuations in crude oil prices impacting the production cost of slack wax. |
4.3.2 Competition from alternative products like paraffin wax affecting the market growth. |
4.3.3 Environmental concerns related to the production and disposal of slack wax. |
5 Australia Slack Wax Market Trends |
6 Australia Slack Wax Market, By Types |
6.1 Australia Slack Wax Market, By Grade |
6.1.1 Overview and Analysis |
6.1.2 Australia Slack Wax Market Revenues & Volume, By Grade, 2022 - 2032F |
6.1.3 Australia Slack Wax Market Revenues & Volume, By Light Grade, 2022 - 2032F |
6.1.4 Australia Slack Wax Market Revenues & Volume, By Heavy Grade, 2022 - 2032F |
6.2 Australia Slack Wax Market, By Application |
6.2.1 Overview and Analysis |
6.2.2 Australia Slack Wax Market Revenues & Volume, By Paraffin Wax, 2022 - 2032F |
6.2.3 Australia Slack Wax Market Revenues & Volume, By Construction Boards, 2022 - 2032F |
6.2.4 Australia Slack Wax Market Revenues & Volume, By Candle Manufacturing, 2022 - 2032F |
6.2.5 Australia Slack Wax Market Revenues & Volume, By Others, 2022 - 2032F |
7 Australia Slack Wax Market Import-Export Trade Statistics |
7.1 Australia Slack Wax Market Export to Major Countries |
7.2 Australia Slack Wax Market Imports from Major Countries |
8 Australia Slack Wax Market Key Performance Indicators |
8.1 Price trends of crude oil and its derivatives. |
8.2 Import and export volumes of slack wax in Australia. |
8.3 Innovation and technological advancements in the slack wax industry. |
9 Australia Slack Wax Market - Opportunity Assessment |
9.1 Australia Slack Wax Market Opportunity Assessment, By Grade, 2022 & 2032F |
9.2 Australia Slack Wax Market Opportunity Assessment, By Application, 2022 & 2032F |
10 Australia Slack Wax Market - Competitive Landscape |
10.1 Australia Slack Wax Market Revenue Share, By Companies, 2025 |
10.2 Australia Slack Wax Market Competitive Benchmarking, By Operating and Technical Parameters |
11 Company Profiles |
12 Recommendations |
13 Disclaimer |
Global Go To Market Strategy - 2030
Export potential enables firms to identify high-growth global markets with greater confidence by combining advanced trade intelligence with a structured quantitative methodology. The framework analyzes emerging demand trends and country-level import patterns while integrating macroeconomic and trade datasets such as GDP and population forecasts, bilateral import–export flows, tariff structures, elasticity differentials between developed and developing economies, geographic distance, and import demand projections. Using weighted trade values from 2020–2024 as the base period to project country-to-country export potential for 2030, these inputs are operationalized through calculated drivers such as gravity model parameters, tariff impact factors, and projected GDP per-capita growth. Through an analysis of hidden potentials, demand hotspots, and market conditions that are most favorable to success, this method enables firms to focus on target countries, maximize returns, and global expansion with data, backed by accuracy.
By factoring in the projected importer demand gap that is currently unmet and could be potential opportunity, it identifies the potential for the Exporter (Country) among 190 countries, against the general trade analysis, which identifies the biggest importer or exporter.
To discover high-growth global markets and optimize your business strategy:
Click Here
Pricing
- Single User License$ 1,995
- Department License$ 2,400
- Site License$ 3,120
- Global License$ 3,795

Leadership Perspectives from Industry Events
Search
Thought Leadership and Analyst Meet


Our Clients
6WResearch In News
- India Export Attractiveness Tracker 2026
- India Air Conditioner Market Set for Strong Rebound in 2026 After Weather-Led Correction and GST-Driven Recovery: 6Wresearch
- ADAS in India: How Automatic Emergency Braking, Blind Spot Detection & Driver Monitoring are Transforming Road Safety
- Doha a strategic location for EV manufacturing hub: IPA Qatar
- Demand for luxury TVs surging in the GCC, says Samsung
- Empowering Growth: The Thriving Journey of Bangladesh’s Cable Industry
Latest Reports
- Qatar Access and Home Network Market (2026-2032)
- Nicaragua RPG Gaming Market (2026-2032)
- New Zealand RPG Gaming Market (2026-2032)
- Netherlands RPG Gaming Market (2026-2032)
- Nauru RPG Gaming Market (2026-2032)
- Namibia RPG Gaming Market (2026-2032)
- Mozambique RPG Gaming Market (2026-2032)
- Montenegro RPG Gaming Market (2026-2032)
- Mongolia RPG Gaming Market (2026-2032)
- Monaco RPG Gaming Market (2026-2032)
Industry Events and Analyst Meet

EV India Expo 2026

HIMTEX 2026

India Refining Summit 2026

India EV Show 2026

EV tech India Expo 2026
Whitepaper
- Middle East & Africa Commercial Security Market Click here to view more.
- Middle East & Africa Fire Safety Systems & Equipment Market Click here to view more.
- GCC Drone Market Click here to view more.
- Middle East Lighting Fixture Market Click here to view more.
- GCC Physical & Perimeter Security Market Click here to view more.