Australia Smart Card in Government Market (2026-2032) | Companies, Growth, Trends, Outlook, Forecast, Size & Revenue, Competitive Landscape, Share, Segmentation, Industry, Analysis, Value
Market Forecast By Communication (Contact Smart Cards, Contactless Smart Cards, Microprocessor-Based Smart Cards, Memory-Based Smart Cards), By Component (Hardware, Software, Services), By Application (Identification and Authentication, Entrance and Exit, Other), By Access (Physical, Logical) And Competitive Landscape
| Product Code: ETC6191171 | Publication Date: Sep 2024 | Updated Date: Mar 2026 | Product Type: Market Research Report | |
| Publisher: 6Wresearch | Author: Shubham Padhi | No. of Pages: 75 | No. of Figures: 35 | No. of Tables: 20 |
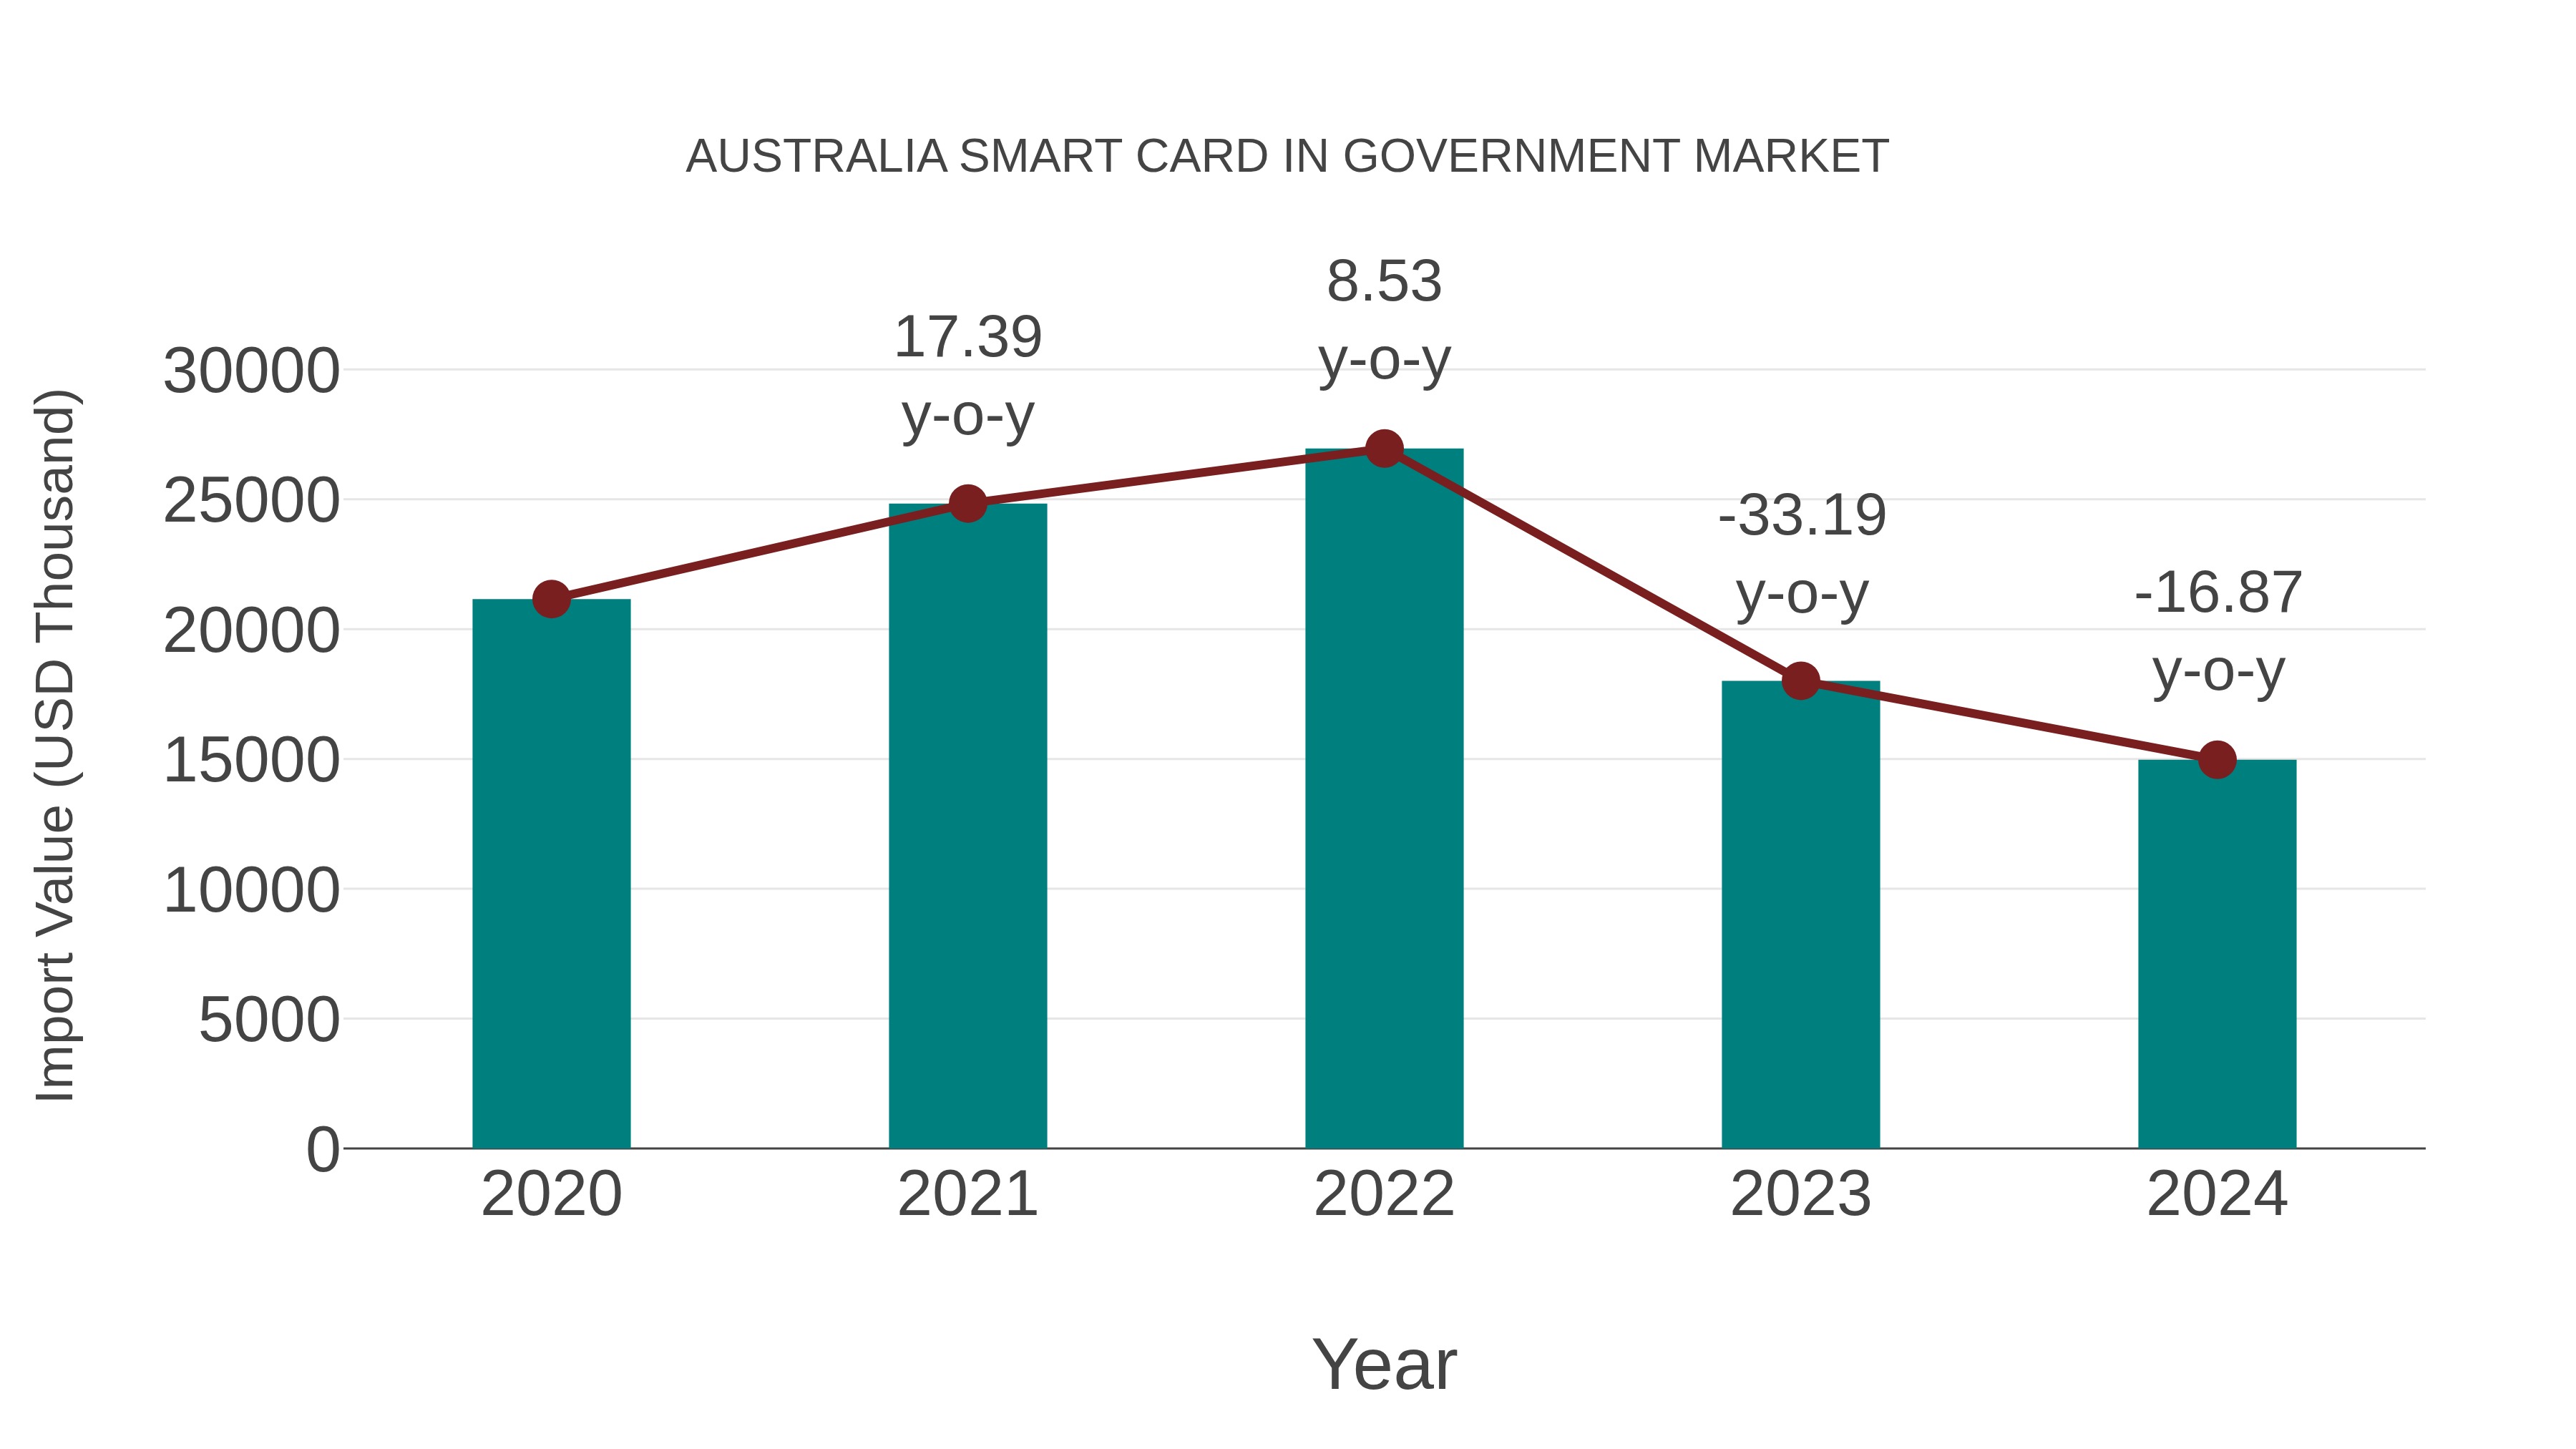
Australia Smart Card in Government Market: Import Trend Analysis
Australia`s import trend for smart cards in the government market experienced a decline from 2023 to 2024, with a growth rate of -16.87%. The compound annual growth rate (CAGR) for the period 2020-2024 was -8.28%. This negative momentum could be attributed to shifts in demand for smart card technology within government sectors or changes in trade policies affecting imports.
Australia Smart Card In Government Market Overview
The smart card market within the Australian government sector is robust, focusing on identity management, secure access to services, and streamlined public administration. Smart cards are used for citizen identification, social security access, and secure employee credentials. Growing demands for enhanced security and fraud prevention are accelerating the deployment of these smart solutions in government services.
Drivers of the market
Government agencies are leveraging smart cards for identity verification, social welfare distribution, and secure access to public services. Trends show a shift towards multi-application cards combining functions like transport passes, voting IDs, and healthcare access. The emphasis on cybersecurity and interoperability between government departments is driving innovation in this sector.
Challenges of the market
Government use of smart cards struggles with legacy infrastructure compatibility, causing delays in full deployment. There is also a challenge in maintaining cybersecurity standards amidst increasing cyber threats targeting government systems. Public trust and data privacy concerns are critical hurdles, alongside the complexity of integrating smart card systems across multiple government agencies.
Investment opportunities in the Market
Australias digital transformation agenda across federal and state institutions makes the smart card government sector ripe for investment. Opportunities exist in providing multi-purpose identity cards for secure access to public services, border control, and welfare programs. Investors can also explore partnerships to build digital identity ecosystems, backed by blockchain and advanced encryption technologies.
Government Policy of the market
The use of smart cards in the Australian government is driven by initiatives like the Digital Transformation Strategy, which focuses on secure identity verification and e-government services. Smart cards are incorporated into public service identification systems, building access control, and secure login protocols for government portals. The Digital Identity Framework by the Digital Transformation Agency (DTA) provides the legislative and technical guidelines for smart card integration, ensuring privacy and cybersecurity are maintained.
Key Highlights of the Report:
- Australia Smart Card in Government Market Outlook
- Market Size of Australia Smart Card in Government Market, 2025
- Forecast of Australia Smart Card in Government Market, 2032
- Historical Data and Forecast of Australia Smart Card in Government Revenues & Volume for the Period 2022 - 2032F
- Australia Smart Card in Government Market Trend Evolution
- Australia Smart Card in Government Market Drivers and Challenges
- Australia Smart Card in Government Price Trends
- Australia Smart Card in Government Porter's Five Forces
- Australia Smart Card in Government Industry Life Cycle
- Historical Data and Forecast of Australia Smart Card in Government Market Revenues & Volume By Communication for the Period 2022 - 2032F
- Historical Data and Forecast of Australia Smart Card in Government Market Revenues & Volume By Contact Smart Cards for the Period 2022 - 2032F
- Historical Data and Forecast of Australia Smart Card in Government Market Revenues & Volume By Contactless Smart Cards for the Period 2022 - 2032F
- Historical Data and Forecast of Australia Smart Card in Government Market Revenues & Volume By Microprocessor-Based Smart Cards for the Period 2022 - 2032F
- Historical Data and Forecast of Australia Smart Card in Government Market Revenues & Volume By Memory-Based Smart Cards for the Period 2022 - 2032F
- Historical Data and Forecast of Australia Smart Card in Government Market Revenues & Volume By Component for the Period 2022 - 2032F
- Historical Data and Forecast of Australia Smart Card in Government Market Revenues & Volume By Hardware for the Period 2022 - 2032F
- Historical Data and Forecast of Australia Smart Card in Government Market Revenues & Volume By Software for the Period 2022 - 2032F
- Historical Data and Forecast of Australia Smart Card in Government Market Revenues & Volume By Services for the Period 2022 - 2032F
- Historical Data and Forecast of Australia Smart Card in Government Market Revenues & Volume By Application for the Period 2022 - 2032F
- Historical Data and Forecast of Australia Smart Card in Government Market Revenues & Volume By Identification and Authentication for the Period 2022 - 2032F
- Historical Data and Forecast of Australia Smart Card in Government Market Revenues & Volume By Entrance and Exit for the Period 2022 - 2032F
- Historical Data and Forecast of Australia Smart Card in Government Market Revenues & Volume By Other for the Period 2022 - 2032F
- Historical Data and Forecast of Australia Smart Card in Government Market Revenues & Volume By Access for the Period 2022 - 2032F
- Historical Data and Forecast of Australia Smart Card in Government Market Revenues & Volume By Physical for the Period 2022 - 2032F
- Historical Data and Forecast of Australia Smart Card in Government Market Revenues & Volume By Logical for the Period 2022 - 2032F
- Australia Smart Card in Government Import Export Trade Statistics
- Market Opportunity Assessment By Communication
- Market Opportunity Assessment By Component
- Market Opportunity Assessment By Application
- Market Opportunity Assessment By Access
- Australia Smart Card in Government Top Companies Market Share
- Australia Smart Card in Government Competitive Benchmarking By Technical and Operational Parameters
- Australia Smart Card in Government Company Profiles
- Australia Smart Card in Government Key Strategic Recommendations
Australia Smart Card in Government Market (2026-2032): FAQs
6Wresearch actively monitors the Australia Smart Card in Government Market and publishes its comprehensive annual report, highlighting emerging trends, growth drivers, revenue analysis, and forecast outlook. Our insights help businesses to make data-backed strategic decisions with ongoing market dynamics. Our analysts track relevent industries related to the Australia Smart Card in Government Market, allowing our clients with actionable intelligence and reliable forecasts tailored to emerging regional needs.
Yes, we provide customisation as per your requirements. To learn more, feel free to contact us on sales@6wresearch.com
1 Executive Summary |
2 Introduction |
2.1 Key Highlights of the Report |
2.2 Report Description |
2.3 Market Scope & Segmentation |
2.4 Research Methodology |
2.5 Assumptions |
3 Australia Smart Card in Government Market Overview |
3.1 Australia Country Macro Economic Indicators |
3.2 Australia Smart Card in Government Market Revenues & Volume, 2022 & 2032F |
3.3 Australia Smart Card in Government Market - Industry Life Cycle |
3.4 Australia Smart Card in Government Market - Porter's Five Forces |
3.5 Australia Smart Card in Government Market Revenues & Volume Share, By Communication, 2022 & 2032F |
3.6 Australia Smart Card in Government Market Revenues & Volume Share, By Component, 2022 & 2032F |
3.7 Australia Smart Card in Government Market Revenues & Volume Share, By Application, 2022 & 2032F |
3.8 Australia Smart Card in Government Market Revenues & Volume Share, By Access, 2022 & 2032F |
4 Australia Smart Card in Government Market Dynamics |
4.1 Impact Analysis |
4.2 Market Drivers |
4.2.1 Increasing government initiatives towards digitization and modernization of services. |
4.2.2 Growing concerns over data security and identity theft. |
4.2.3 Implementation of smart card technology for efficient identification and authentication processes. |
4.3 Market Restraints |
4.3.1 High initial investment costs associated with smart card implementation. |
4.3.2 Resistance to change from traditional paper-based systems. |
4.3.3 Concerns over data privacy and compliance with regulations. |
5 Australia Smart Card in Government Market Trends |
6 Australia Smart Card in Government Market, By Types |
6.1 Australia Smart Card in Government Market, By Communication |
6.1.1 Overview and Analysis |
6.1.2 Australia Smart Card in Government Market Revenues & Volume, By Communication, 2022 - 2032F |
6.1.3 Australia Smart Card in Government Market Revenues & Volume, By Contact Smart Cards, 2022 - 2032F |
6.1.4 Australia Smart Card in Government Market Revenues & Volume, By Contactless Smart Cards, 2022 - 2032F |
6.1.5 Australia Smart Card in Government Market Revenues & Volume, By Microprocessor-Based Smart Cards, 2022 - 2032F |
6.1.6 Australia Smart Card in Government Market Revenues & Volume, By Memory-Based Smart Cards, 2022 - 2032F |
6.2 Australia Smart Card in Government Market, By Component |
6.2.1 Overview and Analysis |
6.2.2 Australia Smart Card in Government Market Revenues & Volume, By Hardware, 2022 - 2032F |
6.2.3 Australia Smart Card in Government Market Revenues & Volume, By Software, 2022 - 2032F |
6.2.4 Australia Smart Card in Government Market Revenues & Volume, By Services, 2022 - 2032F |
6.3 Australia Smart Card in Government Market, By Application |
6.3.1 Overview and Analysis |
6.3.2 Australia Smart Card in Government Market Revenues & Volume, By Identification and Authentication, 2022 - 2032F |
6.3.3 Australia Smart Card in Government Market Revenues & Volume, By Entrance and Exit, 2022 - 2032F |
6.3.4 Australia Smart Card in Government Market Revenues & Volume, By Other, 2022 - 2032F |
6.4 Australia Smart Card in Government Market, By Access |
6.4.1 Overview and Analysis |
6.4.2 Australia Smart Card in Government Market Revenues & Volume, By Physical, 2022 - 2032F |
6.4.3 Australia Smart Card in Government Market Revenues & Volume, By Logical, 2022 - 2032F |
7 Australia Smart Card in Government Market Import-Export Trade Statistics |
7.1 Australia Smart Card in Government Market Export to Major Countries |
7.2 Australia Smart Card in Government Market Imports from Major Countries |
8 Australia Smart Card in Government Market Key Performance Indicators |
8.1 Adoption rate of smart card technology within government agencies. |
8.2 Reduction in identity fraud cases post-implementation of smart cards. |
8.3 Efficiency improvements in government services due to smart card integration. |
8.4 Level of satisfaction among government employees and citizens with smart card use. |
8.5 Cost savings achieved through the implementation of smart card technology. |
9 Australia Smart Card in Government Market - Opportunity Assessment |
9.1 Australia Smart Card in Government Market Opportunity Assessment, By Communication, 2022 & 2032F |
9.2 Australia Smart Card in Government Market Opportunity Assessment, By Component, 2022 & 2032F |
9.3 Australia Smart Card in Government Market Opportunity Assessment, By Application, 2022 & 2032F |
9.4 Australia Smart Card in Government Market Opportunity Assessment, By Access, 2022 & 2032F |
10 Australia Smart Card in Government Market - Competitive Landscape |
10.1 Australia Smart Card in Government Market Revenue Share, By Companies, 2025 |
10.2 Australia Smart Card in Government Market Competitive Benchmarking, By Operating and Technical Parameters |
11 Company Profiles |
12 Recommendations |
13 Disclaimer |
Global Go To Market Strategy - 2030
Export potential enables firms to identify high-growth global markets with greater confidence by combining advanced trade intelligence with a structured quantitative methodology. The framework analyzes emerging demand trends and country-level import patterns while integrating macroeconomic and trade datasets such as GDP and population forecasts, bilateral import–export flows, tariff structures, elasticity differentials between developed and developing economies, geographic distance, and import demand projections. Using weighted trade values from 2020–2024 as the base period to project country-to-country export potential for 2030, these inputs are operationalized through calculated drivers such as gravity model parameters, tariff impact factors, and projected GDP per-capita growth. Through an analysis of hidden potentials, demand hotspots, and market conditions that are most favorable to success, this method enables firms to focus on target countries, maximize returns, and global expansion with data, backed by accuracy.
By factoring in the projected importer demand gap that is currently unmet and could be potential opportunity, it identifies the potential for the Exporter (Country) among 190 countries, against the general trade analysis, which identifies the biggest importer or exporter.
To discover high-growth global markets and optimize your business strategy:
Click Here
Pricing
- Single User License$ 1,995
- Department License$ 2,400
- Site License$ 3,120
- Global License$ 3,795

Leadership Perspectives from Industry Events
Search
Thought Leadership and Analyst Meet


Our Clients
6WResearch In News
- India Export Attractiveness Tracker 2026
- India Air Conditioner Market Set for Strong Rebound in 2026 After Weather-Led Correction and GST-Driven Recovery: 6Wresearch
- ADAS in India: How Automatic Emergency Braking, Blind Spot Detection & Driver Monitoring are Transforming Road Safety
- Doha a strategic location for EV manufacturing hub: IPA Qatar
- Demand for luxury TVs surging in the GCC, says Samsung
- Empowering Growth: The Thriving Journey of Bangladesh’s Cable Industry
Latest Reports
- Nicaragua RPG Gaming Market (2026-2032)
- New Zealand RPG Gaming Market (2026-2032)
- Netherlands RPG Gaming Market (2026-2032)
- Nauru RPG Gaming Market (2026-2032)
- Namibia RPG Gaming Market (2026-2032)
- Mozambique RPG Gaming Market (2026-2032)
- Montenegro RPG Gaming Market (2026-2032)
- Mongolia RPG Gaming Market (2026-2032)
- Monaco RPG Gaming Market (2026-2032)
- Micronesia RPG Gaming Market (2026-2032)
Industry Events and Analyst Meet

EV India Expo 2026

HIMTEX 2026

India Refining Summit 2026

India EV Show 2026

EV tech India Expo 2026
Whitepaper
- Middle East & Africa Commercial Security Market Click here to view more.
- Middle East & Africa Fire Safety Systems & Equipment Market Click here to view more.
- GCC Drone Market Click here to view more.
- Middle East Lighting Fixture Market Click here to view more.
- GCC Physical & Perimeter Security Market Click here to view more.