Australia Smart Nanomaterials Market (2026-2032) Outlook | Industry, Value, Share, Forecast, Analysis, Revenue, Size, Growth, Companies & Trends
Market Forecast By Type (Metal-Based, Carbon Based, Polymeric, Others), By Industry Downstream (Pharmaceuticals, Electronics, Consumer Goods, Construction, Transportation, Others) And Competitive Landscape
| Product Code: ETC071994 | Publication Date: Jun 2021 | Updated Date: Jun 2026 | Product Type: Report | |
| Publisher: 6Wresearch | Author: Ravi Bhandari | No. of Pages: 70 | No. of Figures: 35 | No. of Tables: 5 |
Australia Smart Nanomaterials Market Size, Share & Growth Rate
The Australia Smart Nanomaterials Market was estimated at USD 384 Million in 2025 and is projected to reach USD 501 Million by 2032, growing at a CAGR of 3.9% from 2026 to 2032. This positive trajectory is primarily driven by advancements in nanotechnology, which are leading to enhanced functionalities and superior properties in materials used across diverse sectors such as healthcare, electronics, and manufacturing. As industries increasingly prioritize efficiency and performance improvements, the demand for innovative solutions based on smart nanomaterials is surging.
Australia Smart Nanomaterials Market Year-wise Growth Rate and Key Drivers
This graph highlights how the Australia Smart Nanomaterials Market has steadily grown over the years, supported by major growth factors.
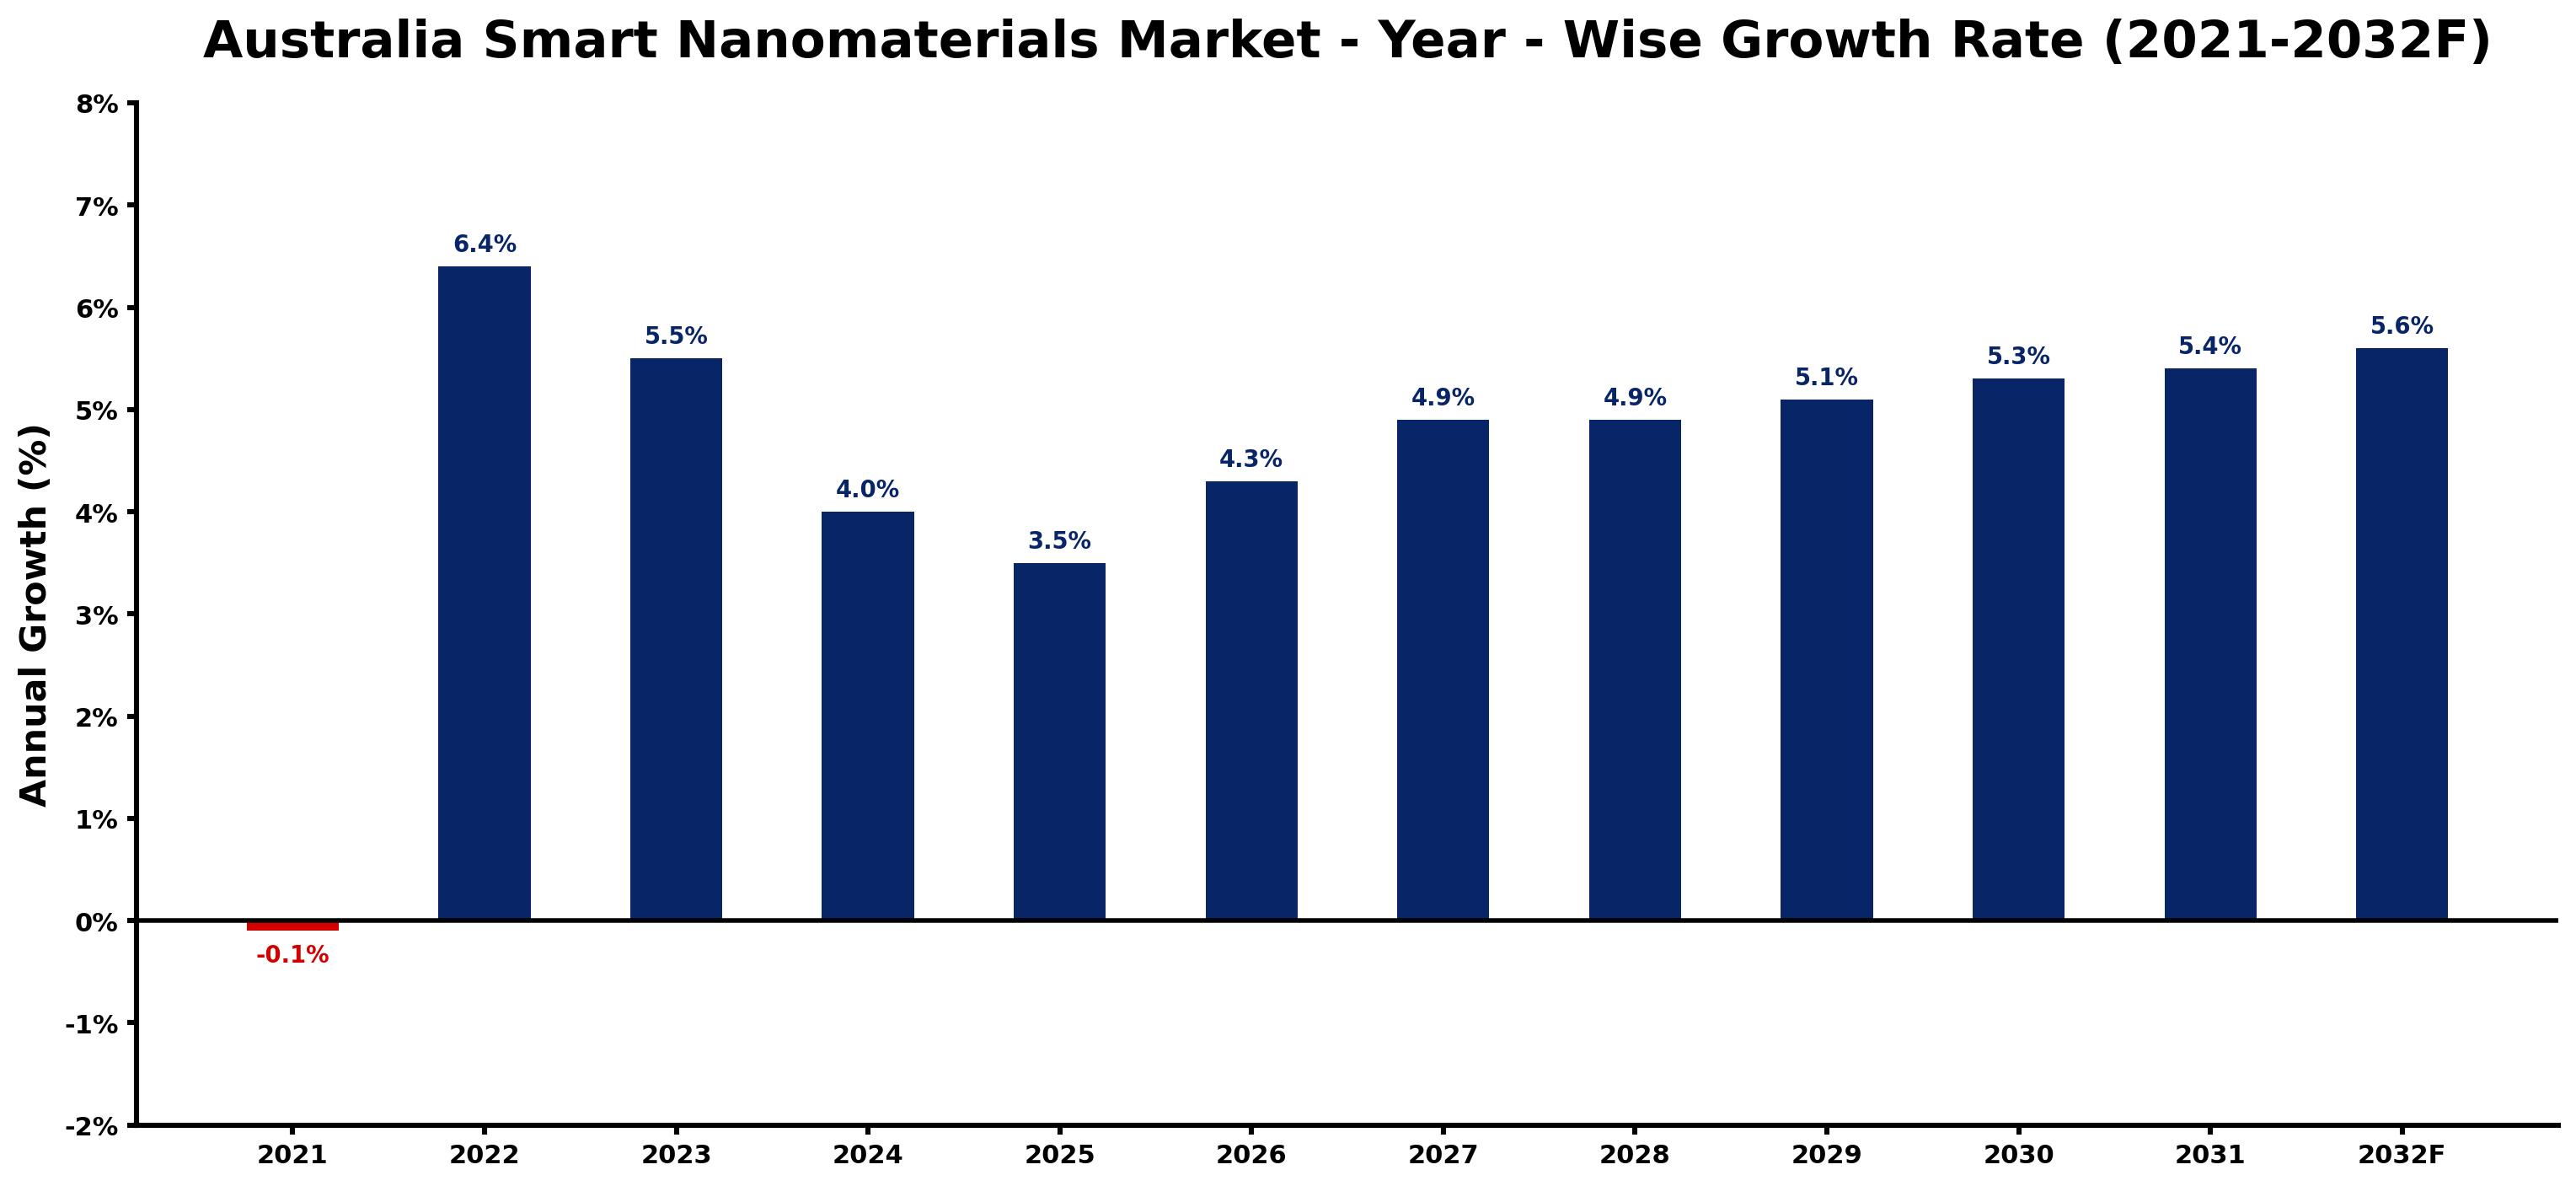
The table below presents the year‑wise growth rates along with the key drivers influencing the market
| Year | Growth Rate | Major Drivers |
| 2021 | -0.1% | Expansion of commercial construction activities |
| 2022 | 6.4% | Rapid growth in telecom and data center sectors |
| 2023 | 5.5% | Increasing industrial infrastructure investments |
| 2024 | 4.0% | Increasing adoption of advanced technologies |
| 2025 | 3.5% | Increasing adoption of advanced technologies |
| 2026 | 4.3% | Increasing adoption of advanced technologies |
| 2027 | 4.9% | Growing urbanization and commercial development |
| 2028 | 4.9% | Expansion of transportation and logistics networks |
| 2029 | 5.1% | Rapid growth in telecom and data center sectors |
| 2030 | 5.3% | Increasing adoption of advanced technologies |
| 2031 | 5.4% | Growing renewable energy integration projects |
| 2032 | 5.6% | Growing renewable energy integration projects |
Note - Market size estimations and growth projections presented in this report are based on 6Wresearch’s advanced forecasting approach, validated with industry datasets as of June 2026.
Australia Smart Nanomaterials Market Synopsis
In Australia, smart nanomaterials are becoming pivotal to technological advancements, particularly in sectors seeking to optimize materials' capabilities. Their unique properties—such as increased strength, lighter weight, and improved conductivity—are proving transformative for applications ranging from drug delivery systems to energy storage solutions.
Current trends indicate a robust interest from various industries in integrating smart nanomaterials into their processes. This integration is not only enhancing product performance but is also aligning with sustainability goals, as these materials often reduce waste and energy consumption in production processes.
Australia Smart Nanomaterials Market Key Takeaways
- Significant growth potential exists in the Australia Smart Nanomaterials Market, driven by ongoing technological advancements.
- Key sectors leveraging these materials include healthcare, electronics, and manufacturing, focusing on enhanced efficiency and durability.
- Government initiatives are crucial in fostering innovation and reducing barriers to adoption in various industries.
- Awareness and understanding of smart nanomaterials are critical for stakeholders to fully capitalize on their potential benefits.
- Regulatory frameworks and guidelines must evolve to address safety and environmental concerns associated with nanotechnology.
Evaluation of Restraints in Australia Smart Nanomaterials Market
Despite its growth potential, the Australia Smart Nanomaterials Market grapples with significant constraints. A primary limitation is the limited awareness regarding the advantages of nanotechnology among potential users. This hesitance to adopt new materials is compounded by regulatory uncertainties, as stakeholders seek clarity on safety, environmental impact, and ethical implications. Without robust frameworks and widespread education efforts, the adoption and integration of smart nanomaterials may remain hindered.
Australia Smart Nanomaterials Market Trends
Several key trends are shaping the landscape of the Australia Smart Nanomaterials Market. One notable trend is the increasing use of these materials in biodegradable applications, which resonates well with the rising demand for sustainable products. Additionally, advancements in manufacturing technologies, such as 3D printing, are enabling more complex structures made from smart nanomaterials, facilitating their application across a wider range of sectors. Furthermore, the fusion of nanotechnology with digital technologies is creating exciting opportunities in smart healthcare solutions, enhancing precision in diagnostics and treatment.
Australia Smart Nanomaterials Market Opportunities
The prospects for growth within the Australia Smart Nanomaterials Market are promising, particularly in niche applications like targeted drug delivery and nano-coatings for enhanced durability. Furthermore, collaborations between academia and industry are poised to drive innovation, leading to the development of new materials with enhanced functionalities. Companies that prioritize research and development will be at the forefront of this market evolution, capitalizing on emerging opportunities to meet the growing demand for advanced materials.
Government Initiatives in the Australia Smart Nanomaterials Market
The Australian government has taken proactive steps to enhance the smart nanomaterials market through various policies aimed at promoting research and development. Initiatives include funding programs for innovative projects, as well as tax incentives designed to encourage private sector investments in nanotechnology. Collaborations between governmental bodies and industry players are being fostered to streamline the innovation pipeline, showcasing Australia’s commitment to becoming a significant player in the global smart nanomaterials sector.
Future Insights of the Australia Smart Nanomaterials Market
Looking ahead to 2026-2032, the Australia Smart Nanomaterials Market is anticipated to evolve significantly, with the emergence of new applications driven by continuous research and innovation. As industries increasingly recognize the capabilities of nanomaterials in enhancing product performance and sustainability, market growth will likely accelerate. The interplay between technology advancements, regulatory developments, and market education will be crucial in shaping the future landscape of smart nanomaterials in Australia.
Australia Smart Nanomaterials Market Latest Developments (May 2025 - June 2026)
Recent developments in the Australia Smart Nanomaterials Market indicate a strong momentum in research collaborations between universities and industry stakeholders. These partnerships are yielding innovative applications across sectors, particularly in healthcare where breakthroughs in drug delivery systems are being reported. Additionally, significant attention is being given to the environmental impact of nanomaterials, prompting new initiatives aimed at establishing safety protocols and sustainability standards.
Australia Smart Nanomaterials Market - Key Attractiveness of the Report
- 10 Years of Market Numbers
- Historical Data Starting from 2022 to 2025
- Base Year: 2025
- Forecast Data until 2032
- Key Performance Indicators Impacting the Market
- Major Upcoming Developments and Projects
Key Highlights of the Report:
- Australia Smart Nanomaterials Market Outlook
- Market Size of Australia Smart Nanomaterials Market, 2025
- Forecast of Australia Smart Nanomaterials Market, 2032
- Historical Data and Forecast of Australia Smart Nanomaterials Revenues & Volume for the Period 2022-2032F
- Australia Smart Nanomaterials Market Trend Evolution
- Australia Smart Nanomaterials Market Drivers and Challenges
- Australia Smart Nanomaterials Price Trends
- Australia Smart Nanomaterials Porter's Five Forces
- Australia Smart Nanomaterials Industry Life Cycle
- Historical Data and Forecast of Australia Smart Nanomaterials Market Revenues & Volume By Type for the Period 2022-2032F
- Historical Data and Forecast of Australia Smart Nanomaterials Market Revenues & Volume By Metal-Based for the Period 2022-2032F
- Historical Data and Forecast of Australia Smart Nanomaterials Market Revenues & Volume By Carbon Based for the Period 2022-2032F
- Historical Data and Forecast of Australia Smart Nanomaterials Market Revenues & Volume By Polymeric for the Period 2022-2032F
- Historical Data and Forecast of Australia Smart Nanomaterials Market Revenues & Volume By Others for the Period 2022-2032F
- Historical Data and Forecast of Australia Smart Nanomaterials Market Revenues & Volume By Industry Downstream for the Period 2022-2032F
- Historical Data and Forecast of Australia Smart Nanomaterials Market Revenues & Volume By Pharmaceuticals for the Period 2022-2032F
- Historical Data and Forecast of Australia Smart Nanomaterials Market Revenues & Volume By Electronics for the Period 2022-2032F
- Historical Data and Forecast of Australia Smart Nanomaterials Market Revenues & Volume By Consumer Goods for the Period 2022-2032F
- Historical Data and Forecast of Australia Smart Nanomaterials Market Revenues & Volume By Construction for the Period 2022-2032F
- Historical Data and Forecast of Australia Smart Nanomaterials Market Revenues & Volume By Transportation for the Period 2022-2032F
- Historical Data and Forecast of Australia Smart Nanomaterials Market Revenues & Volume By Others for the Period 2022-2032F
- Australia Smart Nanomaterials Import Export Trade Statistics
- Market Opportunity Assessment By Type
- Market Opportunity Assessment By Industry Downstream
- Australia Smart Nanomaterials Top Companies Market Share
- Australia Smart Nanomaterials Competitive Benchmarking By Technical and Operational Parameters
- Australia Smart Nanomaterials Company Profiles
- Australia Smart Nanomaterials Key Strategic Recommendations
Australia Smart Nanomaterials Market - Frequently Asked Questions
The market is primarily driven by advancements in nanotechnology and increasing demand for materials with enhanced properties in healthcare, electronics, and manufacturing. Government initiatives promoting research and development further support this growth.
The market was estimated at USD 384 Million in 2025 and is projected to reach USD 501 Million by 2032, with a CAGR of 3.9% from 2026 to 2032.
Key sectors include healthcare for drug delivery systems, electronics for improved conductivity, and manufacturing for enhanced material properties, all seeking to increase efficiency and performance.
Limited awareness and understanding of nanotechnology among potential users presents a significant challenge. Regulatory concerns regarding safety and environmental impact also need to be addressed to facilitate wider adoption.
The government is actively promoting innovation through funding, tax incentives, and collaborations that support research and development in the field of smart nanomaterials, facilitating market growth.
Technological advancements are expanding the applications of smart nanomaterials, particularly in sustainable products and innovative manufacturing processes, which are likely to drive market growth in the coming years.
6Wresearch actively monitors the Australia Smart Nanomaterials Market and publishes its comprehensive annual report, highlighting emerging trends, growth drivers, revenue analysis, and forecast outlook. Our insights help businesses to make data-backed strategic decisions with ongoing market dynamics. Our analysts track relevent industries related to the Australia Smart Nanomaterials Market, allowing our clients with actionable intelligence and reliable forecasts tailored to emerging regional needs.
Yes, we provide customisation as per your requirements. To learn more, feel free to contact us on sales@6wresearch.com
1 Executive Summary |
2 Introduction |
2.1 Key Highlights of the Report |
2.2 Report Description |
2.3 Market Scope & Segmentation |
2.4 Research Methodology |
2.5 Assumptions |
3 Australia Smart Nanomaterials Market Overview |
3.1 Australia Country Macro Economic Indicators |
3.2 Australia Smart Nanomaterials Market Revenues & Volume, 2022 & 2032F |
3.3 Australia Smart Nanomaterials Market - Industry Life Cycle |
3.4 Australia Smart Nanomaterials Market - Porter's Five Forces |
3.5 Australia Smart Nanomaterials Market Revenues & Volume Share, By Type, 2022 & 2032F |
3.6 Australia Smart Nanomaterials Market Revenues & Volume Share, By Industry Downstream, 2022 & 2032F |
4 Australia Smart Nanomaterials Market Dynamics |
4.1 Impact Analysis |
4.2 Market Drivers |
4.2.1 Increasing demand for advanced technologies in various industries |
4.2.2 Growing government support and investments in research and development of nanomaterials |
4.2.3 Rising focus on sustainability and environmental concerns driving the adoption of smart nanomaterials |
4.3 Market Restraints |
4.3.1 High costs associated with the production and commercialization of smart nanomaterials |
4.3.2 Regulatory challenges and uncertainties regarding the safety and disposal of nanomaterials |
4.3.3 Lack of standardized testing methods and quality control measures for smart nanomaterials |
5 Australia Smart Nanomaterials Market Trends |
6 Australia Smart Nanomaterials Market, By Types |
6.1 Australia Smart Nanomaterials Market, By Type |
6.1.1 Overview and Analysis |
6.1.2 Australia Smart Nanomaterials Market Revenues & Volume, By Type, 2022-2032F |
6.1.3 Australia Smart Nanomaterials Market Revenues & Volume, By Metal-Based, 2022-2032F |
6.1.4 Australia Smart Nanomaterials Market Revenues & Volume, By Carbon Based, 2022-2032F |
6.1.5 Australia Smart Nanomaterials Market Revenues & Volume, By Polymeric, 2022-2032F |
6.1.6 Australia Smart Nanomaterials Market Revenues & Volume, By Others, 2022-2032F |
6.2 Australia Smart Nanomaterials Market, By Industry Downstream |
6.2.1 Overview and Analysis |
6.2.2 Australia Smart Nanomaterials Market Revenues & Volume, By Pharmaceuticals, 2022-2032F |
6.2.3 Australia Smart Nanomaterials Market Revenues & Volume, By Electronics, 2022-2032F |
6.2.4 Australia Smart Nanomaterials Market Revenues & Volume, By Consumer Goods, 2022-2032F |
6.2.5 Australia Smart Nanomaterials Market Revenues & Volume, By Construction, 2022-2032F |
6.2.6 Australia Smart Nanomaterials Market Revenues & Volume, By Transportation, 2022-2032F |
6.2.7 Australia Smart Nanomaterials Market Revenues & Volume, By Others, 2022-2032F |
7 Australia Smart Nanomaterials Market Import-Export Trade Statistics |
7.1 Australia Smart Nanomaterials Market Export to Major Countries |
7.2 Australia Smart Nanomaterials Market Imports from Major Countries |
8 Australia Smart Nanomaterials Market Key Performance Indicators |
8.1 Research and development investment in smart nanomaterials technology |
8.2 Number of patents filed for smart nanomaterial innovations |
8.3 Adoption rate of smart nanomaterials in key industries |
8.4 Environmental impact assessments of smart nanomaterial applications |
9 Australia Smart Nanomaterials Market - Opportunity Assessment |
9.1 Australia Smart Nanomaterials Market Opportunity Assessment, By Type, 2022 & 2032F |
9.2 Australia Smart Nanomaterials Market Opportunity Assessment, By Industry Downstream, 2022 & 2032F |
10 Australia Smart Nanomaterials Market - Competitive Landscape |
10.1 Australia Smart Nanomaterials Market Revenue Share, By Companies, 2025 |
10.2 Australia Smart Nanomaterials Market Competitive Benchmarking, By Operating and Technical Parameters |
11 Company Profiles |
12 Recommendations |
13 Disclaimer |
Global Go To Market Strategy - 2030
Export potential enables firms to identify high-growth global markets with greater confidence by combining advanced trade intelligence with a structured quantitative methodology. The framework analyzes emerging demand trends and country-level import patterns while integrating macroeconomic and trade datasets such as GDP and population forecasts, bilateral import–export flows, tariff structures, elasticity differentials between developed and developing economies, geographic distance, and import demand projections. Using weighted trade values from 2020–2024 as the base period to project country-to-country export potential for 2030, these inputs are operationalized through calculated drivers such as gravity model parameters, tariff impact factors, and projected GDP per-capita growth. Through an analysis of hidden potentials, demand hotspots, and market conditions that are most favorable to success, this method enables firms to focus on target countries, maximize returns, and global expansion with data, backed by accuracy.
By factoring in the projected importer demand gap that is currently unmet and could be potential opportunity, it identifies the potential for the Exporter (Country) among 190 countries, against the general trade analysis, which identifies the biggest importer or exporter.
To discover high-growth global markets and optimize your business strategy:
Click Here
Pricing
- Single User License$ 1,995
- Department License$ 2,400
- Site License$ 3,120
- Global License$ 3,795

Leadership Perspectives from Industry Events
Search
Thought Leadership and Analyst Meet


Our Clients
6WResearch In News
- India Air Conditioner Market Set for Strong Rebound in 2026 After Weather-Led Correction and GST-Driven Recovery: 6Wresearch
- ADAS in India: How Automatic Emergency Braking, Blind Spot Detection & Driver Monitoring are Transforming Road Safety
- Doha a strategic location for EV manufacturing hub: IPA Qatar
- Demand for luxury TVs surging in the GCC, says Samsung
- Empowering Growth: The Thriving Journey of Bangladesh’s Cable Industry
- Demand for luxury TVs surging in the GCC, says Samsung
Latest Reports
- Nicaragua RPG Gaming Market (2026-2032)
- New Zealand RPG Gaming Market (2026-2032)
- Netherlands RPG Gaming Market (2026-2032)
- Nauru RPG Gaming Market (2026-2032)
- Namibia RPG Gaming Market (2026-2032)
- Mozambique RPG Gaming Market (2026-2032)
- Montenegro RPG Gaming Market (2026-2032)
- Mongolia RPG Gaming Market (2026-2032)
- Monaco RPG Gaming Market (2026-2032)
- Micronesia RPG Gaming Market (2026-2032)
Industry Events and Analyst Meet

EV India Expo 2026

HIMTEX 2026

India Refining Summit 2026

India EV Show 2026

EV tech India Expo 2026
Whitepaper
- Middle East & Africa Commercial Security Market Click here to view more.
- Middle East & Africa Fire Safety Systems & Equipment Market Click here to view more.
- GCC Drone Market Click here to view more.
- Middle East Lighting Fixture Market Click here to view more.
- GCC Physical & Perimeter Security Market Click here to view more.