Australia Smart Stickers-Labels Market (2026-2032) | Competitive Landscape, Trends, Segmentation, Outlook, Companies, Forecast, Growth, Industry, Size & Revenue, Share, Value, Analysis
Market Forecast By Technology (Electronic article surveillance labels (EAS), RFID labels, Sensing labels, Electronic shelf/dynamic display labels, Near field communication (NFC) tags), By Component (Intotransceivers, Memories, Batteries, Microprocessors, Others), By Application (Retail inventory, Perishable goods, Electronic and IT assets, Pallets tracking, Equipment, Others), By End user (Food and beverages, Healthcare, Fast-moving consumer goods (FMCG), Automotive, Manufacturing, retail, Logistics, Others) And Competitive Landscape
| Product Code: ETC6191313 | Publication Date: Sep 2024 | Updated Date: Mar 2026 | Product Type: Market Research Report | |
| Publisher: 6Wresearch | Author: Bhawna Singh | No. of Pages: 75 | No. of Figures: 35 | No. of Tables: 20 |
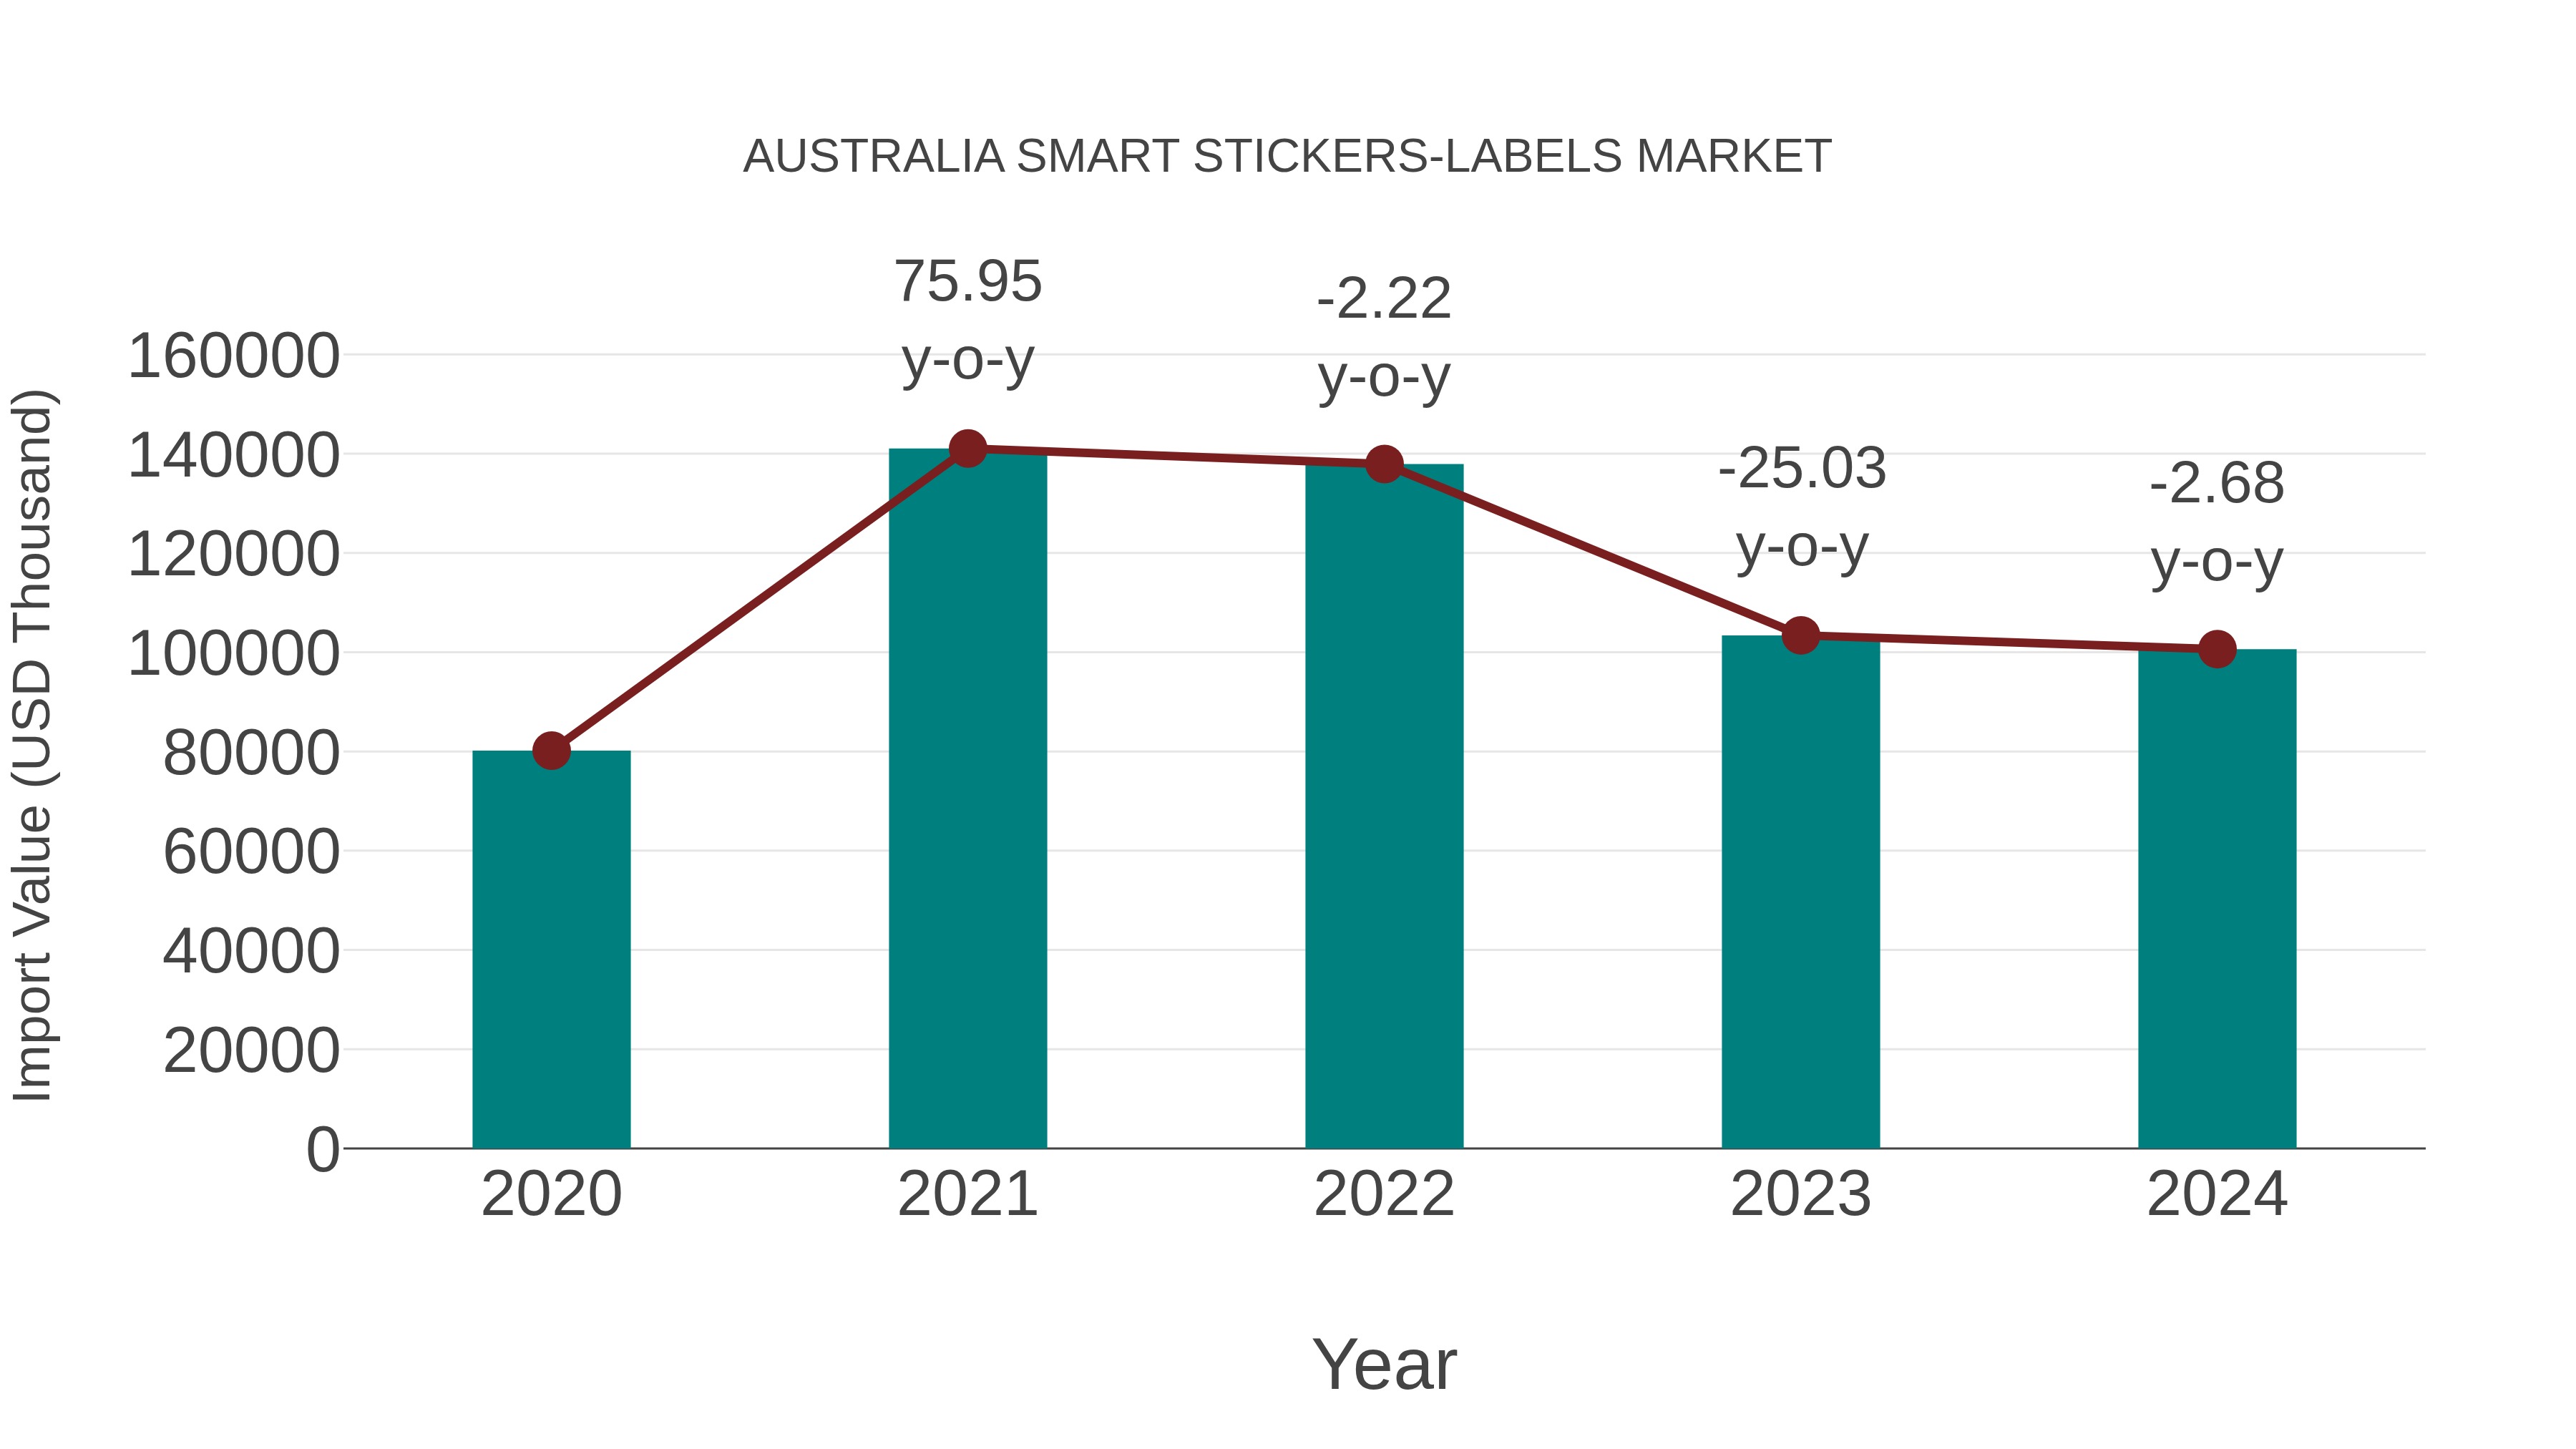
Australia Smart Stickers-labels Market: Import Trend Analysis
In the Australia smart stickers-labels market, the import trend experienced a slight decline from 2023 to 2024, with a growth rate of -2.68%. However, the compound annual growth rate (CAGR) from 2020 to 2024 stood at a healthy 5.85%. This dip in import momentum could be attributed to shifting demand patterns or fluctuations in the market`s stability during that period.
Australia Smart Stickers Labels Market Overview
The Australia smart stickers labels market is evolving as consumers and businesses look for innovative ways to enhance product labeling and tracking. These smart labels, equipped with NFC, RFID, or QR code technology, offer features such as real-time tracking, authentication, and customer interaction. Used across a wide range of industries, from retail to logistics, smart stickers enable businesses to streamline operations, improve inventory management, and offer interactive experiences for consumers. With the growing interest in automation and digital solutions, the market for smart stickers and labels is poised to expand in Australia.
Trends of the market
The Australia Smart Stickers Labels Market is experiencing growth due to the increasing demand for efficient inventory management and traceability solutions across various industries, including retail and logistics. Smart labels, often integrated with RFID (Radio Frequency Identification) or NFC (Near Field Communication) technology, are gaining popularity because they allow for real-time tracking and enhanced product information. The retail sector, in particular, is adopting smart labels for better customer engagement and seamless shopping experiences. The growing interest in supply chain transparency and automation is also fueling the market`s expansion.
Challenges of the market
In the Australia Smart Stickers Labels Market, challenges include the integration of smart labels with existing systems and the relatively high cost of production. Smart labels require advanced RFID or NFC technology, which can be expensive to produce on a large scale, limiting their affordability for small and medium-sized businesses. Furthermore, the market faces issues with compatibility and scalability, as not all industries or retailers are ready to adopt this technology. Another challenge is the short lifespan of the sensors in some smart labels, which can reduce their effectiveness over time and lead to additional costs for replacement and maintenance.
Investment opportunities in the Market
The Australia government has been encouraging investment in sectors involving smart packaging technologies, including smart sticker labels, through incentives for green technology innovation. The policy support focuses on the use of smart labels for tracking, authentication, and data gathering, especially in logistics, retail, and food safety sectors. The policies also foster collaboration between industries, researchers, and tech developers to drive advancements in smart labeling solutions.
Government Policy of the market
The Australia government has introduced policies focused on smart packaging under the Product Stewardship Act and waste reduction initiatives. Support for RFID and IoT-enabled labels comes through grants for digital transformation and sustainability, with the National Science and Innovation Agenda promoting the commercialization of smart packaging solutions.
Key Highlights of the Report:
- Australia Smart Stickers-Labels Market Outlook
- Market Size of Australia Smart Stickers-Labels Market, 2025
- Forecast of Australia Smart Stickers-Labels Market, 2032
- Historical Data and Forecast of Australia Smart Stickers-Labels Revenues & Volume for the Period 2022 - 2032F
- Australia Smart Stickers-Labels Market Trend Evolution
- Australia Smart Stickers-Labels Market Drivers and Challenges
- Australia Smart Stickers-Labels Price Trends
- Australia Smart Stickers-Labels Porter's Five Forces
- Australia Smart Stickers-Labels Industry Life Cycle
- Historical Data and Forecast of Australia Smart Stickers-Labels Market Revenues & Volume By Technology for the Period 2022 - 2032F
- Historical Data and Forecast of Australia Smart Stickers-Labels Market Revenues & Volume By Electronic article surveillance labels (EAS) for the Period 2022 - 2032F
- Historical Data and Forecast of Australia Smart Stickers-Labels Market Revenues & Volume By RFID labels for the Period 2022 - 2032F
- Historical Data and Forecast of Australia Smart Stickers-Labels Market Revenues & Volume By Sensing labels for the Period 2022 - 2032F
- Historical Data and Forecast of Australia Smart Stickers-Labels Market Revenues & Volume By Electronic shelf/dynamic display labels for the Period 2022 - 2032F
- Historical Data and Forecast of Australia Smart Stickers-Labels Market Revenues & Volume By Near field communication (NFC) tags for the Period 2022 - 2032F
- Historical Data and Forecast of Australia Smart Stickers-Labels Market Revenues & Volume By Component for the Period 2022 - 2032F
- Historical Data and Forecast of Australia Smart Stickers-Labels Market Revenues & Volume By Intotransceivers for the Period 2022 - 2032F
- Historical Data and Forecast of Australia Smart Stickers-Labels Market Revenues & Volume By Memories for the Period 2022 - 2032F
- Historical Data and Forecast of Australia Smart Stickers-Labels Market Revenues & Volume By Batteries for the Period 2022 - 2032F
- Historical Data and Forecast of Australia Smart Stickers-Labels Market Revenues & Volume By Microprocessors for the Period 2022 - 2032F
- Historical Data and Forecast of Australia Smart Stickers-Labels Market Revenues & Volume By Others for the Period 2022 - 2032F
- Historical Data and Forecast of Australia Smart Stickers-Labels Market Revenues & Volume By Application for the Period 2022 - 2032F
- Historical Data and Forecast of Australia Smart Stickers-Labels Market Revenues & Volume By Retail inventory for the Period 2022 - 2032F
- Historical Data and Forecast of Australia Smart Stickers-Labels Market Revenues & Volume By Perishable goods for the Period 2022 - 2032F
- Historical Data and Forecast of Australia Smart Stickers-Labels Market Revenues & Volume By Electronic and IT assets for the Period 2022 - 2032F
- Historical Data and Forecast of Australia Smart Stickers-Labels Market Revenues & Volume By Pallets tracking for the Period 2022 - 2032F
- Historical Data and Forecast of Australia Smart Stickers-Labels Market Revenues & Volume By Equipment for the Period 2022 - 2032F
- Historical Data and Forecast of Australia Smart Stickers-Labels Market Revenues & Volume By Others for the Period 2022 - 2032F
- Historical Data and Forecast of Australia Smart Stickers-Labels Market Revenues & Volume By End user for the Period 2022 - 2032F
- Historical Data and Forecast of Australia Smart Stickers-Labels Market Revenues & Volume By Food and beverages for the Period 2022 - 2032F
- Historical Data and Forecast of Australia Smart Stickers-Labels Market Revenues & Volume By Healthcare for the Period 2022 - 2032F
- Historical Data and Forecast of Australia Smart Stickers-Labels Market Revenues & Volume By Fast-moving consumer goods (FMCG) for the Period 2022 - 2032F
- Historical Data and Forecast of Australia Smart Stickers-Labels Market Revenues & Volume By Automotive for the Period 2022 - 2032F
- Historical Data and Forecast of Australia Smart Stickers-Labels Market Revenues & Volume By Manufacturing, retail for the Period 2022 - 2032F
- Historical Data and Forecast of Australia Smart Stickers-Labels Market Revenues & Volume By Logistics for the Period 2022 - 2032F
- Historical Data and Forecast of Australia Smart Stickers-Labels Market Revenues & Volume By Others for the Period 2022 - 2032F
- Australia Smart Stickers-Labels Import Export Trade Statistics
- Market Opportunity Assessment By Technology
- Market Opportunity Assessment By Component
- Market Opportunity Assessment By Application
- Market Opportunity Assessment By End user
- Australia Smart Stickers-Labels Top Companies Market Share
- Australia Smart Stickers-Labels Competitive Benchmarking By Technical and Operational Parameters
- Australia Smart Stickers-Labels Company Profiles
- Australia Smart Stickers-Labels Key Strategic Recommendations
Australia Smart Stickers-Labels Market (2026-2032): FAQs
6Wresearch actively monitors the Australia Smart Stickers-Labels Market and publishes its comprehensive annual report, highlighting emerging trends, growth drivers, revenue analysis, and forecast outlook. Our insights help businesses to make data-backed strategic decisions with ongoing market dynamics. Our analysts track relevent industries related to the Australia Smart Stickers-Labels Market, allowing our clients with actionable intelligence and reliable forecasts tailored to emerging regional needs.
Yes, we provide customisation as per your requirements. To learn more, feel free to contact us on sales@6wresearch.com
1 Executive Summary |
2 Introduction |
2.1 Key Highlights of the Report |
2.2 Report Description |
2.3 Market Scope & Segmentation |
2.4 Research Methodology |
2.5 Assumptions |
3 Australia Smart Stickers-Labels Market Overview |
3.1 Australia Country Macro Economic Indicators |
3.2 Australia Smart Stickers-Labels Market Revenues & Volume, 2022 & 2032F |
3.3 Australia Smart Stickers-Labels Market - Industry Life Cycle |
3.4 Australia Smart Stickers-Labels Market - Porter's Five Forces |
3.5 Australia Smart Stickers-Labels Market Revenues & Volume Share, By Technology, 2022 & 2032F |
3.6 Australia Smart Stickers-Labels Market Revenues & Volume Share, By Component, 2022 & 2032F |
3.7 Australia Smart Stickers-Labels Market Revenues & Volume Share, By Application, 2022 & 2032F |
3.8 Australia Smart Stickers-Labels Market Revenues & Volume Share, By End user, 2022 & 2032F |
4 Australia Smart Stickers-Labels Market Dynamics |
4.1 Impact Analysis |
4.2 Market Drivers |
4.2.1 Increasing demand for smart packaging solutions in the Australian market |
4.2.2 Growing emphasis on product authentication and anti-counterfeiting measures |
4.2.3 Technological advancements in RFID and NFC technologies |
4.3 Market Restraints |
4.3.1 High initial investment costs associated with smart stickers-labels implementation |
4.3.2 Concerns regarding data security and privacy issues |
4.3.3 Lack of standardized regulations and guidelines for smart packaging solutions in Australia |
5 Australia Smart Stickers-Labels Market Trends |
6 Australia Smart Stickers-Labels Market, By Types |
6.1 Australia Smart Stickers-Labels Market, By Technology |
6.1.1 Overview and Analysis |
6.1.2 Australia Smart Stickers-Labels Market Revenues & Volume, By Technology, 2022 - 2032F |
6.1.3 Australia Smart Stickers-Labels Market Revenues & Volume, By Electronic article surveillance labels (EAS), 2022 - 2032F |
6.1.4 Australia Smart Stickers-Labels Market Revenues & Volume, By RFID labels, 2022 - 2032F |
6.1.5 Australia Smart Stickers-Labels Market Revenues & Volume, By Sensing labels, 2022 - 2032F |
6.1.6 Australia Smart Stickers-Labels Market Revenues & Volume, By Electronic shelf/dynamic display labels, 2022 - 2032F |
6.1.7 Australia Smart Stickers-Labels Market Revenues & Volume, By Near field communication (NFC) tags, 2022 - 2032F |
6.2 Australia Smart Stickers-Labels Market, By Component |
6.2.1 Overview and Analysis |
6.2.2 Australia Smart Stickers-Labels Market Revenues & Volume, By Intotransceivers, 2022 - 2032F |
6.2.3 Australia Smart Stickers-Labels Market Revenues & Volume, By Memories, 2022 - 2032F |
6.2.4 Australia Smart Stickers-Labels Market Revenues & Volume, By Batteries, 2022 - 2032F |
6.2.5 Australia Smart Stickers-Labels Market Revenues & Volume, By Microprocessors, 2022 - 2032F |
6.2.6 Australia Smart Stickers-Labels Market Revenues & Volume, By Others, 2022 - 2032F |
6.3 Australia Smart Stickers-Labels Market, By Application |
6.3.1 Overview and Analysis |
6.3.2 Australia Smart Stickers-Labels Market Revenues & Volume, By Retail inventory, 2022 - 2032F |
6.3.3 Australia Smart Stickers-Labels Market Revenues & Volume, By Perishable goods, 2022 - 2032F |
6.3.4 Australia Smart Stickers-Labels Market Revenues & Volume, By Electronic and IT assets, 2022 - 2032F |
6.3.5 Australia Smart Stickers-Labels Market Revenues & Volume, By Pallets tracking, 2022 - 2032F |
6.3.6 Australia Smart Stickers-Labels Market Revenues & Volume, By Equipment, 2022 - 2032F |
6.3.7 Australia Smart Stickers-Labels Market Revenues & Volume, By Others, 2022 - 2032F |
6.4 Australia Smart Stickers-Labels Market, By End user |
6.4.1 Overview and Analysis |
6.4.2 Australia Smart Stickers-Labels Market Revenues & Volume, By Food and beverages, 2022 - 2032F |
6.4.3 Australia Smart Stickers-Labels Market Revenues & Volume, By Healthcare, 2022 - 2032F |
6.4.4 Australia Smart Stickers-Labels Market Revenues & Volume, By Fast-moving consumer goods (FMCG), 2022 - 2032F |
6.4.5 Australia Smart Stickers-Labels Market Revenues & Volume, By Automotive, 2022 - 2032F |
6.4.6 Australia Smart Stickers-Labels Market Revenues & Volume, By Manufacturing, retail, 2022 - 2032F |
6.4.7 Australia Smart Stickers-Labels Market Revenues & Volume, By Logistics, 2022 - 2032F |
7 Australia Smart Stickers-Labels Market Import-Export Trade Statistics |
7.1 Australia Smart Stickers-Labels Market Export to Major Countries |
7.2 Australia Smart Stickers-Labels Market Imports from Major Countries |
8 Australia Smart Stickers-Labels Market Key Performance Indicators |
8.1 Adoption rate of smart stickers-labels by Australian businesses |
8.2 Percentage increase in the use of RFID and NFC technologies in packaging |
8.3 Number of partnerships and collaborations between technology providers and packaging companies in Australia |
9 Australia Smart Stickers-Labels Market - Opportunity Assessment |
9.1 Australia Smart Stickers-Labels Market Opportunity Assessment, By Technology, 2022 & 2032F |
9.2 Australia Smart Stickers-Labels Market Opportunity Assessment, By Component, 2022 & 2032F |
9.3 Australia Smart Stickers-Labels Market Opportunity Assessment, By Application, 2022 & 2032F |
9.4 Australia Smart Stickers-Labels Market Opportunity Assessment, By End user, 2022 & 2032F |
10 Australia Smart Stickers-Labels Market - Competitive Landscape |
10.1 Australia Smart Stickers-Labels Market Revenue Share, By Companies, 2025 |
10.2 Australia Smart Stickers-Labels Market Competitive Benchmarking, By Operating and Technical Parameters |
11 Company Profiles |
12 Recommendations |
13 Disclaimer |
Export potential assessment - trade Analytics for 2030
Export potential enables firms to identify high-growth global markets with greater confidence by combining advanced trade intelligence with a structured quantitative methodology. The framework analyzes emerging demand trends and country-level import patterns while integrating macroeconomic and trade datasets such as GDP and population forecasts, bilateral import–export flows, tariff structures, elasticity differentials between developed and developing economies, geographic distance, and import demand projections. Using weighted trade values from 2020–2024 as the base period to project country-to-country export potential for 2030, these inputs are operationalized through calculated drivers such as gravity model parameters, tariff impact factors, and projected GDP per-capita growth. Through an analysis of hidden potentials, demand hotspots, and market conditions that are most favorable to success, this method enables firms to focus on target countries, maximize returns, and global expansion with data, backed by accuracy.
By factoring in the projected importer demand gap that is currently unmet and could be potential opportunity, it identifies the potential for the Exporter (Country) among 190 countries, against the general trade analysis, which identifies the biggest importer or exporter.
To discover high-growth global markets and optimize your business strategy:
Click Here
Pricing
- Single User License$ 1,995
- Department License$ 2,400
- Site License$ 3,120
- Global License$ 3,795

Search
Thought Leadership and Analyst Meet


Our Clients
Latest Reports
- Canada Cloud CFD Market (2026-2032) | Size & Revenue, Industry, Growth, Competitive Landscape, Forecast, Segmentation, Value, Outlook, Trends, Share, Analysis, Companies
- Taiwan Food Delivery Platform Market (2026-2032) | Companies, Outlook, Analysis, Trends, Value, Revenue, Segmentation, Share, Forecast, Competitive Landscape, Growth, Size & Forecast
- United Kingdom (UK) Long-term Care Insurance Market (2026-2032) | Growth, Share, Consumer Insights, Drivers, Opportunities, Competition, Pricing Analysis, Segments, Restraints, Companies, Competitive, Value, Outlook, Size, Demand, Analysis, Challenges, Strategic Insights, Investment Trends, Revenue, Trends, Supply, Forecast
- United Kingdom (UK) Long Term Care Market (2026-2032) | Companies, Outlook, Analysis, Trends, Value, Revenue, Segmentation, Share, Forecast, Competitive Landscape, Growth, Size & Forecast
- Iraq Insulation and Waterproofing Market (2026-2032) | Outlook, Drivers, Growth, Size, Share, Industry, Revenue, Trends, Demand, Competitive, Strategic Insights, Opportunities, Segments, Companies, Challenges, Strategy, Consumer Insights, Analysis, Investment Trends, Value, Segmentation, Forecast, Restraints
- India Switchgear Market Outlook (2026-2032) | Size, Share, Trends, Growth, Revenue, Forecast, Analysis, Value, Outlook
- Pakistan Contraceptive Implants Market (2025-2031) | Demand, Growth, Size, Share, Industry, Pricing Analysis, Competitive, Strategic Insights, Strategy, Consumer Insights, Analysis, Investment Trends, Opportunities, Revenue, Segments, Value, Segmentation, Supply, Forecast, Restraints, Outlook, Competition, Drivers, Trends, Companies, Challenges
- Sri Lanka Packaging Market (2026-2032) | Outlook, Competition, Drivers, Trends, Demand, Pricing Analysis, Competitive, Strategic Insights, Companies, Challenges, Strategy, Consumer Insights, Analysis, Investment Trends, Opportunities, Growth, Size, Share, Industry, Revenue, Segments, Value, Segmentation, Supply, Forecast, Restraints
- India Kids Watches Market (2026-2032) | Strategy, Consumer Insights, Analysis, Investment Trends, Opportunities, Growth, Size, Share, Industry, Revenue, Segments, Value, Segmentation, Supply, Forecast, Restraints, Outlook, Competition, Drivers, Trends, Demand, Pricing Analysis, Competitive, Strategic Insights, Companies, Challenges
- Saudi Arabia Core Assurance Service Market (2025-2031) | Strategy, Consumer Insights, Analysis, Investment Trends, Opportunities, Growth, Size, Share, Industry, Revenue, Segments, Value, Segmentation, Supply, Forecast, Restraints, Outlook, Competition, Drivers, Trends, Demand, Pricing Analysis, Competitive, Strategic Insights, Companies, Challenges
Industry Events and Analyst Meet

India EV Show 2026

EV tech India Expo 2026

Auto Tech Asia 2026

Battery Tech India 2026

Smart Production Solutions Guangzhou 2026
Whitepaper
- Middle East & Africa Commercial Security Market Click here to view more.
- Middle East & Africa Fire Safety Systems & Equipment Market Click here to view more.
- GCC Drone Market Click here to view more.
- Middle East Lighting Fixture Market Click here to view more.
- GCC Physical & Perimeter Security Market Click here to view more.
6WResearch In News
- Doha a strategic location for EV manufacturing hub: IPA Qatar
- Demand for luxury TVs surging in the GCC, says Samsung
- Empowering Growth: The Thriving Journey of Bangladesh’s Cable Industry
- Demand for luxury TVs surging in the GCC, says Samsung
- Video call with a traditional healer? Once unthinkable, it’s now common in South Africa
- Intelligent Buildings To Smooth GCC’s Path To Net Zero