Australia Soft Drink Concentrates Market (2026-2032) Outlook | Analysis, Companies, Revenue, Share, Trends, Value, Growth, Industry, Size, Forecast
Market Forecast By Application (Carbonated, Non-Carbonated), By End Use (Mass Merchandise, Food Service, Fountain Machine) And Competitive Landscape
| Product Code: ETC4541256 | Publication Date: Jul 2023 | Updated Date: Mar 2026 | Product Type: Report | |
| Publisher: 6Wresearch | Author: Summon Dutta | No. of Pages: 85 | No. of Figures: 45 | No. of Tables: 25 |
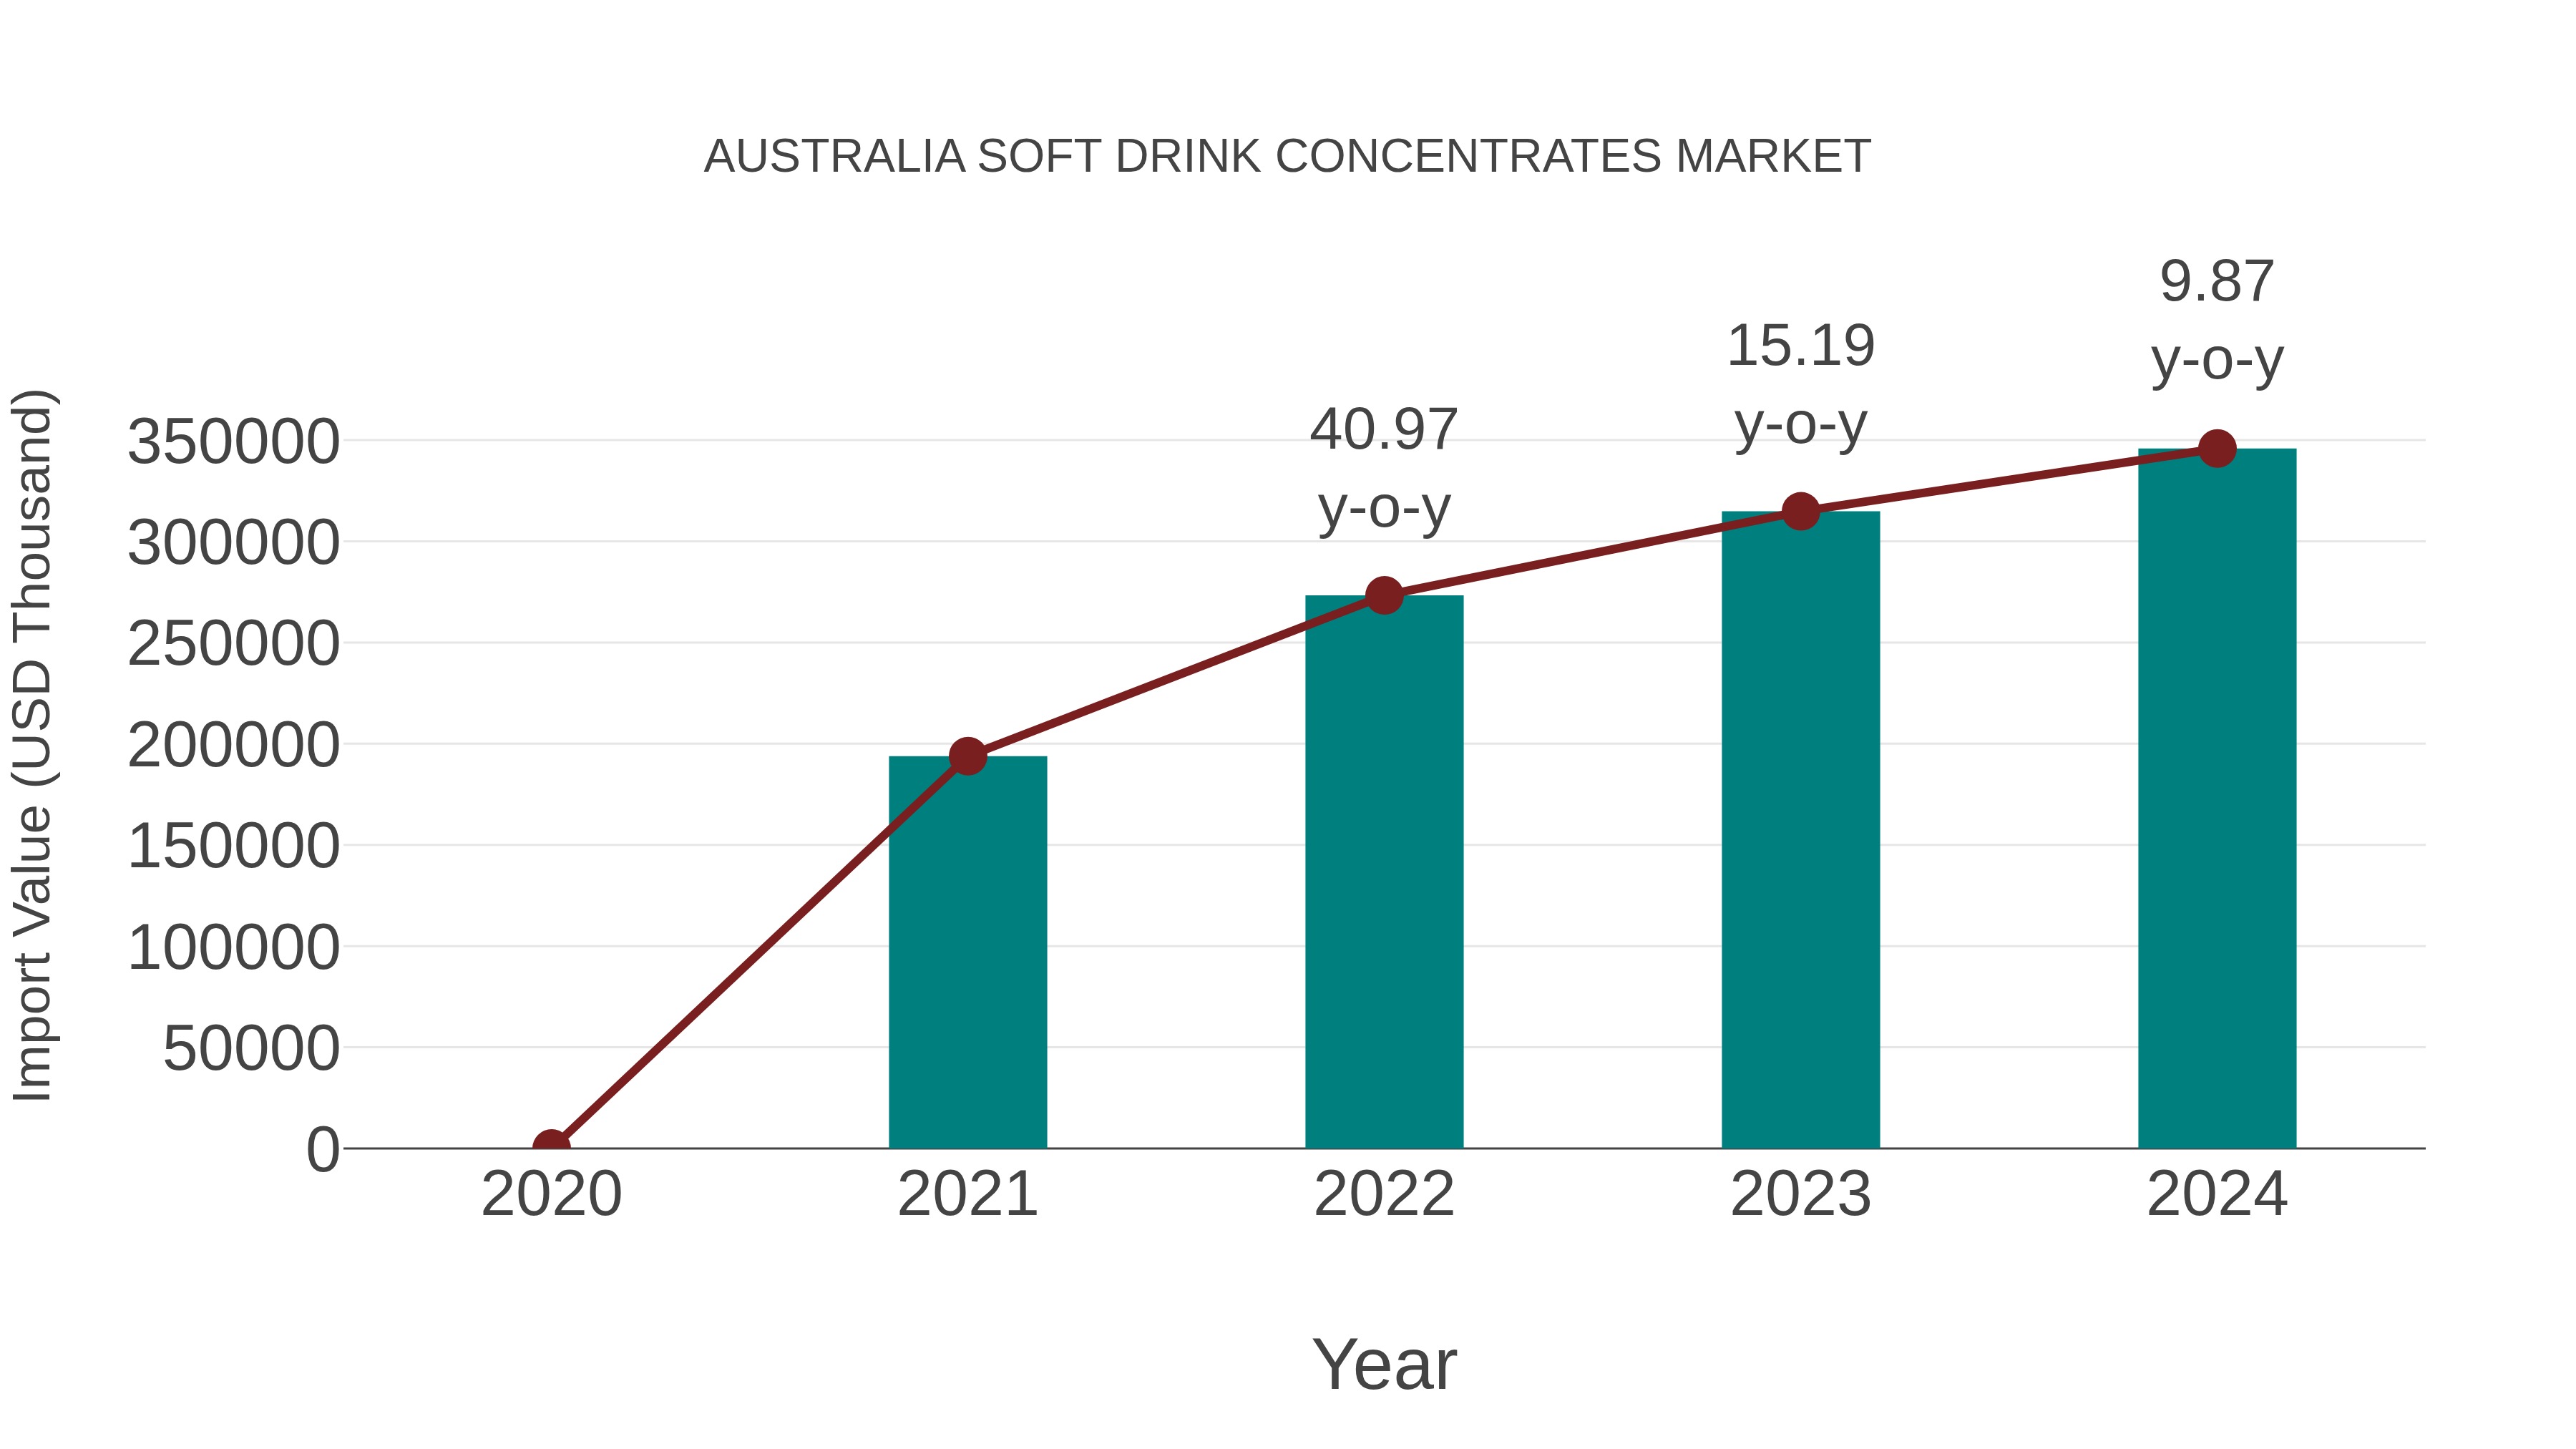
Australia Soft Drink Concentrates Market: Import Trend Analysis
In the Australia soft drink concentrates market, the import trend showcased a notable growth rate of 9.87% from 2023 to 2024. The compound annual growth rate (CAGR) for the period of 2020 to 2024 stood at 21.29%. This significant increase in import momentum can be attributed to shifting consumer preferences towards convenience and variety, driving demand for a diverse range of soft drink concentrates.
Australia Soft Drink Concentrates Market Overview
The Australia soft drink concentrates market has seen significant growth in recent years due to the increasing demand for ready-to-drink beverages. Concentrates offer convenience and cost-effectiveness to both manufacturers and consumers. With consumers becoming more health-conscious, there`s a rising demand for natural and low-sugar concentrate variants, prompting manufacturers to innovate in this segment. Moreover, the market is witnessing a shift towards eco-friendly packaging solutions to address environmental concerns.
Drivers of the market
The Australia soft drink concentrates market is primarily driven by the increasing demand for convenience and ready-to-drink beverages among consumers. Concentrates offer a cost-effective solution for both manufacturers and consumers, as they are easier to transport and store compared to ready-to-drink beverages. Moreover, the growing trend towards healthier lifestyles has led to a surge in demand for low-sugar or sugar-free soft drink options, which can be achieved through the use of concentrates.
Challenges of the market
The Australia soft drink concentrates market faces several challenges, including shifting consumer preferences towards healthier options. With increasing health consciousness, consumers are seeking beverages with lower sugar content and natural ingredients, posing a challenge for traditional soft drink manufacturers. Additionally, there`s growing concern over the environmental impact of single-use plastic packaging, prompting the industry to explore more sustainable packaging solutions. Moreover, the market is witnessing intensifying competition from alternative beverage categories such as flavored water, functional drinks, and energy drinks, which further challenges the market growth of soft drink concentrates.
Government Policy of the market
The Australia government has implemented various policies to regulate the soft drink concentrates market. These policies focus on ensuring the safety and quality of products, including regulations on ingredients, labeling requirements, and manufacturing practices. Additionally, there are initiatives aimed at promoting healthier beverage options and reducing sugar consumption among consumers.
Key Highlights of the Report:
- Australia Soft Drink Concentrates Market Outlook
- Market Size of Australia Soft Drink Concentrates Market, 2025
- Forecast of Australia Soft Drink Concentrates Market, 2032
- Historical Data and Forecast of Australia Soft Drink Concentrates Revenues & Volume for the Period 2022-2032F
- Australia Soft Drink Concentrates Market Trend Evolution
- Australia Soft Drink Concentrates Market Drivers and Challenges
- Australia Soft Drink Concentrates Price Trends
- Australia Soft Drink Concentrates Porter's Five Forces
- Australia Soft Drink Concentrates Industry Life Cycle
- Historical Data and Forecast of Australia Soft Drink Concentrates Market Revenues & Volume By Application for the Period 2022-2032F
- Historical Data and Forecast of Australia Soft Drink Concentrates Market Revenues & Volume By Carbonated for the Period 2022-2032F
- Historical Data and Forecast of Australia Soft Drink Concentrates Market Revenues & Volume By Non-Carbonated for the Period 2022-2032F
- Historical Data and Forecast of Australia Soft Drink Concentrates Market Revenues & Volume By End Use for the Period 2022-2032F
- Historical Data and Forecast of Australia Soft Drink Concentrates Market Revenues & Volume By Mass Merchandise for the Period 2022-2032F
- Historical Data and Forecast of Australia Soft Drink Concentrates Market Revenues & Volume By Food Service for the Period 2022-2032F
- Historical Data and Forecast of Australia Soft Drink Concentrates Market Revenues & Volume By Fountain Machine for the Period 2022-2032F
- Australia Soft Drink Concentrates Import Export Trade Statistics
- Market Opportunity Assessment By Application
- Market Opportunity Assessment By End Use
- Australia Soft Drink Concentrates Top Companies Market Share
- Australia Soft Drink Concentrates Competitive Benchmarking By Technical and Operational Parameters
- Australia Soft Drink Concentrates Company Profiles
- Australia Soft Drink Concentrates Key Strategic Recommendations
Australia Soft Drink Concentrates Market (2026-2032): FAQs
6Wresearch actively monitors the Australia Soft Drink Concentrates Market and publishes its comprehensive annual report, highlighting emerging trends, growth drivers, revenue analysis, and forecast outlook. Our insights help businesses to make data-backed strategic decisions with ongoing market dynamics. Our analysts track relevent industries related to the Australia Soft Drink Concentrates Market, allowing our clients with actionable intelligence and reliable forecasts tailored to emerging regional needs.
Yes, we provide customisation as per your requirements. To learn more, feel free to contact us on sales@6wresearch.com
1 Executive Summary |
2 Introduction |
2.1 Key Highlights of the Report |
2.2 Report Description |
2.3 Market Scope & Segmentation |
2.4 Research Methodology |
2.5 Assumptions |
3 Australia Soft Drink Concentrates Market Overview |
3.1 Australia Country Macro Economic Indicators |
3.2 Australia Soft Drink Concentrates Market Revenues & Volume, 2022 & 2032F |
3.3 Australia Soft Drink Concentrates Market - Industry Life Cycle |
3.4 Australia Soft Drink Concentrates Market - Porter's Five Forces |
3.5 Australia Soft Drink Concentrates Market Revenues & Volume Share, By Application, 2022 & 2032F |
3.6 Australia Soft Drink Concentrates Market Revenues & Volume Share, By End Use, 2022 & 2032F |
4 Australia Soft Drink Concentrates Market Dynamics |
4.1 Impact Analysis |
4.2 Market Drivers |
4.2.1 Increasing consumer preference for healthier beverage options |
4.2.2 Growing demand for customized and premium soft drink concentrates |
4.2.3 Rise in disposable income leading to higher spending on beverages |
4.3 Market Restraints |
4.3.1 Stringent regulations and taxes on sugary beverages |
4.3.2 Competition from ready-to-drink beverages |
4.3.3 Fluctuating prices of raw materials like sugar and fruits |
5 Australia Soft Drink Concentrates Market Trends |
6 Australia Soft Drink Concentrates Market, By Types |
6.1 Australia Soft Drink Concentrates Market, By Application |
6.1.1 Overview and Analysis |
6.1.2 Australia Soft Drink Concentrates Market Revenues & Volume, By Application, 2022-2032F |
6.1.3 Australia Soft Drink Concentrates Market Revenues & Volume, By Carbonated, 2022-2032F |
6.1.4 Australia Soft Drink Concentrates Market Revenues & Volume, By Non-Carbonated, 2022-2032F |
6.2 Australia Soft Drink Concentrates Market, By End Use |
6.2.1 Overview and Analysis |
6.2.2 Australia Soft Drink Concentrates Market Revenues & Volume, By Mass Merchandise, 2022-2032F |
6.2.3 Australia Soft Drink Concentrates Market Revenues & Volume, By Food Service, 2022-2032F |
6.2.4 Australia Soft Drink Concentrates Market Revenues & Volume, By Fountain Machine, 2022-2032F |
7 Australia Soft Drink Concentrates Market Import-Export Trade Statistics |
7.1 Australia Soft Drink Concentrates Market Export to Major Countries |
7.2 Australia Soft Drink Concentrates Market Imports from Major Countries |
8 Australia Soft Drink Concentrates Market Key Performance Indicators |
8.1 Innovation rate in product development and flavor offerings |
8.2 Adoption rate of natural and organic ingredients in soft drink concentrates |
8.3 Customer retention and repeat purchase rates |
8.4 Sustainability practices implemented in the production process |
8.5 Consumer sentiment and perception towards soft drink concentrates |
9 Australia Soft Drink Concentrates Market - Opportunity Assessment |
9.1 Australia Soft Drink Concentrates Market Opportunity Assessment, By Application, 2022 & 2032F |
9.2 Australia Soft Drink Concentrates Market Opportunity Assessment, By End Use, 2022 & 2032F |
10 Australia Soft Drink Concentrates Market - Competitive Landscape |
10.1 Australia Soft Drink Concentrates Market Revenue Share, By Companies, 2025 |
10.2 Australia Soft Drink Concentrates Market Competitive Benchmarking, By Operating and Technical Parameters |
11 Company Profiles |
12 Recommendations |
13 Disclaimer |
Global Go To Market Strategy - 2030
Export potential enables firms to identify high-growth global markets with greater confidence by combining advanced trade intelligence with a structured quantitative methodology. The framework analyzes emerging demand trends and country-level import patterns while integrating macroeconomic and trade datasets such as GDP and population forecasts, bilateral import–export flows, tariff structures, elasticity differentials between developed and developing economies, geographic distance, and import demand projections. Using weighted trade values from 2020–2024 as the base period to project country-to-country export potential for 2030, these inputs are operationalized through calculated drivers such as gravity model parameters, tariff impact factors, and projected GDP per-capita growth. Through an analysis of hidden potentials, demand hotspots, and market conditions that are most favorable to success, this method enables firms to focus on target countries, maximize returns, and global expansion with data, backed by accuracy.
By factoring in the projected importer demand gap that is currently unmet and could be potential opportunity, it identifies the potential for the Exporter (Country) among 190 countries, against the general trade analysis, which identifies the biggest importer or exporter.
To discover high-growth global markets and optimize your business strategy:
Click Here
Pricing
- Single User License$ 1,995
- Department License$ 2,400
- Site License$ 3,120
- Global License$ 3,795

Leadership Perspectives from Industry Events
Search
Thought Leadership and Analyst Meet


Our Clients
6WResearch In News
- India Export Attractiveness Tracker 2026
- India Air Conditioner Market Set for Strong Rebound in 2026 After Weather-Led Correction and GST-Driven Recovery: 6Wresearch
- ADAS in India: How Automatic Emergency Braking, Blind Spot Detection & Driver Monitoring are Transforming Road Safety
- Doha a strategic location for EV manufacturing hub: IPA Qatar
- Demand for luxury TVs surging in the GCC, says Samsung
- Empowering Growth: The Thriving Journey of Bangladesh’s Cable Industry
Latest Reports
- Nicaragua RPG Gaming Market (2026-2032)
- New Zealand RPG Gaming Market (2026-2032)
- Netherlands RPG Gaming Market (2026-2032)
- Nauru RPG Gaming Market (2026-2032)
- Namibia RPG Gaming Market (2026-2032)
- Mozambique RPG Gaming Market (2026-2032)
- Montenegro RPG Gaming Market (2026-2032)
- Mongolia RPG Gaming Market (2026-2032)
- Monaco RPG Gaming Market (2026-2032)
- Micronesia RPG Gaming Market (2026-2032)
Industry Events and Analyst Meet

EV India Expo 2026

HIMTEX 2026

India Refining Summit 2026

India EV Show 2026

EV tech India Expo 2026
Whitepaper
- Middle East & Africa Commercial Security Market Click here to view more.
- Middle East & Africa Fire Safety Systems & Equipment Market Click here to view more.
- GCC Drone Market Click here to view more.
- Middle East Lighting Fixture Market Click here to view more.
- GCC Physical & Perimeter Security Market Click here to view more.