Australia Solvent-Borne Coatings Market (2026-2032) | Size & Revenue, Trends, Competitive Landscape, Forecast, Analysis, Growth, Segmentation, Industry, Companies, Outlook, Share, Value
Market Forecast By Product Type (One Component System Solvent Borne Coatings, Two Component System Solvent Borne Coatings), By End-use (Automotive Solvent Borne Coatings, Industrial Solvent Borne Coatings, Printing Inks) And Competitive Landscape
| Product Code: ETC6191585 | Publication Date: Sep 2024 | Updated Date: Mar 2026 | Product Type: Market Research Report | |
| Publisher: 6Wresearch | Author: Bhawna Singh | No. of Pages: 75 | No. of Figures: 35 | No. of Tables: 20 |
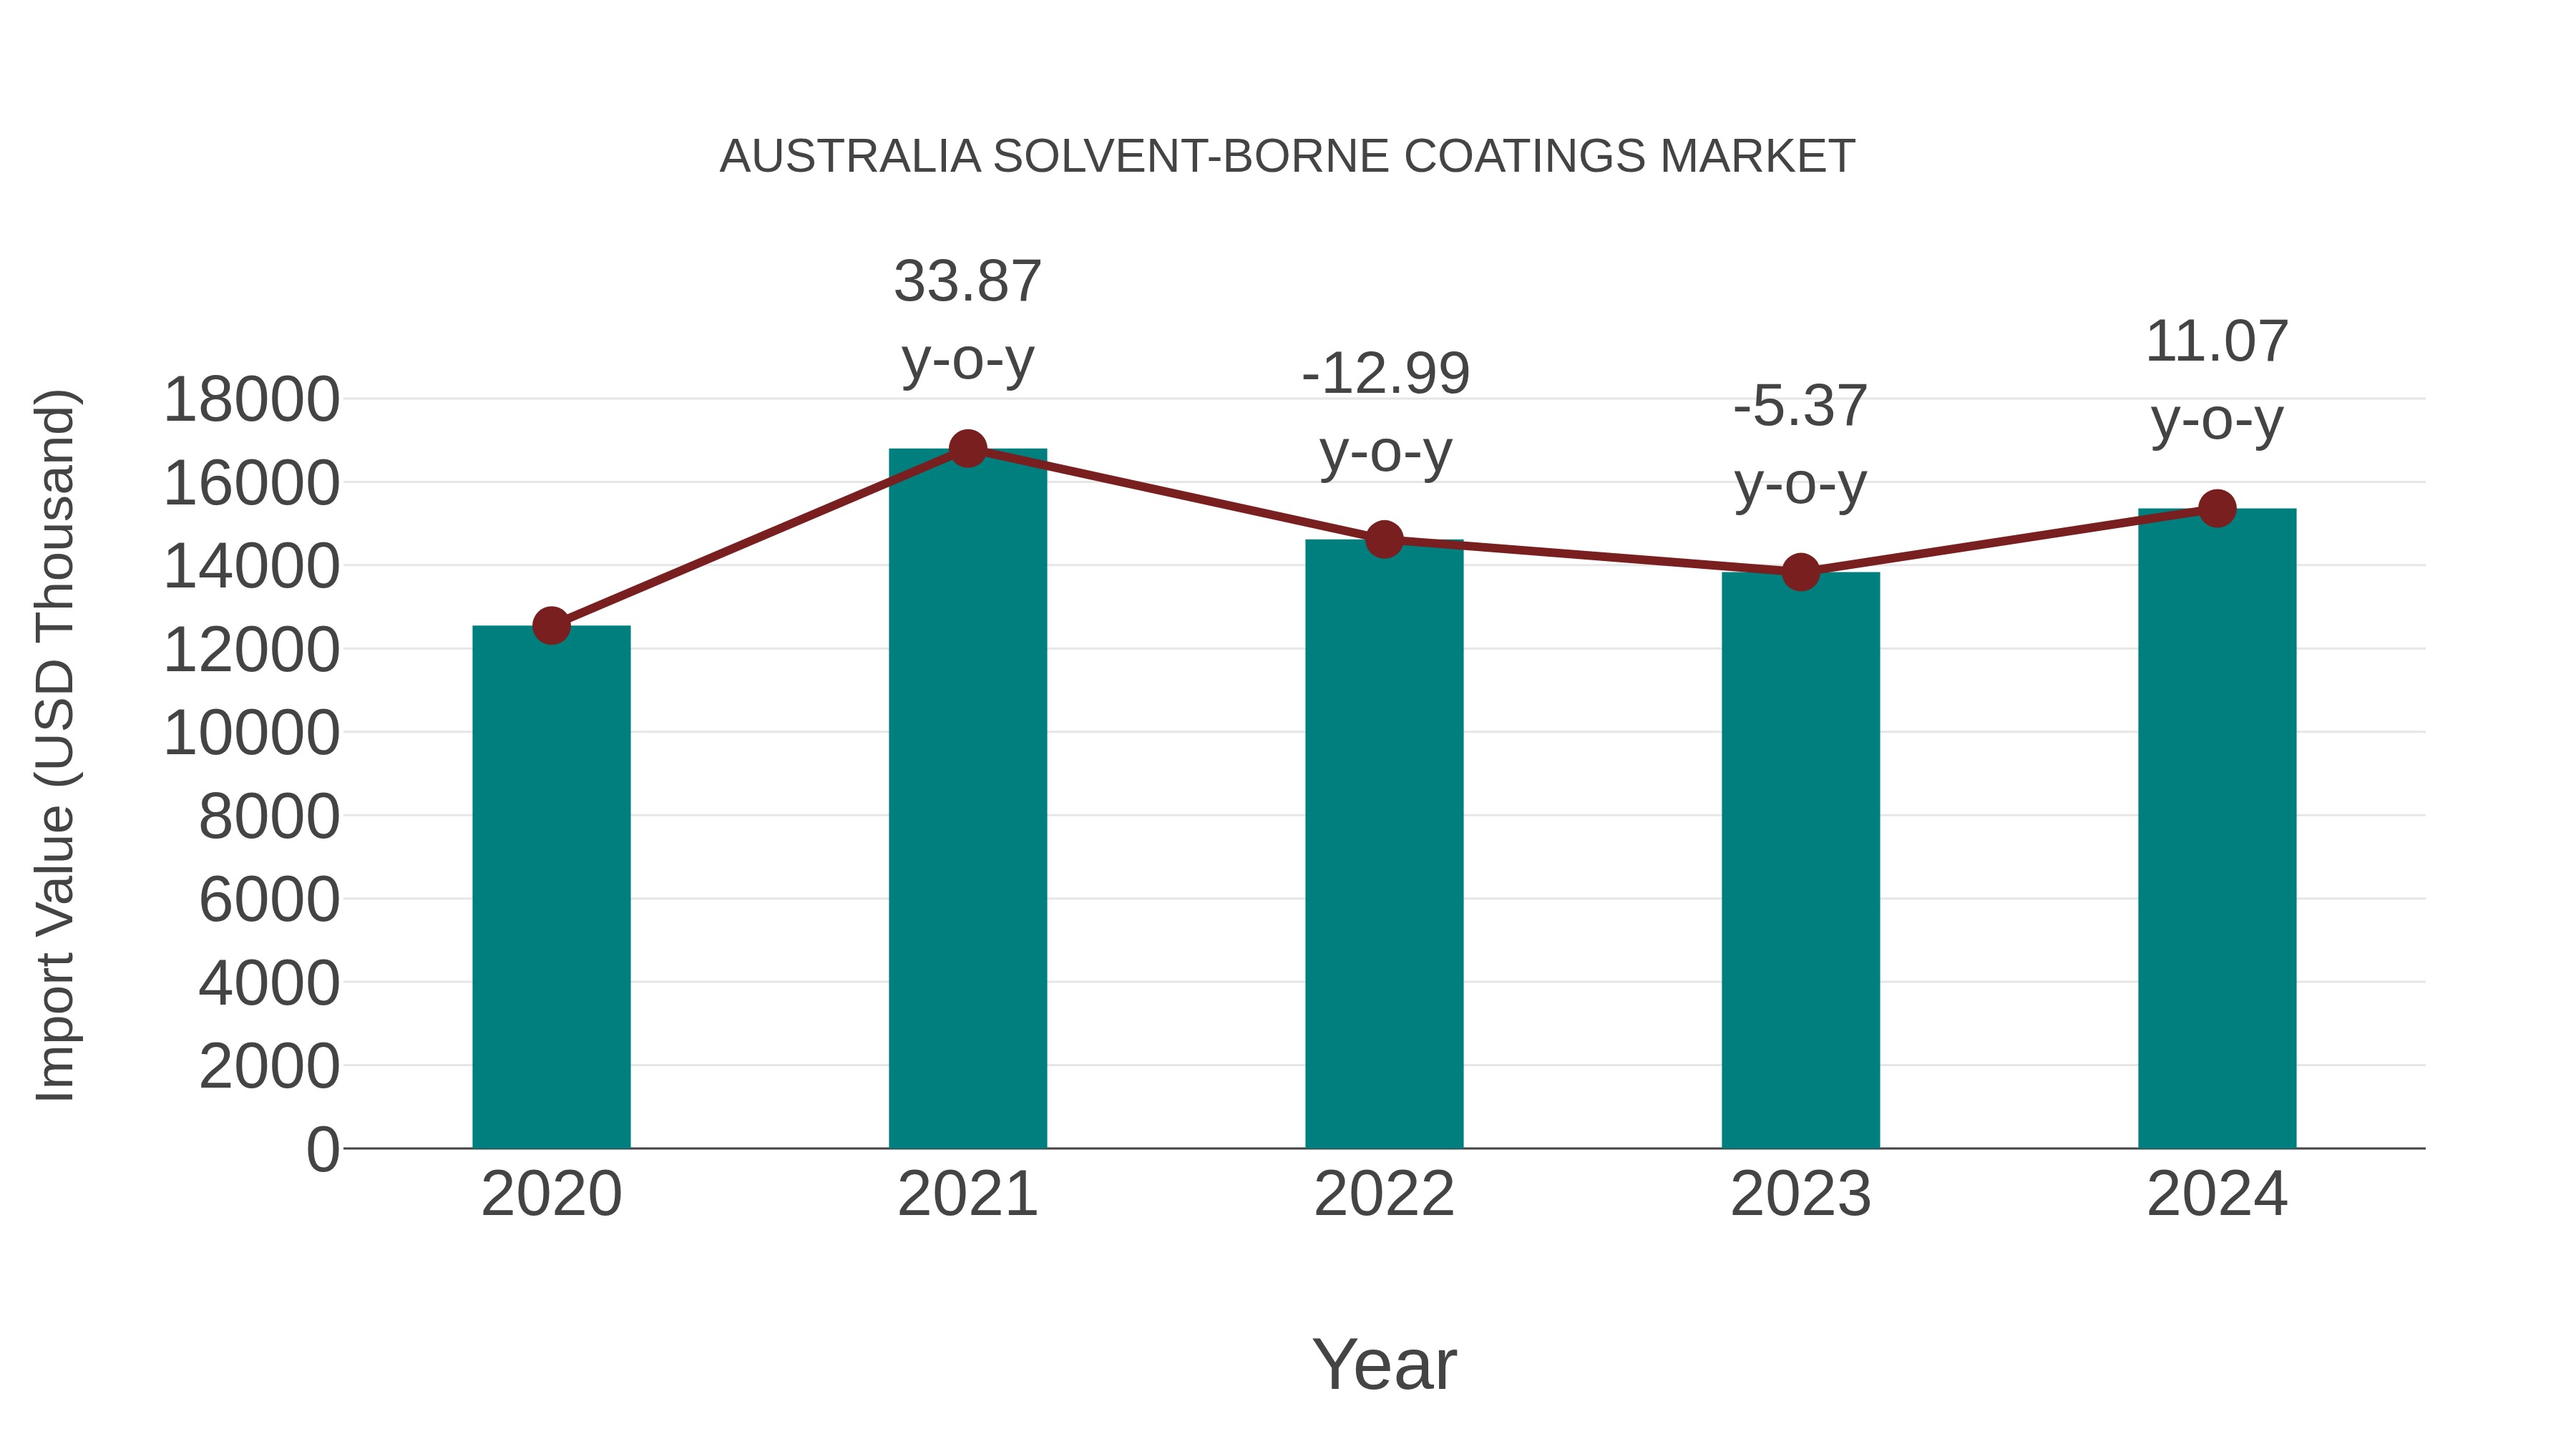
Australia Solvent-borne Coatings Market: Import Trend Analysis
Australia`s import trend for solvent-borne coatings in the Australia market saw a notable growth rate of 11.07% from 2023 to 2024, with a compound annual growth rate (CAGR) of 5.19% for the period of 2020-2024. This upward trajectory can be attributed to increasing demand for specialized coatings in various industries, driving market stability and trade momentum.
Australia Solvent Borne Coatings Market Overview
The Australia solvent borne coatings market is characterized by the widespread use of solvent-based paints and coatings across industries such as automotive, construction, and manufacturing. Despite growing environmental regulations, solvent borne coatings remain popular for their superior adhesion, durability, and finish quality. However, the market is gradually shifting toward low-VOC (volatile organic compounds) and environmentally friendly alternatives due to stringent government policies targeting air pollution and occupational safety.
Drivers of the market
The Australia solvent borne coatings market is witnessing steady growth driven by increasing demand in automotive, construction, and industrial applications. Despite environmental concerns over volatile organic compounds (VOCs), solvent borne coatings remain preferred for their durability and chemical resistance. Innovations in formulation to reduce VOC content and compliance with stricter environmental regulations are shaping market dynamics. Growth in infrastructure projects and automotive manufacturing are key demand drivers.
Challenges of the market
The Australia solvent borne coatings market faces significant environmental and regulatory challenges due to the high volatile organic compound (VOC) emissions associated with solvent-based products. Increasing government regulations aimed at reducing VOC emissions have pressured manufacturers to develop eco-friendly alternatives, which often come with higher production costs. Additionally, health and safety concerns regarding worker exposure to solvents pose operational challenges. The market also contends with fluctuating raw material prices influenced by crude oil price volatility, affecting overall profitability and pricing stability.
Investment opportunities in the Market
The solvent borne coatings market in Australia presents attractive investment opportunities driven by growing demand in industrial and automotive sectors. Despite environmental concerns about VOC emissions, advancements in low-VOC solvent technologies and regulatory frameworks encouraging eco-friendly alternatives offer room for innovation. Investments focusing on hybrid coatings combining solvent-based properties with sustainability, or in niche industrial applications like protective coatings, could yield significant returns. Additionally, Australia expanding infrastructure and manufacturing sectors provide a steady demand base.
Government Policy of the market
The Australia government enforces strict environmental regulations to control volatile organic compound (VOC) emissions from solvent-borne coatings. Agencies such as the Australia Environment Protection and Heritage Council (EPHC) and the Department of Agriculture, Water and the Environment impose limits on VOC content to reduce air pollution and health hazards. The government also encourages the industry to shift toward low-VOC or waterborne alternatives through incentives and compliance standards, influencing product formulations and manufacturing practices.
Key Highlights of the Report:
- Australia Solvent-Borne Coatings Market Outlook
- Market Size of Australia Solvent-Borne Coatings Market, 2025
- Forecast of Australia Solvent-Borne Coatings Market, 2032
- Historical Data and Forecast of Australia Solvent-Borne Coatings Revenues & Volume for the Period 2022 - 2032F
- Australia Solvent-Borne Coatings Market Trend Evolution
- Australia Solvent-Borne Coatings Market Drivers and Challenges
- Australia Solvent-Borne Coatings Price Trends
- Australia Solvent-Borne Coatings Porter's Five Forces
- Australia Solvent-Borne Coatings Industry Life Cycle
- Historical Data and Forecast of Australia Solvent-Borne Coatings Market Revenues & Volume By Product Type for the Period 2022 - 2032F
- Historical Data and Forecast of Australia Solvent-Borne Coatings Market Revenues & Volume By One Component System Solvent Borne Coatings for the Period 2022 - 2032F
- Historical Data and Forecast of Australia Solvent-Borne Coatings Market Revenues & Volume By Two Component System Solvent Borne Coatings for the Period 2022 - 2032F
- Historical Data and Forecast of Australia Solvent-Borne Coatings Market Revenues & Volume By End-use for the Period 2022 - 2032F
- Historical Data and Forecast of Australia Solvent-Borne Coatings Market Revenues & Volume By Automotive Solvent Borne Coatings for the Period 2022 - 2032F
- Historical Data and Forecast of Australia Solvent-Borne Coatings Market Revenues & Volume By Industrial Solvent Borne Coatings for the Period 2022 - 2032F
- Historical Data and Forecast of Australia Solvent-Borne Coatings Market Revenues & Volume By Printing Inks for the Period 2022 - 2032F
- Australia Solvent-Borne Coatings Import Export Trade Statistics
- Market Opportunity Assessment By Product Type
- Market Opportunity Assessment By End-use
- Australia Solvent-Borne Coatings Top Companies Market Share
- Australia Solvent-Borne Coatings Competitive Benchmarking By Technical and Operational Parameters
- Australia Solvent-Borne Coatings Company Profiles
- Australia Solvent-Borne Coatings Key Strategic Recommendations
Australia Solvent-Borne Coatings Market (2026-2032): FAQs
6Wresearch actively monitors the Australia Solvent-Borne Coatings Market and publishes its comprehensive annual report, highlighting emerging trends, growth drivers, revenue analysis, and forecast outlook. Our insights help businesses to make data-backed strategic decisions with ongoing market dynamics. Our analysts track relevent industries related to the Australia Solvent-Borne Coatings Market, allowing our clients with actionable intelligence and reliable forecasts tailored to emerging regional needs.
Yes, we provide customisation as per your requirements. To learn more, feel free to contact us on sales@6wresearch.com
1 Executive Summary |
2 Introduction |
2.1 Key Highlights of the Report |
2.2 Report Description |
2.3 Market Scope & Segmentation |
2.4 Research Methodology |
2.5 Assumptions |
3 Australia Solvent-Borne Coatings Market Overview |
3.1 Australia Country Macro Economic Indicators |
3.2 Australia Solvent-Borne Coatings Market Revenues & Volume, 2022 & 2032F |
3.3 Australia Solvent-Borne Coatings Market - Industry Life Cycle |
3.4 Australia Solvent-Borne Coatings Market - Porter's Five Forces |
3.5 Australia Solvent-Borne Coatings Market Revenues & Volume Share, By Product Type, 2022 & 2032F |
3.6 Australia Solvent-Borne Coatings Market Revenues & Volume Share, By End-use, 2022 & 2032F |
4 Australia Solvent-Borne Coatings Market Dynamics |
4.1 Impact Analysis |
4.2 Market Drivers |
4.2.1 Growing demand for solvent-borne coatings in the construction industry due to their durability and versatility. |
4.2.2 Increasing infrastructure development projects in Australia leading to higher demand for solvent-borne coatings. |
4.2.3 Technological advancements in solvent-borne coatings leading to improved performance and environmental sustainability. |
4.3 Market Restraints |
4.3.1 Stringent regulations on volatile organic compound (VOC) emissions leading to limitations on the use of solvent-borne coatings. |
4.3.2 Shift towards water-based coatings due to environmental concerns and regulations impacting the demand for solvent-borne coatings. |
5 Australia Solvent-Borne Coatings Market Trends |
6 Australia Solvent-Borne Coatings Market, By Types |
6.1 Australia Solvent-Borne Coatings Market, By Product Type |
6.1.1 Overview and Analysis |
6.1.2 Australia Solvent-Borne Coatings Market Revenues & Volume, By Product Type, 2022 - 2032F |
6.1.3 Australia Solvent-Borne Coatings Market Revenues & Volume, By One Component System Solvent Borne Coatings, 2022 - 2032F |
6.1.4 Australia Solvent-Borne Coatings Market Revenues & Volume, By Two Component System Solvent Borne Coatings, 2022 - 2032F |
6.2 Australia Solvent-Borne Coatings Market, By End-use |
6.2.1 Overview and Analysis |
6.2.2 Australia Solvent-Borne Coatings Market Revenues & Volume, By Automotive Solvent Borne Coatings, 2022 - 2032F |
6.2.3 Australia Solvent-Borne Coatings Market Revenues & Volume, By Industrial Solvent Borne Coatings, 2022 - 2032F |
6.2.4 Australia Solvent-Borne Coatings Market Revenues & Volume, By Printing Inks, 2022 - 2032F |
7 Australia Solvent-Borne Coatings Market Import-Export Trade Statistics |
7.1 Australia Solvent-Borne Coatings Market Export to Major Countries |
7.2 Australia Solvent-Borne Coatings Market Imports from Major Countries |
8 Australia Solvent-Borne Coatings Market Key Performance Indicators |
8.1 Percentage of market share held by solvent-borne coatings compared to water-based coatings. |
8.2 Adoption rate of low-VOC or eco-friendly solvent-borne coatings in the market. |
8.3 Number of new product launches or innovations in solvent-borne coatings technology. |
8.4 Growth rate of the construction industry and infrastructure projects in Australia. |
8.5 Percentage of companies investing in research and development for improving solvent-borne coatings. |
9 Australia Solvent-Borne Coatings Market - Opportunity Assessment |
9.1 Australia Solvent-Borne Coatings Market Opportunity Assessment, By Product Type, 2022 & 2032F |
9.2 Australia Solvent-Borne Coatings Market Opportunity Assessment, By End-use, 2022 & 2032F |
10 Australia Solvent-Borne Coatings Market - Competitive Landscape |
10.1 Australia Solvent-Borne Coatings Market Revenue Share, By Companies, 2025 |
10.2 Australia Solvent-Borne Coatings Market Competitive Benchmarking, By Operating and Technical Parameters |
11 Company Profiles |
12 Recommendations |
13 Disclaimer |
Global Go To Market Strategy - 2030
Export potential enables firms to identify high-growth global markets with greater confidence by combining advanced trade intelligence with a structured quantitative methodology. The framework analyzes emerging demand trends and country-level import patterns while integrating macroeconomic and trade datasets such as GDP and population forecasts, bilateral import–export flows, tariff structures, elasticity differentials between developed and developing economies, geographic distance, and import demand projections. Using weighted trade values from 2020–2024 as the base period to project country-to-country export potential for 2030, these inputs are operationalized through calculated drivers such as gravity model parameters, tariff impact factors, and projected GDP per-capita growth. Through an analysis of hidden potentials, demand hotspots, and market conditions that are most favorable to success, this method enables firms to focus on target countries, maximize returns, and global expansion with data, backed by accuracy.
By factoring in the projected importer demand gap that is currently unmet and could be potential opportunity, it identifies the potential for the Exporter (Country) among 190 countries, against the general trade analysis, which identifies the biggest importer or exporter.
To discover high-growth global markets and optimize your business strategy:
Click Here
Pricing
- Single User License$ 1,995
- Department License$ 2,400
- Site License$ 3,120
- Global License$ 3,795

Leadership Perspectives from Industry Events
Search
Thought Leadership and Analyst Meet


Our Clients
6WResearch In News
- India Export Attractiveness Tracker 2026
- India Air Conditioner Market Set for Strong Rebound in 2026 After Weather-Led Correction and GST-Driven Recovery: 6Wresearch
- ADAS in India: How Automatic Emergency Braking, Blind Spot Detection & Driver Monitoring are Transforming Road Safety
- Doha a strategic location for EV manufacturing hub: IPA Qatar
- Demand for luxury TVs surging in the GCC, says Samsung
- Empowering Growth: The Thriving Journey of Bangladesh’s Cable Industry
Latest Reports
- Nicaragua RPG Gaming Market (2026-2032)
- New Zealand RPG Gaming Market (2026-2032)
- Netherlands RPG Gaming Market (2026-2032)
- Nauru RPG Gaming Market (2026-2032)
- Namibia RPG Gaming Market (2026-2032)
- Mozambique RPG Gaming Market (2026-2032)
- Montenegro RPG Gaming Market (2026-2032)
- Mongolia RPG Gaming Market (2026-2032)
- Monaco RPG Gaming Market (2026-2032)
- Micronesia RPG Gaming Market (2026-2032)
Industry Events and Analyst Meet

EV India Expo 2026

HIMTEX 2026

India Refining Summit 2026

India EV Show 2026

EV tech India Expo 2026
Whitepaper
- Middle East & Africa Commercial Security Market Click here to view more.
- Middle East & Africa Fire Safety Systems & Equipment Market Click here to view more.
- GCC Drone Market Click here to view more.
- Middle East Lighting Fixture Market Click here to view more.
- GCC Physical & Perimeter Security Market Click here to view more.