Australia Sunprotection Products Market (2026-2032) | Forecast, Trends, Segmentation, Competitive Landscape, Analysis, Size & Revenue, Outlook, Share, Value, Industry, Growth, Companies
Market Forecast By Product Type (Sun-Care Products, After Sun Products, Self-Tanning Care Products), By Form (Creams, Gel, Lotion, Wipes, Spray, Dioxide, Zinc Oxide, Natural Oils), By Packaging (Sticks, Tubes, Bottles, Other), By Cusomer Orientation (Male, Female, Unisex), By Distribution Channel (Modern Trade, Convenience Store, Departmental Store, Professional Salons, Drug Store, Specialty Stores, Online Stores, Other) And Competitive Landscape
| Product Code: ETC6192152 | Publication Date: Sep 2024 | Updated Date: Mar 2026 | Product Type: Market Research Report | |
| Publisher: 6Wresearch | Author: Sachin Kumar Rai | No. of Pages: 75 | No. of Figures: 35 | No. of Tables: 20 |
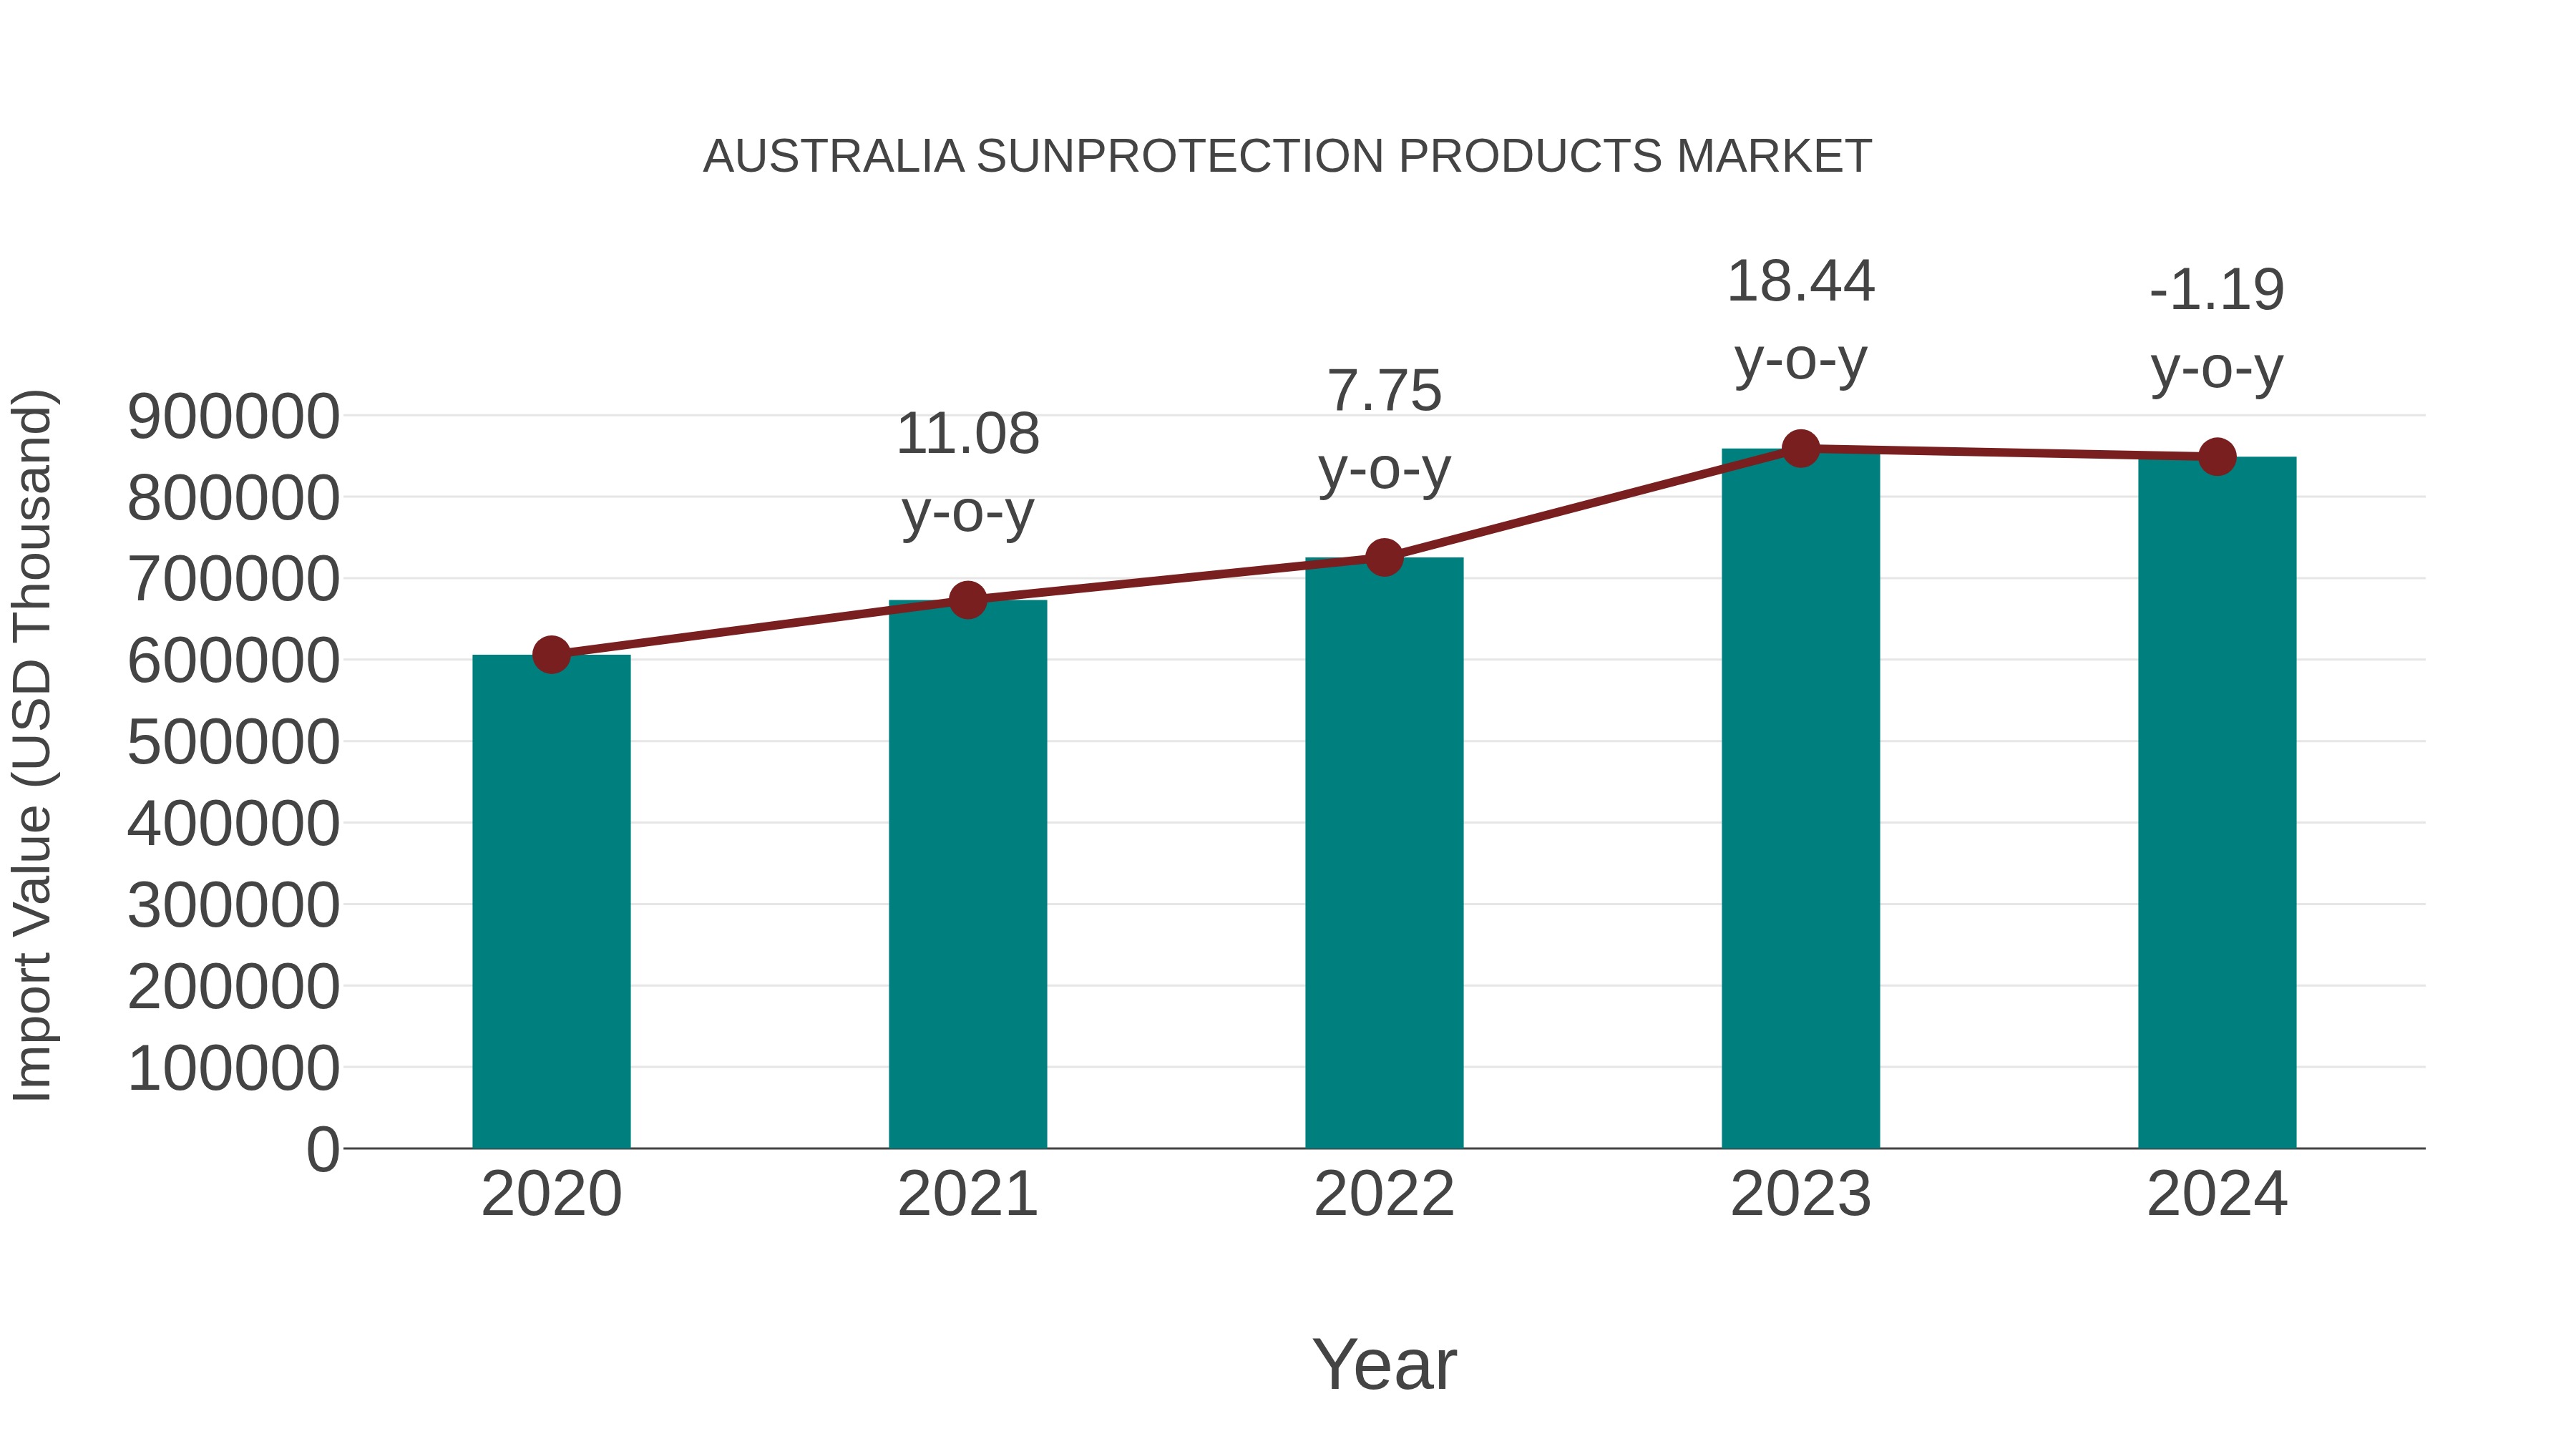
Australia Sunprotection Products Market: Import Trend Analysis
In 2024, Australia`s import trend for sun protection products experienced a decline, with a growth rate of -1.19% compared to the previous year. However, the compound annual growth rate (CAGR) from 2020-2024 stood at 8.79%. This shift may be attributed to changes in consumer preferences or market saturation impacting import momentum.
Australia Sunprotection Products Market Overview
Australias sunprotection products market is robust due to the countrys high UV exposure and public health campaigns promoting skin protection. Products include sunscreens, protective clothing, hats, and accessories. Innovation focuses on broad-spectrum protection, water resistance, and formulations catering to different skin types. The market is also influenced by regulatory standards and consumer preference for natural or organic ingredients.
Trends of the market
Australias sunprotection products market is expanding rapidly, fueled by heightened awareness of skin cancer risks and the countrys high UV exposure. There is growing demand for broad-spectrum sunscreens with added skincare benefits such as moisturization and anti-aging. Mineral-based and reef-safe formulations are trending, supported by environmental regulations. Innovations in spray, gel, and stick formats for convenience and better skin absorption are also influencing market growth.
Challenges of the market
Sunprotection products in Australia face challenges from regulatory scrutiny concerning ingredient safety and environmental impact, especially for reef-safe formulations. The market is highly competitive, with numerous local and international brands vying for consumer attention. Consumer education on product efficacy and broad-spectrum protection remains critical. Additionally, climate change impacts and increased skin cancer awareness drive demand fluctuations.
Investment opportunities in the Market
Investment opportunities in the Australia sun protection products market are robust, fueled by increasing skin cancer awareness and demand for skincare products with UV protection. Growing interest in natural and organic sun protection formulations opens new market segments. Investments in R&D for broad-spectrum protection, long-lasting formulations, and multifunctional products like combined moisturizers and sunscreens can capture growing consumer preference.
Government Policy of the market
The sunprotection products market is regulated by strict government guidelines to ensure product safety and efficacy. The Therapeutic Goods Administration (TGA) regulates sunscreens as therapeutic goods, requiring rigorous testing and approval. Public health campaigns promote sun safety awareness, driving demand. Environmental regulations also encourage formulation changes to reduce harmful impacts on marine ecosystems, such as banning certain UV filters.
Key Highlights of the Report:
- Australia Sunprotection Products Market Outlook
- Market Size of Australia Sunprotection Products Market, 2025
- Forecast of Australia Sunprotection Products Market, 2032
- Historical Data and Forecast of Australia Sunprotection Products Revenues & Volume for the Period 2022 - 2032F
- Australia Sunprotection Products Market Trend Evolution
- Australia Sunprotection Products Market Drivers and Challenges
- Australia Sunprotection Products Price Trends
- Australia Sunprotection Products Porter's Five Forces
- Australia Sunprotection Products Industry Life Cycle
- Historical Data and Forecast of Australia Sunprotection Products Market Revenues & Volume By Product Type for the Period 2022 - 2032F
- Historical Data and Forecast of Australia Sunprotection Products Market Revenues & Volume By Sun-Care Products for the Period 2022 - 2032F
- Historical Data and Forecast of Australia Sunprotection Products Market Revenues & Volume By After Sun Products for the Period 2022 - 2032F
- Historical Data and Forecast of Australia Sunprotection Products Market Revenues & Volume By Self-Tanning Care Products for the Period 2022 - 2032F
- Historical Data and Forecast of Australia Sunprotection Products Market Revenues & Volume By Form for the Period 2022 - 2032F
- Historical Data and Forecast of Australia Sunprotection Products Market Revenues & Volume By Creams for the Period 2022 - 2032F
- Historical Data and Forecast of Australia Sunprotection Products Market Revenues & Volume By Gel for the Period 2022 - 2032F
- Historical Data and Forecast of Australia Sunprotection Products Market Revenues & Volume By Lotion for the Period 2022 - 2032F
- Historical Data and Forecast of Australia Sunprotection Products Market Revenues & Volume By Wipes for the Period 2022 - 2032F
- Historical Data and Forecast of Australia Sunprotection Products Market Revenues & Volume By Spray for the Period 2022 - 2032F
- Historical Data and Forecast of Australia Sunprotection Products Market Revenues & Volume By Dioxide for the Period 2022 - 2032F
- Historical Data and Forecast of Australia Sunprotection Products Market Revenues & Volume By Zinc Oxide for the Period 2022 - 2032F
- Historical Data and Forecast of Australia Sunprotection Products Market Revenues & Volume By Natural Oils for the Period 2022 - 2032F
- Historical Data and Forecast of Australia Sunprotection Products Market Revenues & Volume By Packaging for the Period 2022 - 2032F
- Historical Data and Forecast of Australia Sunprotection Products Market Revenues & Volume By Sticks for the Period 2022 - 2032F
- Historical Data and Forecast of Australia Sunprotection Products Market Revenues & Volume By Tubes for the Period 2022 - 2032F
- Historical Data and Forecast of Australia Sunprotection Products Market Revenues & Volume By Bottles for the Period 2022 - 2032F
- Historical Data and Forecast of Australia Sunprotection Products Market Revenues & Volume By Other for the Period 2022 - 2032F
- Historical Data and Forecast of Australia Sunprotection Products Market Revenues & Volume By Cusomer Orientation for the Period 2022 - 2032F
- Historical Data and Forecast of Australia Sunprotection Products Market Revenues & Volume By Male for the Period 2022 - 2032F
- Historical Data and Forecast of Australia Sunprotection Products Market Revenues & Volume By Female for the Period 2022 - 2032F
- Historical Data and Forecast of Australia Sunprotection Products Market Revenues & Volume By Unisex for the Period 2022 - 2032F
- Historical Data and Forecast of Australia Sunprotection Products Market Revenues & Volume By Distribution Channel for the Period 2022 - 2032F
- Historical Data and Forecast of Australia Sunprotection Products Market Revenues & Volume By Modern Trade for the Period 2022 - 2032F
- Historical Data and Forecast of Australia Sunprotection Products Market Revenues & Volume By Convenience Store for the Period 2022 - 2032F
- Historical Data and Forecast of Australia Sunprotection Products Market Revenues & Volume By Departmental Store for the Period 2022 - 2032F
- Historical Data and Forecast of Australia Sunprotection Products Market Revenues & Volume By Professional Salons for the Period 2022 - 2032F
- Historical Data and Forecast of Australia Sunprotection Products Market Revenues & Volume By Drug Store for the Period 2022 - 2032F
- Historical Data and Forecast of Australia Sunprotection Products Market Revenues & Volume By Specialty Stores for the Period 2022 - 2032F
- Historical Data and Forecast of Australia Sunprotection Products Market Revenues & Volume By Online Stores for the Period 2022 - 2032F
- Historical Data and Forecast of Australia Sunprotection Products Market Revenues & Volume By Other for the Period 2022 - 2032F
- Australia Sunprotection Products Import Export Trade Statistics
- Market Opportunity Assessment By Product Type
- Market Opportunity Assessment By Form
- Market Opportunity Assessment By Packaging
- Market Opportunity Assessment By Cusomer Orientation
- Market Opportunity Assessment By Distribution Channel
- Australia Sunprotection Products Top Companies Market Share
- Australia Sunprotection Products Competitive Benchmarking By Technical and Operational Parameters
- Australia Sunprotection Products Company Profiles
- Australia Sunprotection Products Key Strategic Recommendations
Australia Sunprotection Products Market (2026-2032): FAQs
6Wresearch actively monitors the Australia Sunprotection Products Market and publishes its comprehensive annual report, highlighting emerging trends, growth drivers, revenue analysis, and forecast outlook. Our insights help businesses to make data-backed strategic decisions with ongoing market dynamics. Our analysts track relevent industries related to the Australia Sunprotection Products Market, allowing our clients with actionable intelligence and reliable forecasts tailored to emerging regional needs.
Yes, we provide customisation as per your requirements. To learn more, feel free to contact us on sales@6wresearch.com
1 Executive Summary |
2 Introduction |
2.1 Key Highlights of the Report |
2.2 Report Description |
2.3 Market Scope & Segmentation |
2.4 Research Methodology |
2.5 Assumptions |
3 Australia Sunprotection Products Market Overview |
3.1 Australia Country Macro Economic Indicators |
3.2 Australia Sunprotection Products Market Revenues & Volume, 2022 & 2032F |
3.3 Australia Sunprotection Products Market - Industry Life Cycle |
3.4 Australia Sunprotection Products Market - Porter's Five Forces |
3.5 Australia Sunprotection Products Market Revenues & Volume Share, By Product Type, 2022 & 2032F |
3.6 Australia Sunprotection Products Market Revenues & Volume Share, By Form, 2022 & 2032F |
3.7 Australia Sunprotection Products Market Revenues & Volume Share, By Packaging, 2022 & 2032F |
3.8 Australia Sunprotection Products Market Revenues & Volume Share, By Cusomer Orientation, 2022 & 2032F |
3.9 Australia Sunprotection Products Market Revenues & Volume Share, By Distribution Channel, 2022 & 2032F |
4 Australia Sunprotection Products Market Dynamics |
4.1 Impact Analysis |
4.2 Market Drivers |
4.2.1 Growing awareness about the harmful effects of UV radiation on skin health |
4.2.2 Increasing incidence of skin cancer in Australia |
4.2.3 Rising demand for multifunctional sun protection products |
4.3 Market Restraints |
4.3.1 Seasonality of sun protection product sales due to weather conditions |
4.3.2 Competition from other skincare products offering sun protection benefits |
4.3.3 Regulatory challenges related to sunscreen ingredients and labeling |
5 Australia Sunprotection Products Market Trends |
6 Australia Sunprotection Products Market, By Types |
6.1 Australia Sunprotection Products Market, By Product Type |
6.1.1 Overview and Analysis |
6.1.2 Australia Sunprotection Products Market Revenues & Volume, By Product Type, 2022 - 2032F |
6.1.3 Australia Sunprotection Products Market Revenues & Volume, By Sun-Care Products, 2022 - 2032F |
6.1.4 Australia Sunprotection Products Market Revenues & Volume, By After Sun Products, 2022 - 2032F |
6.1.5 Australia Sunprotection Products Market Revenues & Volume, By Self-Tanning Care Products, 2022 - 2032F |
6.2 Australia Sunprotection Products Market, By Form |
6.2.1 Overview and Analysis |
6.2.2 Australia Sunprotection Products Market Revenues & Volume, By Creams, 2022 - 2032F |
6.2.3 Australia Sunprotection Products Market Revenues & Volume, By Gel, 2022 - 2032F |
6.2.4 Australia Sunprotection Products Market Revenues & Volume, By Lotion, 2022 - 2032F |
6.2.5 Australia Sunprotection Products Market Revenues & Volume, By Wipes, 2022 - 2032F |
6.2.6 Australia Sunprotection Products Market Revenues & Volume, By Spray, 2022 - 2032F |
6.2.7 Australia Sunprotection Products Market Revenues & Volume, By Dioxide, 2022 - 2032F |
6.2.8 Australia Sunprotection Products Market Revenues & Volume, By Natural Oils, 2022 - 2032F |
6.2.9 Australia Sunprotection Products Market Revenues & Volume, By Natural Oils, 2022 - 2032F |
6.2.10 Australia Sunprotection Products Market Revenues & Volume, By Other, 2022 - 2032F |
6.3 Australia Sunprotection Products Market, By Packaging |
6.3.1 Overview and Analysis |
6.3.2 Australia Sunprotection Products Market Revenues & Volume, By Sticks, 2022 - 2032F |
6.3.3 Australia Sunprotection Products Market Revenues & Volume, By Tubes, 2022 - 2032F |
6.3.4 Australia Sunprotection Products Market Revenues & Volume, By Bottles, 2022 - 2032F |
6.3.5 Australia Sunprotection Products Market Revenues & Volume, By Other, 2022 - 2032F |
6.4 Australia Sunprotection Products Market, By Cusomer Orientation |
6.4.1 Overview and Analysis |
6.4.2 Australia Sunprotection Products Market Revenues & Volume, By Male, 2022 - 2032F |
6.4.3 Australia Sunprotection Products Market Revenues & Volume, By Female, 2022 - 2032F |
6.4.4 Australia Sunprotection Products Market Revenues & Volume, By Unisex, 2022 - 2032F |
6.5 Australia Sunprotection Products Market, By Distribution Channel |
6.5.1 Overview and Analysis |
6.5.2 Australia Sunprotection Products Market Revenues & Volume, By Modern Trade, 2022 - 2032F |
6.5.3 Australia Sunprotection Products Market Revenues & Volume, By Convenience Store, 2022 - 2032F |
6.5.4 Australia Sunprotection Products Market Revenues & Volume, By Departmental Store, 2022 - 2032F |
6.5.5 Australia Sunprotection Products Market Revenues & Volume, By Professional Salons, 2022 - 2032F |
6.5.6 Australia Sunprotection Products Market Revenues & Volume, By Drug Store, 2022 - 2032F |
6.5.7 Australia Sunprotection Products Market Revenues & Volume, By Specialty Stores, 2022 - 2032F |
6.5.8 Australia Sunprotection Products Market Revenues & Volume, By Other, 2022 - 2032F |
6.5.9 Australia Sunprotection Products Market Revenues & Volume, By Other, 2022 - 2032F |
7 Australia Sunprotection Products Market Import-Export Trade Statistics |
7.1 Australia Sunprotection Products Market Export to Major Countries |
7.2 Australia Sunprotection Products Market Imports from Major Countries |
8 Australia Sunprotection Products Market Key Performance Indicators |
8.1 Number of new product launches with innovative sun protection technologies |
8.2 Average SPF (Sun Protection Factor) level in sun protection products in the market |
8.3 Percentage of consumers using sun protection products daily |
8.4 Number of skin cancer cases reported annually in Australia |
8.5 Adoption rate of sun protection products among different age groups and demographics |
9 Australia Sunprotection Products Market - Opportunity Assessment |
9.1 Australia Sunprotection Products Market Opportunity Assessment, By Product Type, 2022 & 2032F |
9.2 Australia Sunprotection Products Market Opportunity Assessment, By Form, 2022 & 2032F |
9.3 Australia Sunprotection Products Market Opportunity Assessment, By Packaging, 2022 & 2032F |
9.4 Australia Sunprotection Products Market Opportunity Assessment, By Cusomer Orientation, 2022 & 2032F |
9.5 Australia Sunprotection Products Market Opportunity Assessment, By Distribution Channel, 2022 & 2032F |
10 Australia Sunprotection Products Market - Competitive Landscape |
10.1 Australia Sunprotection Products Market Revenue Share, By Companies, 2025 |
10.2 Australia Sunprotection Products Market Competitive Benchmarking, By Operating and Technical Parameters |
11 Company Profiles |
12 Recommendations |
13 Disclaimer |
Export potential assessment - trade Analytics for 2030
Export potential enables firms to identify high-growth global markets with greater confidence by combining advanced trade intelligence with a structured quantitative methodology. The framework analyzes emerging demand trends and country-level import patterns while integrating macroeconomic and trade datasets such as GDP and population forecasts, bilateral import–export flows, tariff structures, elasticity differentials between developed and developing economies, geographic distance, and import demand projections. Using weighted trade values from 2020–2024 as the base period to project country-to-country export potential for 2030, these inputs are operationalized through calculated drivers such as gravity model parameters, tariff impact factors, and projected GDP per-capita growth. Through an analysis of hidden potentials, demand hotspots, and market conditions that are most favorable to success, this method enables firms to focus on target countries, maximize returns, and global expansion with data, backed by accuracy.
By factoring in the projected importer demand gap that is currently unmet and could be potential opportunity, it identifies the potential for the Exporter (Country) among 190 countries, against the general trade analysis, which identifies the biggest importer or exporter.
To discover high-growth global markets and optimize your business strategy:
Click Here
Pricing
- Single User License$ 1,995
- Department License$ 2,400
- Site License$ 3,120
- Global License$ 3,795

Search
Thought Leadership and Analyst Meet


Our Clients
Latest Reports
- Taiwan Food Delivery Platform Market (2026-2032) | Companies, Outlook, Analysis, Trends, Value, Revenue, Segmentation, Share, Forecast, Competitive Landscape, Growth, Size & Forecast
- United Kingdom (UK) Long-term Care Insurance Market (2026-2032) | Growth, Share, Consumer Insights, Drivers, Opportunities, Competition, Pricing Analysis, Segments, Restraints, Companies, Competitive, Value, Outlook, Size, Demand, Analysis, Challenges, Strategic Insights, Investment Trends, Revenue, Trends, Supply, Forecast
- United Kingdom (UK) Long Term Care Market (2026-2032) | Companies, Outlook, Analysis, Trends, Value, Revenue, Segmentation, Share, Forecast, Competitive Landscape, Growth, Size & Forecast
- Iraq Insulation and Waterproofing Market (2026-2032) | Outlook, Drivers, Growth, Size, Share, Industry, Revenue, Trends, Demand, Competitive, Strategic Insights, Opportunities, Segments, Companies, Challenges, Strategy, Consumer Insights, Analysis, Investment Trends, Value, Segmentation, Forecast, Restraints
- India Switchgear Market Outlook (2026-2032) | Size, Share, Trends, Growth, Revenue, Forecast, Analysis, Value, Outlook
- Pakistan Contraceptive Implants Market (2025-2031) | Demand, Growth, Size, Share, Industry, Pricing Analysis, Competitive, Strategic Insights, Strategy, Consumer Insights, Analysis, Investment Trends, Opportunities, Revenue, Segments, Value, Segmentation, Supply, Forecast, Restraints, Outlook, Competition, Drivers, Trends, Companies, Challenges
- Sri Lanka Packaging Market (2026-2032) | Outlook, Competition, Drivers, Trends, Demand, Pricing Analysis, Competitive, Strategic Insights, Companies, Challenges, Strategy, Consumer Insights, Analysis, Investment Trends, Opportunities, Growth, Size, Share, Industry, Revenue, Segments, Value, Segmentation, Supply, Forecast, Restraints
- India Kids Watches Market (2026-2032) | Strategy, Consumer Insights, Analysis, Investment Trends, Opportunities, Growth, Size, Share, Industry, Revenue, Segments, Value, Segmentation, Supply, Forecast, Restraints, Outlook, Competition, Drivers, Trends, Demand, Pricing Analysis, Competitive, Strategic Insights, Companies, Challenges
- Saudi Arabia Core Assurance Service Market (2025-2031) | Strategy, Consumer Insights, Analysis, Investment Trends, Opportunities, Growth, Size, Share, Industry, Revenue, Segments, Value, Segmentation, Supply, Forecast, Restraints, Outlook, Competition, Drivers, Trends, Demand, Pricing Analysis, Competitive, Strategic Insights, Companies, Challenges
- Romania Uninterruptible Power Supply (UPS) Market (2026-2032) | Industry, Analysis, Revenue, Size, Forecast, Outlook, Value, Trends, Share, Growth & Companies
Industry Events and Analyst Meet

India EV Show 2026

EV tech India Expo 2026

Auto Tech Asia 2026

Battery Tech India 2026

Smart Production Solutions Guangzhou 2026
Whitepaper
- Middle East & Africa Commercial Security Market Click here to view more.
- Middle East & Africa Fire Safety Systems & Equipment Market Click here to view more.
- GCC Drone Market Click here to view more.
- Middle East Lighting Fixture Market Click here to view more.
- GCC Physical & Perimeter Security Market Click here to view more.
6WResearch In News
- Doha a strategic location for EV manufacturing hub: IPA Qatar
- Demand for luxury TVs surging in the GCC, says Samsung
- Empowering Growth: The Thriving Journey of Bangladesh’s Cable Industry
- Demand for luxury TVs surging in the GCC, says Samsung
- Video call with a traditional healer? Once unthinkable, it’s now common in South Africa
- Intelligent Buildings To Smooth GCC’s Path To Net Zero