Australia Textured Butter Market (2026-2032) | Analysis, Segmentation, Value, Forecast, Size & Revenue, Trends, Industry, Growth, Outlook, Share, Competitive Landscape, Companies
Market Forecast By Type (Organic Butter, Conventional Butter), By Distribution Channel (Online Sales, Offline Retail) And Competitive Landscape
| Product Code: ETC6192724 | Publication Date: Sep 2024 | Updated Date: Mar 2026 | Product Type: Market Research Report | |
| Publisher: 6Wresearch | Author: Shubham Padhi | No. of Pages: 75 | No. of Figures: 35 | No. of Tables: 20 |
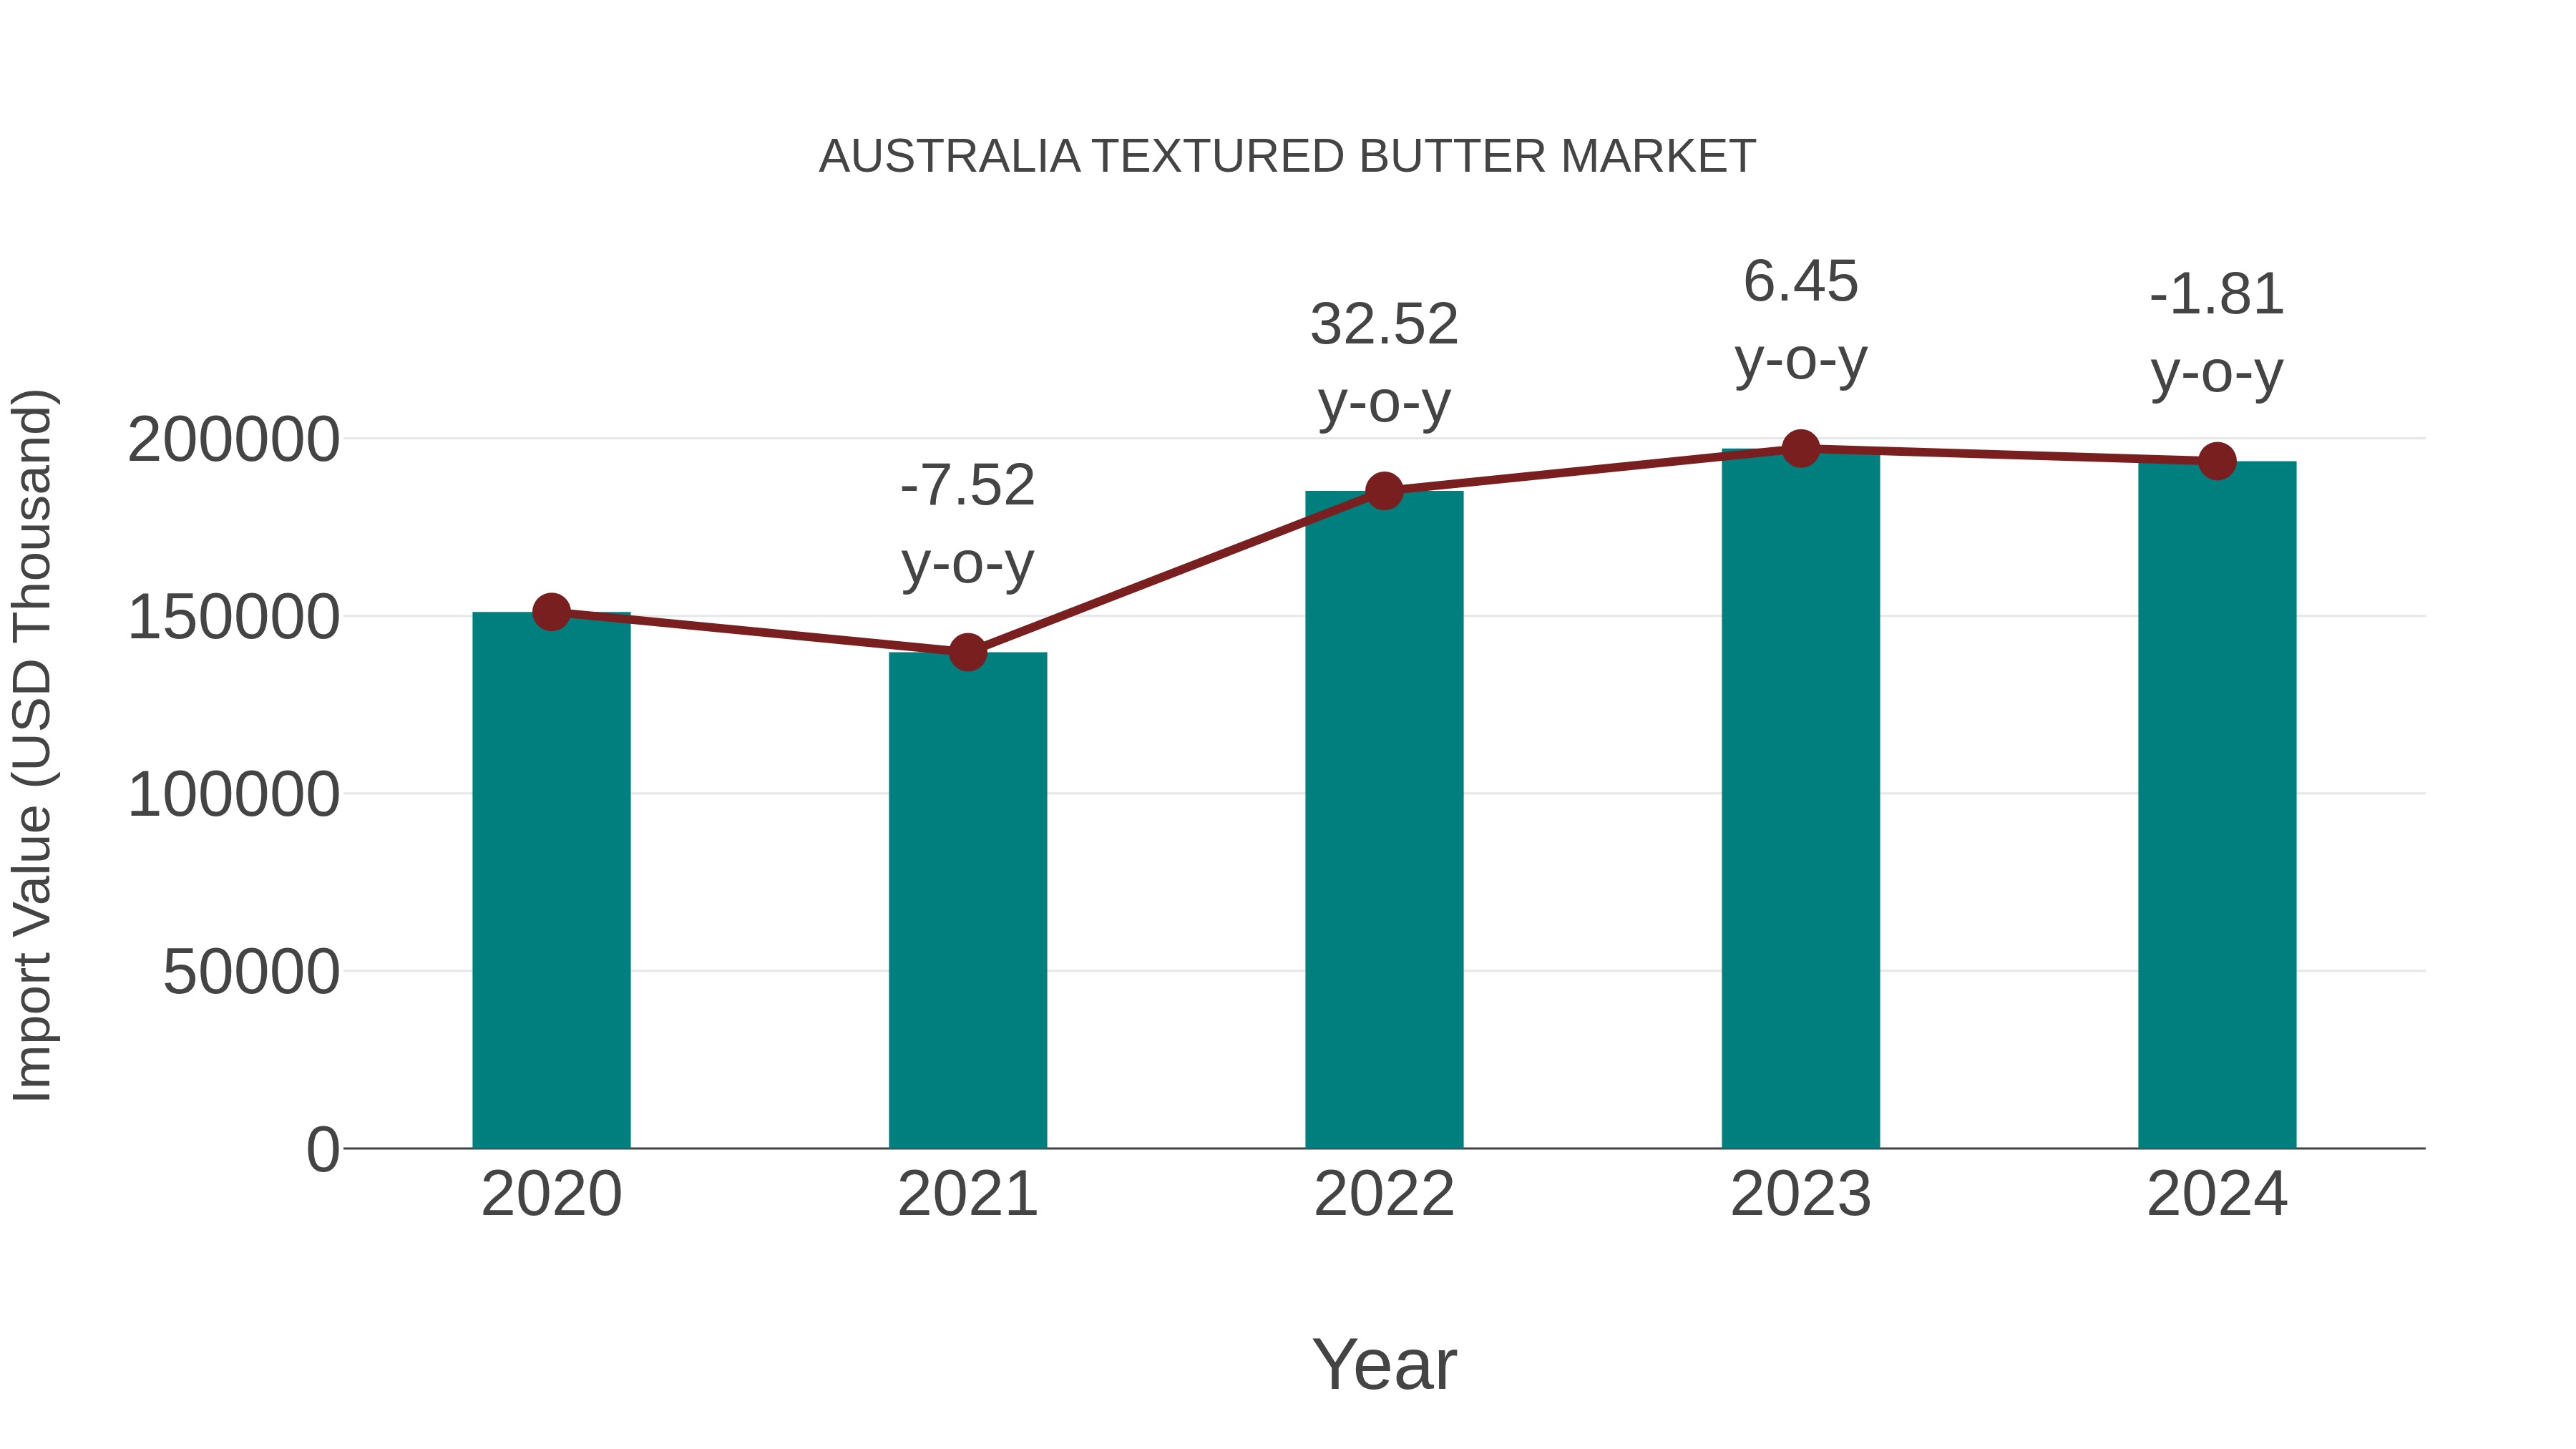
Australia Textured Butter Market: Import Trend Analysis
In 2024, Australia`s import trend for the textured butter market experienced a decline, with a growth rate of -1.81% compared to the previous year. However, the compound annual growth rate (CAGR) from 2020 to 2024 stood at 6.39%. This dip in import momentum could be attributed to shifts in consumer preferences or changes in trade policies impacting market stability.
Australia Textured Butter Market Overview
Textured butter is gaining popularity in Australia as consumers seek high-quality dairy products with improved consistency and spreadability. The food industry is increasingly incorporating textured butter in bakery products and gourmet dishes. Innovations in processing techniques and flavor enhancement are driving market demand, along with growing consumer awareness of artisanal and premium dairy products.
Trends of the market
Australia`s textured butter market is growing as consumers seek premium dairy products with better spreadability and consistent texture. Artisan and organic textured butter is becoming increasingly popular, with small-batch producers gaining traction in retail. The demand is being driven by both the home cooking trend and the expansion of the gourmet food sector, especially in cafes and bakeries.
Challenges of the market
The textured butter market in Australia is challenged by fluctuating dairy prices and limited consumer awareness about the benefits of textured variants over traditional butter. Regulatory compliance regarding additives and processing methods also restricts flexibility in product innovation. Moreover, the niche nature of the market means lower economies of scale, which in turn drives up production and retail costs, deterring broader market penetration.
Investment opportunities in the Market
Investments in boutique dairy processing units and value-added dairy products like textured butter are seeing high interest. There`s an opportunity to back brands emphasizing clean labels, organic certification, and artisanal production. Additionally, supply chain investments in cold storage and premium retail channels can support market expansion.
Government Policy of the market
Food standards and dairy regulations in Australia, overseen by FSANZ and the Department of Agriculture, significantly influence the textured butter market. These policies govern permissible additives, labeling standards, and nutritional claims. While these regulations ensure product quality and safety, they also limit the scope for differentiation and innovation. There is currently no specific policy initiative promoting textured butter or its niche segments, meaning the market relies more on consumer trends and private sector innovation than on government-led support.
Key Highlights of the Report:
- Australia Textured Butter Market Outlook
- Market Size of Australia Textured Butter Market, 2025
- Forecast of Australia Textured Butter Market, 2032
- Historical Data and Forecast of Australia Textured Butter Revenues & Volume for the Period 2022 - 2032F
- Australia Textured Butter Market Trend Evolution
- Australia Textured Butter Market Drivers and Challenges
- Australia Textured Butter Price Trends
- Australia Textured Butter Porter's Five Forces
- Australia Textured Butter Industry Life Cycle
- Historical Data and Forecast of Australia Textured Butter Market Revenues & Volume By Type for the Period 2022 - 2032F
- Historical Data and Forecast of Australia Textured Butter Market Revenues & Volume By Organic Butter for the Period 2022 - 2032F
- Historical Data and Forecast of Australia Textured Butter Market Revenues & Volume By Conventional Butter for the Period 2022 - 2032F
- Historical Data and Forecast of Australia Textured Butter Market Revenues & Volume By Distribution Channel for the Period 2022 - 2032F
- Historical Data and Forecast of Australia Textured Butter Market Revenues & Volume By Online Sales for the Period 2022 - 2032F
- Historical Data and Forecast of Australia Textured Butter Market Revenues & Volume By Offline Retail for the Period 2022 - 2032F
- Australia Textured Butter Import Export Trade Statistics
- Market Opportunity Assessment By Type
- Market Opportunity Assessment By Distribution Channel
- Australia Textured Butter Top Companies Market Share
- Australia Textured Butter Competitive Benchmarking By Technical and Operational Parameters
- Australia Textured Butter Company Profiles
- Australia Textured Butter Key Strategic Recommendations
Australia Textured Butter Market (2026-2032): FAQs
6Wresearch actively monitors the Australia Textured Butter Market and publishes its comprehensive annual report, highlighting emerging trends, growth drivers, revenue analysis, and forecast outlook. Our insights help businesses to make data-backed strategic decisions with ongoing market dynamics. Our analysts track relevent industries related to the Australia Textured Butter Market, allowing our clients with actionable intelligence and reliable forecasts tailored to emerging regional needs.
Yes, we provide customisation as per your requirements. To learn more, feel free to contact us on sales@6wresearch.com
1 Executive Summary |
2 Introduction |
2.1 Key Highlights of the Report |
2.2 Report Description |
2.3 Market Scope & Segmentation |
2.4 Research Methodology |
2.5 Assumptions |
3 Australia Textured Butter Market Overview |
3.1 Australia Country Macro Economic Indicators |
3.2 Australia Textured Butter Market Revenues & Volume, 2022 & 2032F |
3.3 Australia Textured Butter Market - Industry Life Cycle |
3.4 Australia Textured Butter Market - Porter's Five Forces |
3.5 Australia Textured Butter Market Revenues & Volume Share, By Type, 2022 & 2032F |
3.6 Australia Textured Butter Market Revenues & Volume Share, By Distribution Channel, 2022 & 2032F |
4 Australia Textured Butter Market Dynamics |
4.1 Impact Analysis |
4.2 Market Drivers |
4.2.1 Increasing consumer demand for premium and gourmet food products |
4.2.2 Growing preference for natural and organic food ingredients |
4.2.3 Rising awareness about the health benefits of textured butter |
4.3 Market Restraints |
4.3.1 Fluctuating prices of raw materials like milk and cream |
4.3.2 Intense competition from other types of spreads and butters in the market |
4.3.3 Stringent regulations and standards related to food processing and labeling |
5 Australia Textured Butter Market Trends |
6 Australia Textured Butter Market, By Types |
6.1 Australia Textured Butter Market, By Type |
6.1.1 Overview and Analysis |
6.1.2 Australia Textured Butter Market Revenues & Volume, By Type, 2022 - 2032F |
6.1.3 Australia Textured Butter Market Revenues & Volume, By Organic Butter, 2022 - 2032F |
6.1.4 Australia Textured Butter Market Revenues & Volume, By Conventional Butter, 2022 - 2032F |
6.2 Australia Textured Butter Market, By Distribution Channel |
6.2.1 Overview and Analysis |
6.2.2 Australia Textured Butter Market Revenues & Volume, By Online Sales, 2022 - 2032F |
6.2.3 Australia Textured Butter Market Revenues & Volume, By Offline Retail, 2022 - 2032F |
7 Australia Textured Butter Market Import-Export Trade Statistics |
7.1 Australia Textured Butter Market Export to Major Countries |
7.2 Australia Textured Butter Market Imports from Major Countries |
8 Australia Textured Butter Market Key Performance Indicators |
8.1 Consumer feedback and satisfaction scores on texture, taste, and quality of textured butter |
8.2 Number of new product launches and innovations in the textured butter segment |
8.3 Percentage growth in the usage of textured butter in food service and hospitality industry |
9 Australia Textured Butter Market - Opportunity Assessment |
9.1 Australia Textured Butter Market Opportunity Assessment, By Type, 2022 & 2032F |
9.2 Australia Textured Butter Market Opportunity Assessment, By Distribution Channel, 2022 & 2032F |
10 Australia Textured Butter Market - Competitive Landscape |
10.1 Australia Textured Butter Market Revenue Share, By Companies, 2025 |
10.2 Australia Textured Butter Market Competitive Benchmarking, By Operating and Technical Parameters |
11 Company Profiles |
12 Recommendations |
13 Disclaimer |
Global Go To Market Strategy - 2030
Export potential enables firms to identify high-growth global markets with greater confidence by combining advanced trade intelligence with a structured quantitative methodology. The framework analyzes emerging demand trends and country-level import patterns while integrating macroeconomic and trade datasets such as GDP and population forecasts, bilateral import–export flows, tariff structures, elasticity differentials between developed and developing economies, geographic distance, and import demand projections. Using weighted trade values from 2020–2024 as the base period to project country-to-country export potential for 2030, these inputs are operationalized through calculated drivers such as gravity model parameters, tariff impact factors, and projected GDP per-capita growth. Through an analysis of hidden potentials, demand hotspots, and market conditions that are most favorable to success, this method enables firms to focus on target countries, maximize returns, and global expansion with data, backed by accuracy.
By factoring in the projected importer demand gap that is currently unmet and could be potential opportunity, it identifies the potential for the Exporter (Country) among 190 countries, against the general trade analysis, which identifies the biggest importer or exporter.
To discover high-growth global markets and optimize your business strategy:
Click Here
Pricing
- Single User License$ 1,995
- Department License$ 2,400
- Site License$ 3,120
- Global License$ 3,795

Leadership Perspectives from Industry Events
Search
Thought Leadership and Analyst Meet


Our Clients
6WResearch In News
- India Export Attractiveness Tracker 2026
- India Air Conditioner Market Set for Strong Rebound in 2026 After Weather-Led Correction and GST-Driven Recovery: 6Wresearch
- ADAS in India: How Automatic Emergency Braking, Blind Spot Detection & Driver Monitoring are Transforming Road Safety
- Doha a strategic location for EV manufacturing hub: IPA Qatar
- Demand for luxury TVs surging in the GCC, says Samsung
- Empowering Growth: The Thriving Journey of Bangladesh’s Cable Industry
Latest Reports
- Nicaragua RPG Gaming Market (2026-2032)
- New Zealand RPG Gaming Market (2026-2032)
- Netherlands RPG Gaming Market (2026-2032)
- Nauru RPG Gaming Market (2026-2032)
- Namibia RPG Gaming Market (2026-2032)
- Mozambique RPG Gaming Market (2026-2032)
- Montenegro RPG Gaming Market (2026-2032)
- Mongolia RPG Gaming Market (2026-2032)
- Monaco RPG Gaming Market (2026-2032)
- Micronesia RPG Gaming Market (2026-2032)
Industry Events and Analyst Meet

EV India Expo 2026

HIMTEX 2026

India Refining Summit 2026

India EV Show 2026

EV tech India Expo 2026
Whitepaper
- Middle East & Africa Commercial Security Market Click here to view more.
- Middle East & Africa Fire Safety Systems & Equipment Market Click here to view more.
- GCC Drone Market Click here to view more.
- Middle East Lighting Fixture Market Click here to view more.
- GCC Physical & Perimeter Security Market Click here to view more.