Australia V-belts Market (2026-2032) Outlook | Companies, Size, Share, Trends, Value, Forecast, Revenue, Analysis, Industry & Growth
Market Forecast By Material Used (Rubber, Polymer, Neoprene, Urethane Synthetic Materials), By Types (Heavy Duty), By End-use Industries (Paper And Pulp, Cement, Power And Energy, Food And Beverage, Agricultural, Automotive, Metals And Mining) And Competitive Landscape
| Product Code: ETC351155 | Publication Date: Aug 2022 | Updated Date: Mar 2026 | Product Type: Market Research Report | |
| Publisher: 6Wresearch | Author: Shubham Padhi | No. of Pages: 75 | No. of Figures: 35 | No. of Tables: 20 |
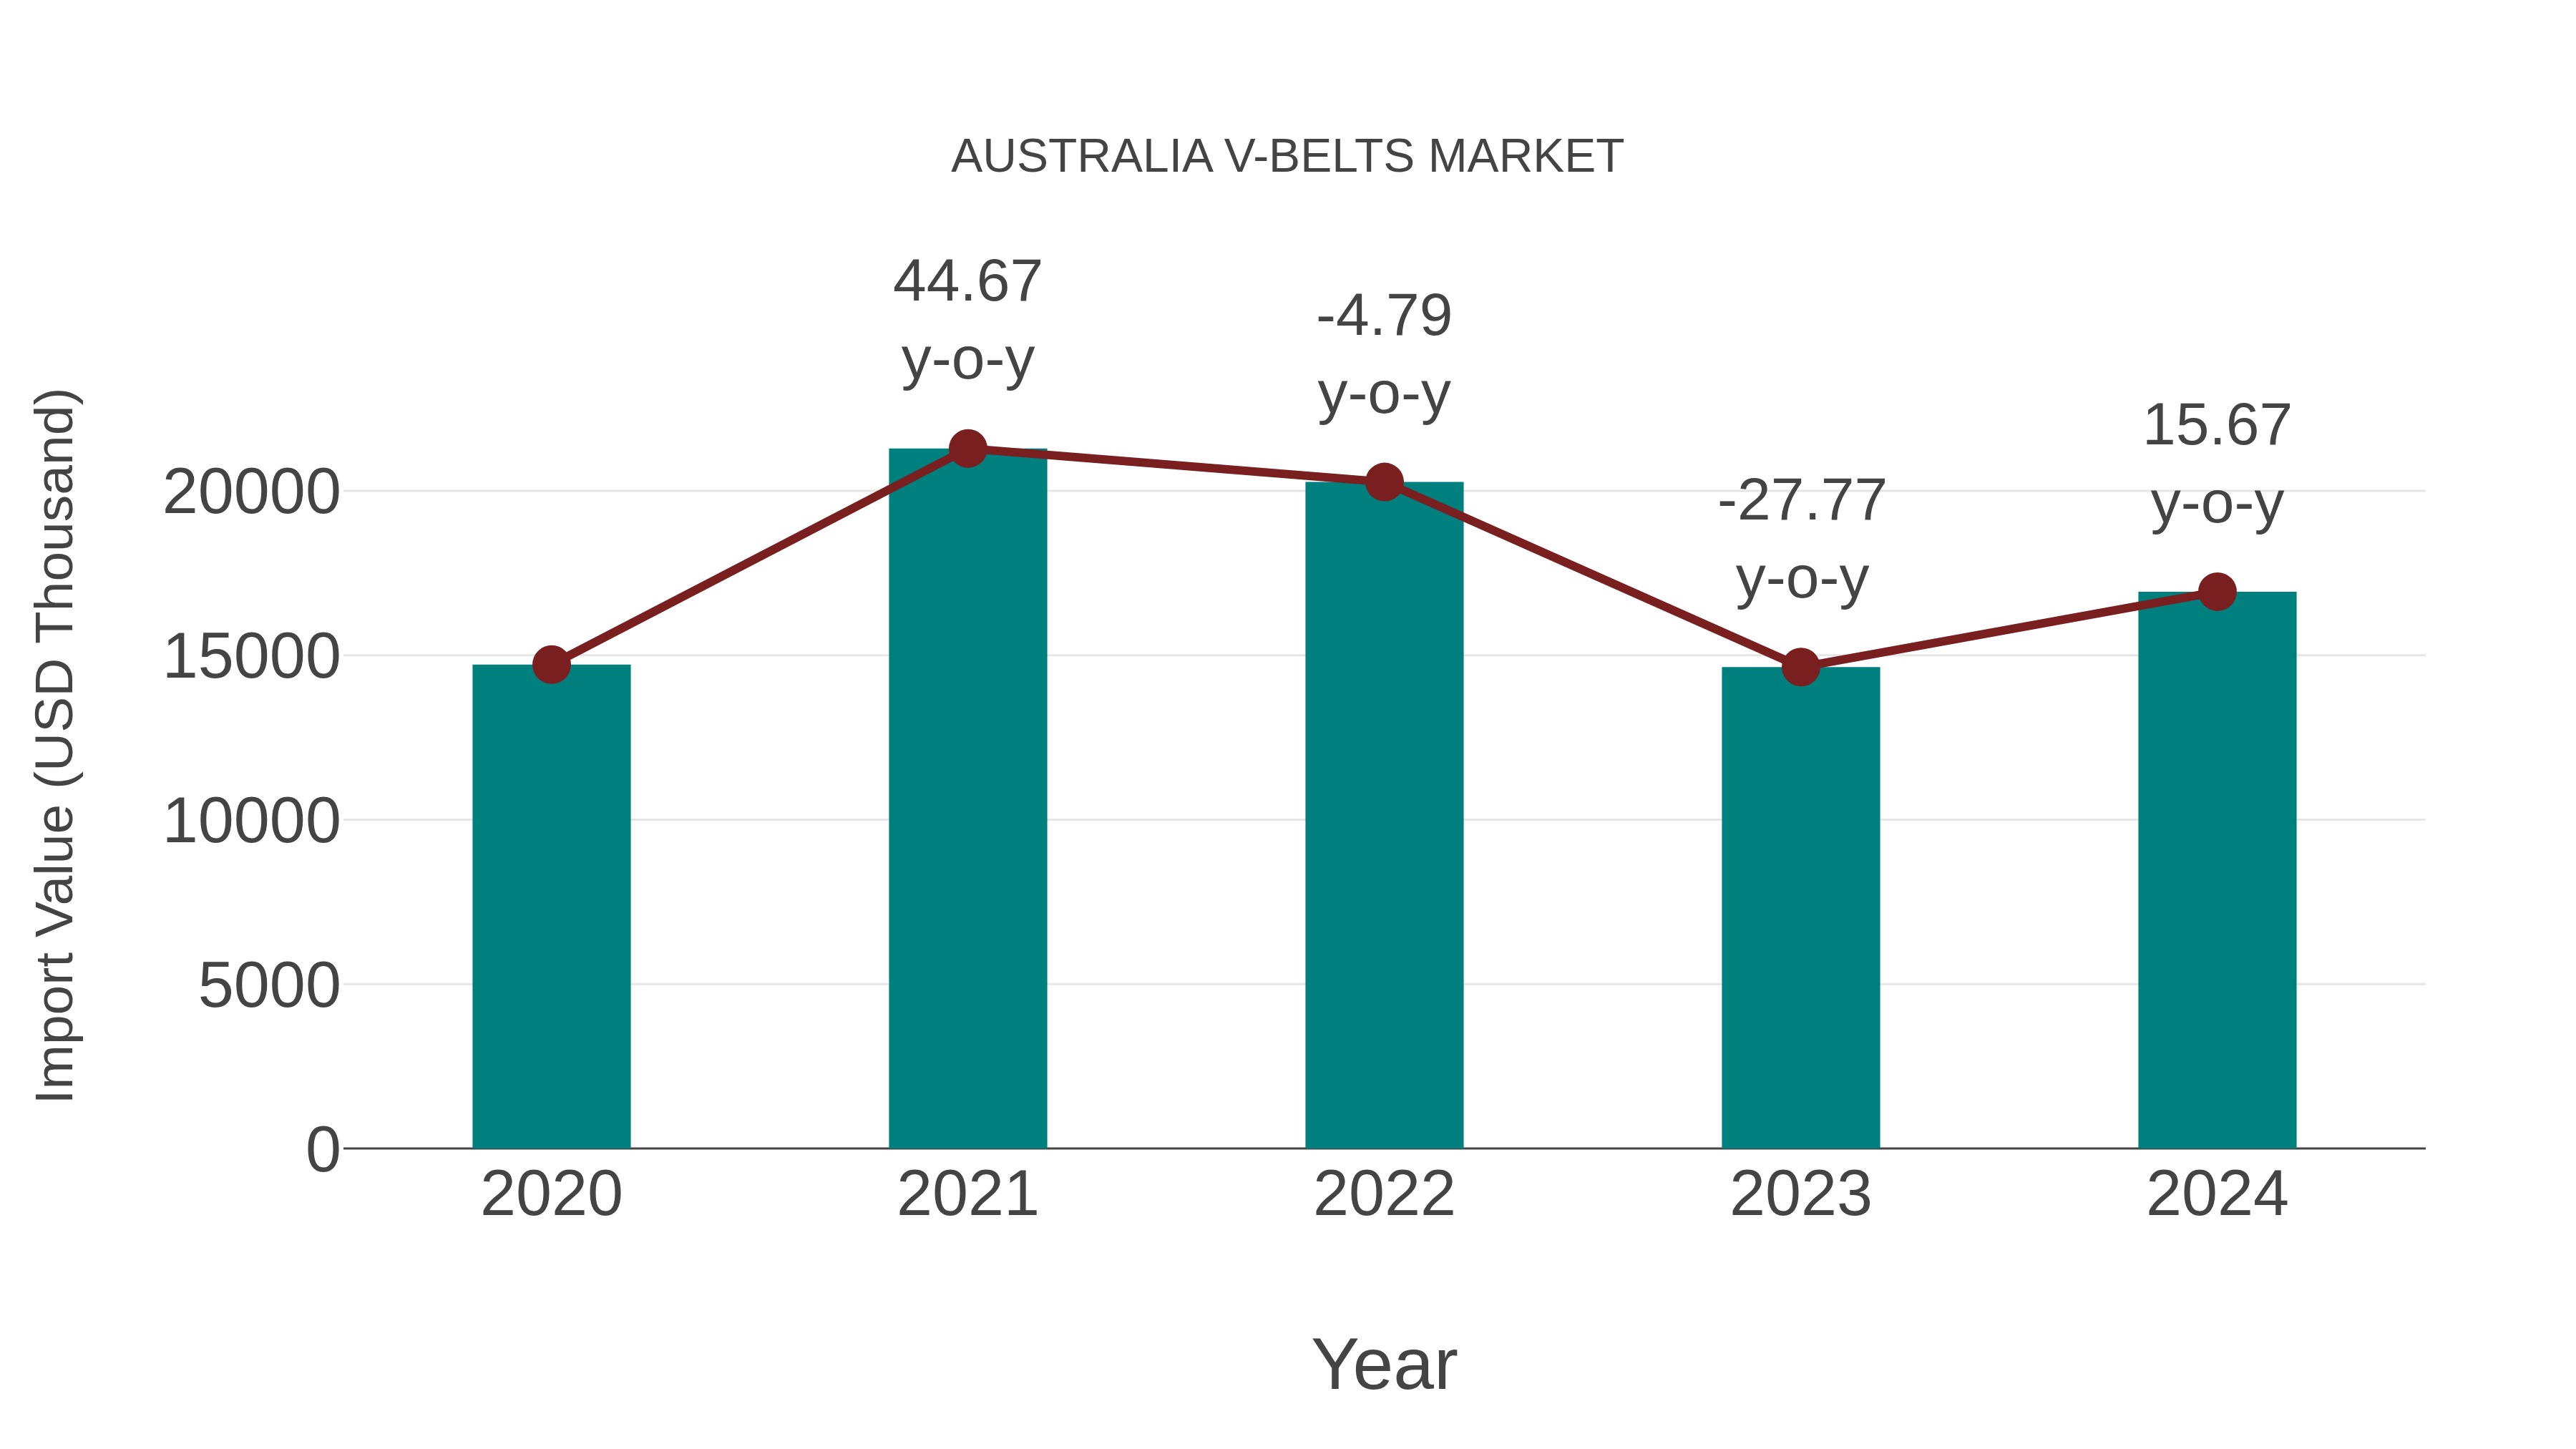
Australia V-belts Market: Import Trend Analysis
Australia`s import trend for V-belts in 2024 exhibited a growth rate of 15.67% compared to the previous year, with a compound annual growth rate (CAGR) of 3.57% from 2020 to 2024. This notable increase in imports can be attributed to a shift in demand towards higher-quality V-belts, indicating a potential market stability and evolving consumer preferences.
Australia V Belts Market Overview
V belts are essential components in various industrial machinery and equipment for power transmission purposes. In Australia, the v belts market caters to diverse sectors, including manufacturing, agriculture, and automotive. The market growth is driven by the expansion of these industries and the need for efficient power transmission solutions.
Drivers of the market
The V belts market in Australia is experiencing steady growth, buoyed by the expanding industrial and automotive sectors. V belts, known for their reliability and efficiency in power transmission applications, are widely utilized in machinery, vehicles, and equipment across diverse industries. The market is benefiting from technological advancements leading to the development of high-performance V belts capable of operating under demanding conditions. Moreover, the ongoing investments in infrastructure and manufacturing sectors are creating lucrative opportunities for V belt manufacturers and suppliers in Australia.
Challenges of the market
The V-belts market in Australia faces challenges due to the shift towards more efficient and durable belt options such as timing belts and synchronous belts. Additionally, fluctuations in raw material prices and competition from imported products present obstacles to market growth.
Government Policy of the market
The Australia government implements policies aimed at ensuring the quality and safety of V belts used in various industrial applications. Regulatory measures may include standards for manufacturing processes, product testing requirements, and labeling regulations to inform consumers about product specifications and performance. Moreover, initiatives promoting innovation in V belt technology or supporting local manufacturing capabilities could be part of government strategies.
Key Highlights of the Report:
- Australia V-belts Market Outlook
- Market Size of Australia V-belts Market, 2025
- Forecast of Australia V-belts Market, 2032
- Historical Data and Forecast of Australia V-belts Revenues & Volume for the Period 2022-2032F
- Australia V-belts Market Trend Evolution
- Australia V-belts Market Drivers and Challenges
- Australia V-belts Price Trends
- Australia V-belts Porter's Five Forces
- Australia V-belts Industry Life Cycle
- Historical Data and Forecast of Australia V-belts Market Revenues & Volume By Material Used for the Period 2022-2032F
- Historical Data and Forecast of Australia V-belts Market Revenues & Volume By Rubber for the Period 2022-2032F
- Historical Data and Forecast of Australia V-belts Market Revenues & Volume By Polymer for the Period 2022-2032F
- Historical Data and Forecast of Australia V-belts Market Revenues & Volume By Neoprene for the Period 2022-2032F
- Historical Data and Forecast of Australia V-belts Market Revenues & Volume By Urethane Synthetic Materials for the Period 2022-2032F
- Historical Data and Forecast of Australia V-belts Market Revenues & Volume By Types for the Period 2022-2032F
- Historical Data and Forecast of Australia V-belts Market Revenues & Volume By Heavy Duty for the Period 2022-2032F
- Historical Data and Forecast of Australia V-belts Market Revenues & Volume By End-use Industries for the Period 2022-2032F
- Historical Data and Forecast of Australia V-belts Market Revenues & Volume By Paper And Pulp for the Period 2022-2032F
- Historical Data and Forecast of Australia V-belts Market Revenues & Volume By Cement for the Period 2022-2032F
- Historical Data and Forecast of Australia V-belts Market Revenues & Volume By Power And Energy for the Period 2022-2032F
- Historical Data and Forecast of Australia V-belts Market Revenues & Volume By Food And Beverage for the Period 2022-2032F
- Historical Data and Forecast of Australia V-belts Market Revenues & Volume By Agricultural for the Period 2022-2032F
- Historical Data and Forecast of Australia V-belts Market Revenues & Volume By Automotive for the Period 2022-2032F
- Historical Data and Forecast of Australia V-belts Market Revenues & Volume By Metals And Mining for the Period 2022-2032F
- Australia V-belts Import Export Trade Statistics
- Market Opportunity Assessment By Material Used
- Market Opportunity Assessment By Types
- Market Opportunity Assessment By End-use Industries
- Australia V-belts Top Companies Market Share
- Australia V-belts Competitive Benchmarking By Technical and Operational Parameters
- Australia V-belts Company Profiles
- Australia V-belts Key Strategic Recommendations
Australia V-belts Market (2026-2032): FAQs
6Wresearch actively monitors the Australia V-belts Market and publishes its comprehensive annual report, highlighting emerging trends, growth drivers, revenue analysis, and forecast outlook. Our insights help businesses to make data-backed strategic decisions with ongoing market dynamics. Our analysts track relevent industries related to the Australia V-belts Market, allowing our clients with actionable intelligence and reliable forecasts tailored to emerging regional needs.
Yes, we provide customisation as per your requirements. To learn more, feel free to contact us on sales@6wresearch.com
1 Executive Summary |
2 Introduction |
2.1 Key Highlights of the Report |
2.2 Report Description |
2.3 Market Scope & Segmentation |
2.4 Research Methodology |
2.5 Assumptions |
3 Australia V-belts Market Overview |
3.1 Australia Country Macro Economic Indicators |
3.2 Australia V-belts Market Revenues & Volume, 2022 & 2032F |
3.3 Australia V-belts Market - Industry Life Cycle |
3.4 Australia V-belts Market - Porter's Five Forces |
3.5 Australia V-belts Market Revenues & Volume Share, By Material Used, 2022 & 2032F |
3.6 Australia V-belts Market Revenues & Volume Share, By Types, 2022 & 2032F |
3.7 Australia V-belts Market Revenues & Volume Share, By End-use Industries, 2022 & 2032F |
4 Australia V-belts Market Dynamics |
4.1 Impact Analysis |
4.2 Market Drivers |
4.2.1 Increasing industrialization and automation in Australia leading to higher demand for v-belts in various sectors. |
4.2.2 Growth in the agriculture and mining industries driving the need for v-belts in machinery and equipment. |
4.2.3 Technological advancements leading to improvements in v-belt efficiency and durability. |
4.3 Market Restraints |
4.3.1 Fluctuating raw material prices impacting the manufacturing cost of v-belts. |
4.3.2 Competition from alternative belt technologies such as synchronous belts affecting market growth. |
4.3.3 Economic uncertainties and market volatility impacting investment decisions in industries using v-belts. |
5 Australia V-belts Market Trends |
6 Australia V-belts Market, By Types |
6.1 Australia V-belts Market, By Material Used |
6.1.1 Overview and Analysis |
6.1.2 Australia V-belts Market Revenues & Volume, By Material Used, 2022-2032F |
6.1.3 Australia V-belts Market Revenues & Volume, By Rubber, 2022-2032F |
6.1.4 Australia V-belts Market Revenues & Volume, By Polymer, 2022-2032F |
6.1.5 Australia V-belts Market Revenues & Volume, By Neoprene, 2022-2032F |
6.1.6 Australia V-belts Market Revenues & Volume, By Urethane Synthetic Materials, 2022-2032F |
6.2 Australia V-belts Market, By Types |
6.2.1 Overview and Analysis |
6.2.2 Australia V-belts Market Revenues & Volume, By Heavy Duty, 2022-2032F |
6.3 Australia V-belts Market, By End-use Industries |
6.3.1 Overview and Analysis |
6.3.2 Australia V-belts Market Revenues & Volume, By Paper And Pulp, 2022-2032F |
6.3.3 Australia V-belts Market Revenues & Volume, By Cement, 2022-2032F |
6.3.4 Australia V-belts Market Revenues & Volume, By Power And Energy, 2022-2032F |
6.3.5 Australia V-belts Market Revenues & Volume, By Food And Beverage, 2022-2032F |
6.3.6 Australia V-belts Market Revenues & Volume, By Agricultural, 2022-2032F |
6.3.7 Australia V-belts Market Revenues & Volume, By Automotive, 2022-2032F |
7 Australia V-belts Market Import-Export Trade Statistics |
7.1 Australia V-belts Market Export to Major Countries |
7.2 Australia V-belts Market Imports from Major Countries |
8 Australia V-belts Market Key Performance Indicators |
8.1 Average lifespan of v-belts in different applications. |
8.2 Adoption rate of energy-efficient v-belts in industries. |
8.3 Percentage of v-belt failures due to improper maintenance practices. |
9 Australia V-belts Market - Opportunity Assessment |
9.1 Australia V-belts Market Opportunity Assessment, By Material Used, 2022 & 2032F |
9.2 Australia V-belts Market Opportunity Assessment, By Types, 2022 & 2032F |
9.3 Australia V-belts Market Opportunity Assessment, By End-use Industries, 2022 & 2032F |
10 Australia V-belts Market - Competitive Landscape |
10.1 Australia V-belts Market Revenue Share, By Companies, 2025 |
10.2 Australia V-belts Market Competitive Benchmarking, By Operating and Technical Parameters |
11 Company Profiles |
12 Recommendations |
13 Disclaimer |
Global Go To Market Strategy - 2030
Export potential enables firms to identify high-growth global markets with greater confidence by combining advanced trade intelligence with a structured quantitative methodology. The framework analyzes emerging demand trends and country-level import patterns while integrating macroeconomic and trade datasets such as GDP and population forecasts, bilateral import–export flows, tariff structures, elasticity differentials between developed and developing economies, geographic distance, and import demand projections. Using weighted trade values from 2020–2024 as the base period to project country-to-country export potential for 2030, these inputs are operationalized through calculated drivers such as gravity model parameters, tariff impact factors, and projected GDP per-capita growth. Through an analysis of hidden potentials, demand hotspots, and market conditions that are most favorable to success, this method enables firms to focus on target countries, maximize returns, and global expansion with data, backed by accuracy.
By factoring in the projected importer demand gap that is currently unmet and could be potential opportunity, it identifies the potential for the Exporter (Country) among 190 countries, against the general trade analysis, which identifies the biggest importer or exporter.
To discover high-growth global markets and optimize your business strategy:
Click Here
Pricing
- Single User License$ 1,995
- Department License$ 2,400
- Site License$ 3,120
- Global License$ 3,795

Leadership Perspectives from Industry Events
Search
Thought Leadership and Analyst Meet


Our Clients
6WResearch In News
- India Air Conditioner Market Set for Strong Rebound in 2026 After Weather-Led Correction and GST-Driven Recovery: 6Wresearch
- ADAS in India: How Automatic Emergency Braking, Blind Spot Detection & Driver Monitoring are Transforming Road Safety
- Doha a strategic location for EV manufacturing hub: IPA Qatar
- Demand for luxury TVs surging in the GCC, says Samsung
- Empowering Growth: The Thriving Journey of Bangladesh’s Cable Industry
- Demand for luxury TVs surging in the GCC, says Samsung
Latest Reports
- Nicaragua RPG Gaming Market (2026-2032)
- New Zealand RPG Gaming Market (2026-2032)
- Netherlands RPG Gaming Market (2026-2032)
- Nauru RPG Gaming Market (2026-2032)
- Namibia RPG Gaming Market (2026-2032)
- Mozambique RPG Gaming Market (2026-2032)
- Montenegro RPG Gaming Market (2026-2032)
- Mongolia RPG Gaming Market (2026-2032)
- Monaco RPG Gaming Market (2026-2032)
- Micronesia RPG Gaming Market (2026-2032)
Industry Events and Analyst Meet

EV India Expo 2026

HIMTEX 2026

India Refining Summit 2026

India EV Show 2026

EV tech India Expo 2026
Whitepaper
- Middle East & Africa Commercial Security Market Click here to view more.
- Middle East & Africa Fire Safety Systems & Equipment Market Click here to view more.
- GCC Drone Market Click here to view more.
- Middle East Lighting Fixture Market Click here to view more.
- GCC Physical & Perimeter Security Market Click here to view more.