Azerbaijan Barbed Wire Market (2026-2032) | COVID-19 IMPACT, Growth, Industry, Size, Share, Companies, Trends, Analysis, Revenue, Forecast, Outlook & Value
Market Forecast By Product Types (Long Blade Profile, Medium Blade Profile, Short Blade Profile), By Applications (Construction, Farmland, Industrial Use, Transportation, Others) And Competitive Landscape
| Product Code: ETC004327 | Publication Date: Sep 2020 | Product Type: Report | ||
| Publisher: 6Wresearch | Author: Ravi Bhandari | No. of Pages: 70 | No. of Figures: 35 | No. of Tables: 5 |
Azerbaijan Barbed Wire Market Summary
The azerbaijan barbed wire market was estimated at USD 790 Million in 2025 and is projected to reach USD 1485 Million by 2032, growing at a CAGR of 10.9% from 2026 to 2032.
Azerbaijan Barbed Wire Market Growth Rate Analysis (2021-2032)
The Azerbaijan barbed wire market is poised for significant growth, reflecting an upward trend fueled by increasing investments in infrastructure and heightened security concerns. Following an impressive growth rate of 8.9% in 2021, the market accelerated to 9.3% in 2022 and continues to rise, reaching 9.7% in 2023. This growth is driven by expanding industrial activities and a surge in consumer demand for reliable security solutions, with projections indicating rates of 10.1% in 2024 to 12.9% by 2031. Additionally, digitalization efforts are streamlining production, while advances in technology enhance product durability, further boosting market potential. Such dynamics position Azerbaijan's barbed wire sector as a vibrant component of the regional security landscape.
Azerbaijan Barbed Wire Market Year-wise Growth Rate and Key Drivers
This graph highlights how the Azerbaijan Barbed Wire Market has steadily grown over the past five years, supported by major growth factors.
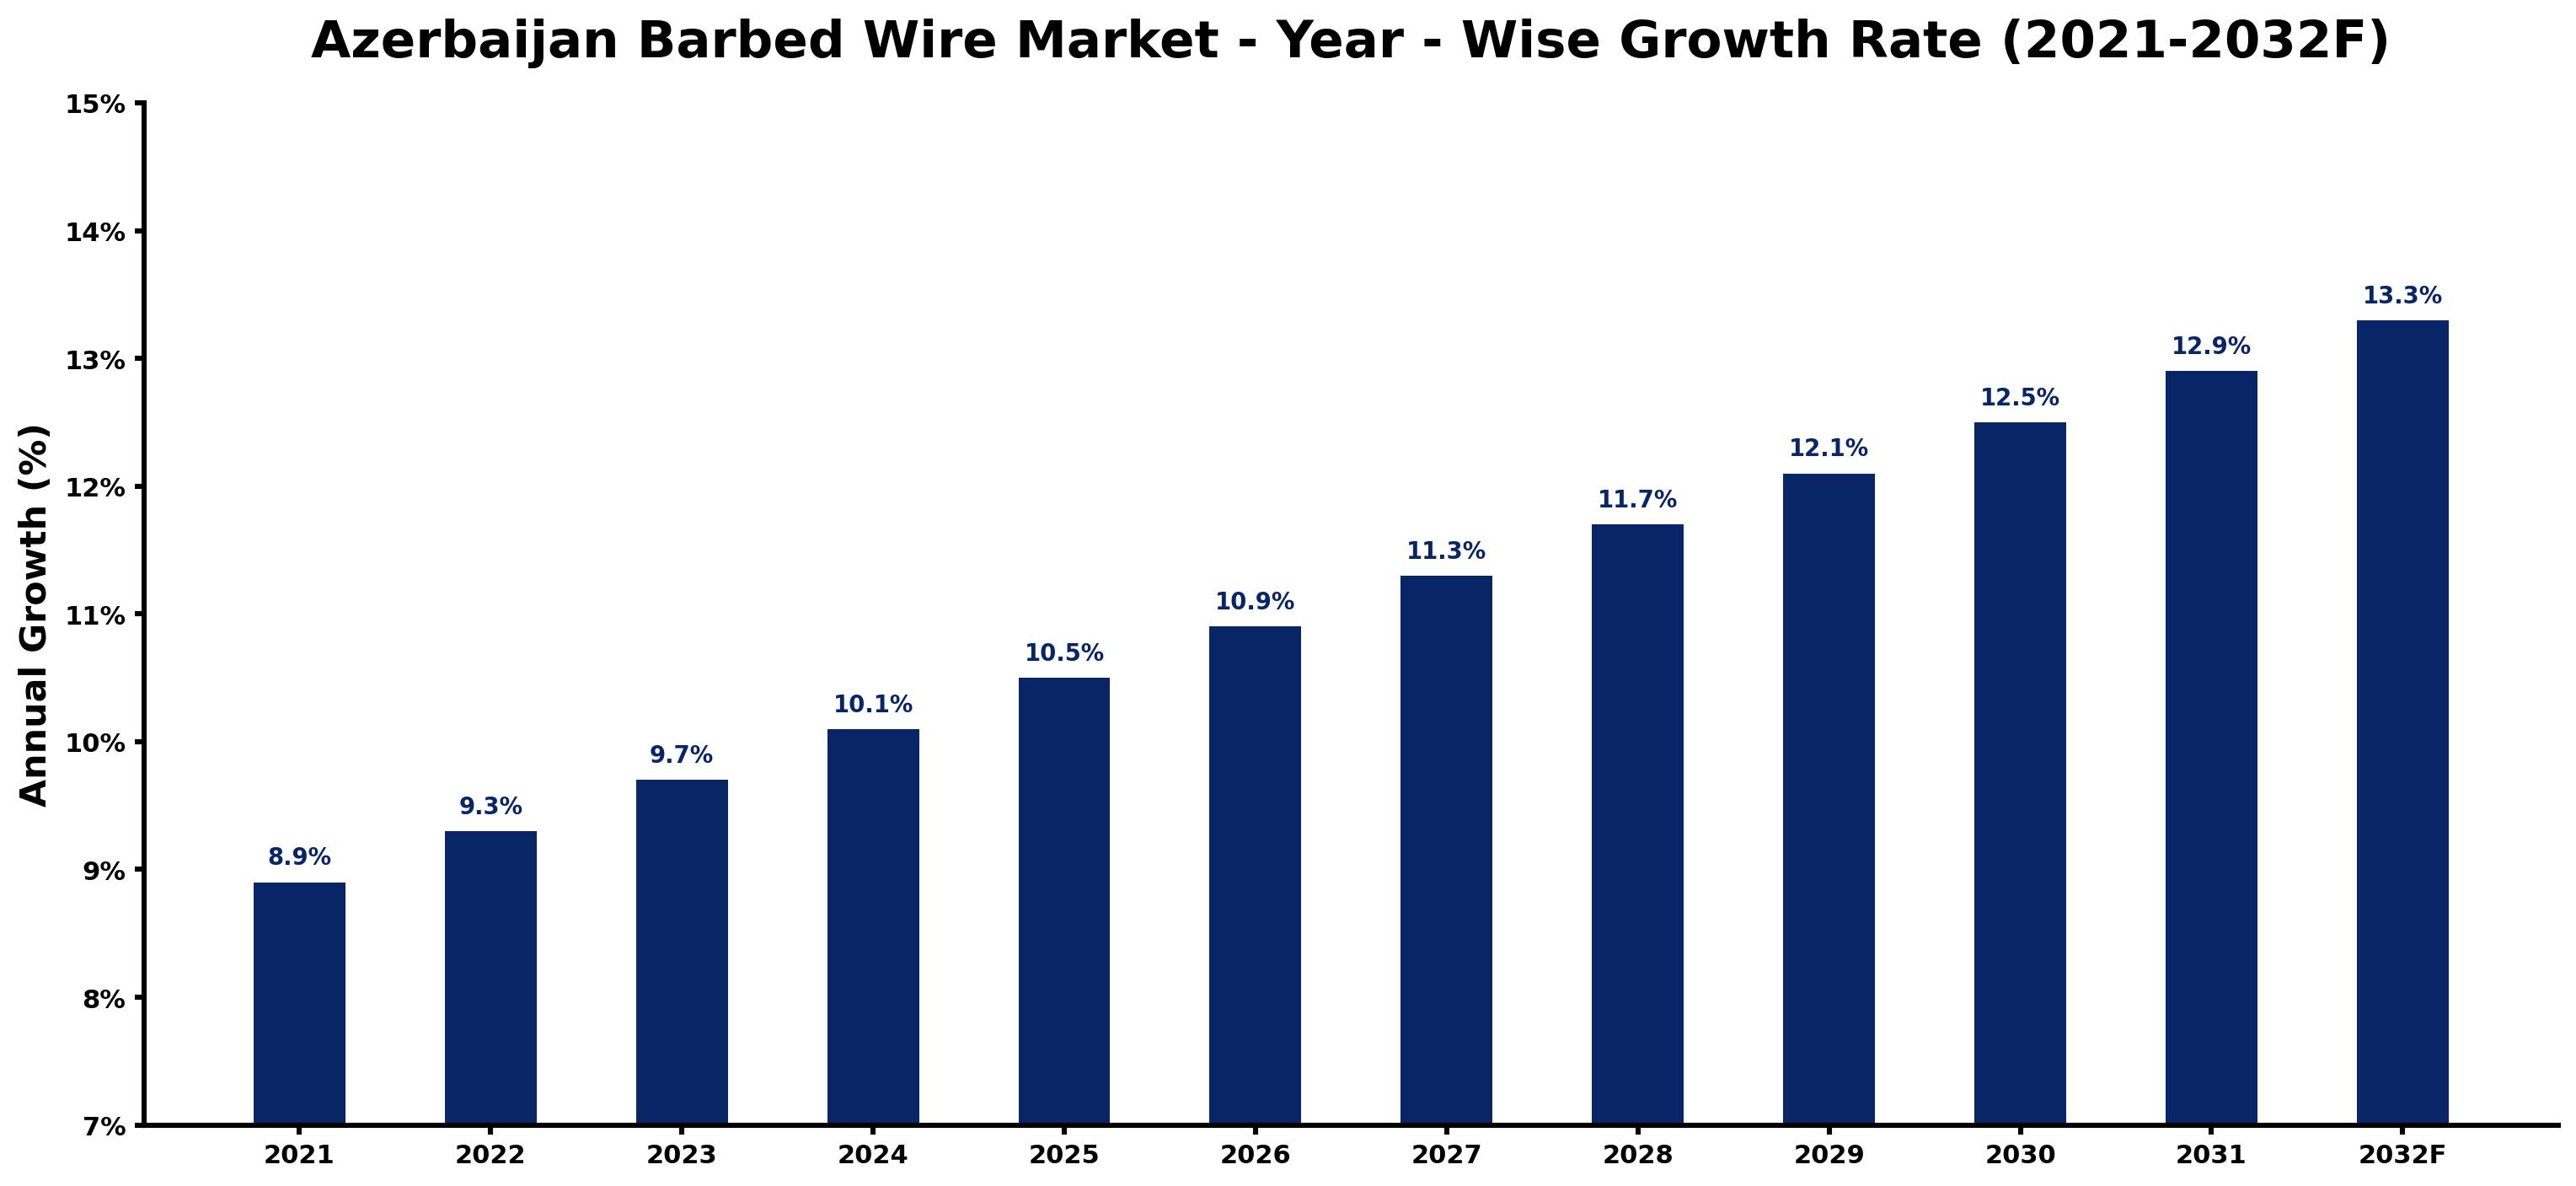
The table below presents the year‑wise growth rates along with the key drivers influencing the market
| Year | Growth Rate | Major Drivers |
| 2021 | 8.9% | Barbed wire demand in Azerbaijan aligns with agricultural expansion in rural areas. |
| 2022 | 9.3% | Construction activities linked to infrastructure projects require durable security solutions. |
| 2023 | 9.7% | Local manufacturers start producing cost-effective barbed wire, enhancing market competitiveness. |
| 2024 | 10.1% | Rising awareness around livestock protection drives interest in robust fencing options. |
| 2025 | 10.5% | Urbanization trends prompt higher security needs, boosting barbed wire installations. |
| 2026 | 10.9% | Regional trade agreements improve supply chain efficiencies for barbed wire producers. |
| 2027 | 11.3% | Technological advancements in wire manufacturing lead to stronger, lighter products. |
| 2028 | 11.7% | Increased investments in border security create an uptick in barbed wire usage. |
| 2029 | 12.1% | The agricultural sector's modernization emphasizes the importance of reliable fencing solutions. |
| 2030 | 12.5% | Eco-friendly production methods gain traction, attracting environmentally conscious buyers. |
| 2031 | 12.9% | Barbed wire market benefits from diversification into new sectors like renewable energy. |
| 2032 | 13.3% | Enhanced distribution networks facilitate easier access to quality barbed wire products. |
Note - Market size estimations and growth projections presented in this report are based on 6Wresearch’s advanced forecasting approach, validated with industry datasets as of June 2026.
Key Highlights of the Report:
- Azerbaijan Barbed Wire Market Overview
- Azerbaijan Barbed Wire Market Outlook
- Market Size of Azerbaijan Barbed Wire Market, 2025
- Forecast of Azerbaijan Barbed Wire Market, 2032F
- Historical Data and Forecast of Azerbaijan Barbed Wire Revenues & Volume for the Period 2022-2032F
- Azerbaijan Barbed Wire Market Trend Evolution
- Azerbaijan Barbed Wire Market Drivers and Challenges
- Azerbaijan Barbed Wire Price Trends
- Azerbaijan Barbed Wire Porter's Five Forces
- Azerbaijan Barbed Wire Industry Life Cycle
- Historical Data and Forecast of Azerbaijan Barbed Wire Market Revenues & Volume By Product Types for the Period 2022-2032F
- Historical Data and Forecast of Azerbaijan Barbed Wire Market Revenues & Volume By Long Blade Profile for the Period 2022-2032F
- Historical Data and Forecast of Azerbaijan Barbed Wire Market Revenues & Volume By Medium Blade Profile for the Period 2022-2032F
- Historical Data and Forecast of Azerbaijan Barbed Wire Market Revenues & Volume By Short Blade Profile for the Period 2022-2032F
- Historical Data and Forecast of Azerbaijan Barbed Wire Market Revenues & Volume By Applications for the Period 2022-2032F
- Historical Data and Forecast of Azerbaijan Barbed Wire Market Revenues & Volume By Construction for the Period 2022-2032F
- Historical Data and Forecast of Azerbaijan Barbed Wire Market Revenues & Volume By Farmland for the Period 2022-2032F
- Historical Data and Forecast of Azerbaijan Barbed Wire Market Revenues & Volume By Industrial Use for the Period 2022-2032F
- Historical Data and Forecast of Azerbaijan Barbed Wire Market Revenues & Volume By Transportation for the Period 2022-2032F
- Historical Data and Forecast of Azerbaijan Barbed Wire Market Revenues & Volume By Others for the Period 2022-2032F
- Azerbaijan Barbed Wire Import Export Trade Statistics
- Market Opportunity Assessment By Product Types
- Market Opportunity Assessment By Applications
- Azerbaijan Barbed Wire Top Companies Market Share
- Azerbaijan Barbed Wire Competitive Benchmarking By Technical and Operational Parameters
- Azerbaijan Barbed Wire Company Profiles
- Azerbaijan Barbed Wire Key Strategic Recommendations
Frequently Asked Questions About the Market Study (FAQs):
6Wresearch actively monitors the Azerbaijan Barbed Wire Market and publishes its comprehensive annual report, highlighting emerging trends, growth drivers, revenue analysis, and forecast outlook. Our insights help businesses to make data-backed strategic decisions with ongoing market dynamics. Our analysts track relevent industries related to the Azerbaijan Barbed Wire Market, allowing our clients with actionable intelligence and reliable forecasts tailored to emerging regional needs.
Yes, we provide customisation as per your requirements. To learn more, feel free to contact us on sales@6wresearch.com
| Table of Contents |
| 1. Executive Summary |
| 2. Introduction |
| 2.1. Key Highlights of the Report |
| 2.2. Report Description |
| 2.3. Market Scope & Segmentation |
| 2.4. Research Methodology |
| 2.5. Assumptions |
| 3. Azerbaijan Barbed Wire Market Overview |
| 3.1. Azerbaijan Country Macro Economic Indicators |
| 3.2. Azerbaijan Barbed Wire Market Revenues & Volume, 2022 & 2032F |
| 3.3. Azerbaijan Barbed Wire Market - Industry Life Cycle |
| 3.4. Azerbaijan Barbed Wire Market - Porter's Five Forces |
| 3.5. Azerbaijan Barbed Wire Market Revenues & Volume Share, By Product Types, 2022 & 2032F |
| 3.6. Azerbaijan Barbed Wire Market Revenues & Volume Share, By Applications, 2022 & 2032F |
| 4. Azerbaijan Barbed Wire Market Dynamics |
| 4.1. Impact Analysis |
| 4.2. Market Drivers |
| 4.3. Market Restraints |
| 5. Azerbaijan Barbed Wire Market Trends |
| 6. Azerbaijan Barbed Wire Market, By Types |
| 6.1. Azerbaijan Barbed Wire Market, By Product Types |
| 6.1.1 Overview and Analysis |
| 6.1.2. Azerbaijan Barbed Wire Market Revenues & Volume, By Product Types, 2022-2032F |
| 6.1.3. Azerbaijan Barbed Wire Market Revenues & Volume, By Long Blade Profile, 2022-2032F |
| 6.1.4. Azerbaijan Barbed Wire Market Revenues & Volume, By Medium Blade Profile, 2022-2032F |
| 6.1.5. Azerbaijan Barbed Wire Market Revenues & Volume, By Short Blade Profile, 2022-2032F |
| 6.2. Azerbaijan Barbed Wire Market, By Applications |
| 6.2.1. Overview and Analysis |
| 6.2.2. Azerbaijan Barbed Wire Market Revenues & Volume, By Construction, 2022-2032F |
| 6.2.3. Azerbaijan Barbed Wire Market Revenues & Volume, By Farmland, 2022-2032F |
| 6.2.4. Azerbaijan Barbed Wire Market Revenues & Volume, By Industrial Use, 2022-2032F |
| 6.2.5. Azerbaijan Barbed Wire Market Revenues & Volume, By Transportation, 2022-2032F |
| 6.2.6. Azerbaijan Barbed Wire Market Revenues & Volume, By Others, 2022-2032F |
| 7. Azerbaijan Barbed Wire Market Import-Export Trade Statistics |
| 7.1. Azerbaijan Barbed Wire Market Export to Major Countries |
| 7.2. Azerbaijan Barbed Wire Market Imports from Major Countries |
| 8. Azerbaijan Barbed Wire Market Key Performance Indicators |
| 9. Azerbaijan Barbed Wire Market - Opportunity Assessment |
| 9.1. Azerbaijan Barbed Wire Market Opportunity Assessment, By Product Types, 2022 & 2032F |
| 9.2. Azerbaijan Barbed Wire Market Opportunity Assessment, By Applications, 2022 & 2032F |
| 10. Azerbaijan Barbed Wire Market - Competitive Landscape |
| 10.1. Azerbaijan Barbed Wire Market Revenue Share, By Companies, 2025 |
| 10.2. Azerbaijan Barbed Wire Market Competitive Benchmarking, By Operating and Technical Parameters |
| 11. Company Profiles |
| 12. Recommendations |
| 13. Disclaimer |
Global Go To Market Strategy - 2030
Export potential enables firms to identify high-growth global markets with greater confidence by combining advanced trade intelligence with a structured quantitative methodology. The framework analyzes emerging demand trends and country-level import patterns while integrating macroeconomic and trade datasets such as GDP and population forecasts, bilateral import–export flows, tariff structures, elasticity differentials between developed and developing economies, geographic distance, and import demand projections. Using weighted trade values from 2020–2024 as the base period to project country-to-country export potential for 2030, these inputs are operationalized through calculated drivers such as gravity model parameters, tariff impact factors, and projected GDP per-capita growth. Through an analysis of hidden potentials, demand hotspots, and market conditions that are most favorable to success, this method enables firms to focus on target countries, maximize returns, and global expansion with data, backed by accuracy.
By factoring in the projected importer demand gap that is currently unmet and could be potential opportunity, it identifies the potential for the Exporter (Country) among 190 countries, against the general trade analysis, which identifies the biggest importer or exporter.
To discover high-growth global markets and optimize your business strategy:
Click Here
Pricing
- Single User License$ 1,995
- Department License$ 2,400
- Site License$ 3,120
- Global License$ 3,795

Leadership Perspectives from Industry Events
Search
Thought Leadership and Analyst Meet


Our Clients
6WResearch In News
- Doha a strategic location for EV manufacturing hub: IPA Qatar
- Demand for luxury TVs surging in the GCC, says Samsung
- Empowering Growth: The Thriving Journey of Bangladesh’s Cable Industry
- Demand for luxury TVs surging in the GCC, says Samsung
- Video call with a traditional healer? Once unthinkable, it’s now common in South Africa
- Intelligent Buildings To Smooth GCC’s Path To Net Zero
Latest Reports
- Taiwan Airport Wireless Infrastructure Market (2026-2032)
- Vietnam Airport Wireless Infrastructure Market (2026-2032)
- Thailand Airport Wireless Infrastructure Market (2026-2032)
- South Korea Airport Wireless Infrastructure Market (2026-2032)
- Romania Airport Wireless Infrastructure Market (2026-2032)
- Qatar Airport Wireless Infrastructure Market (2026-2032)
- Philippines Airport Wireless Infrastructure Market (2026-2032)
- Japan Airport Wireless Infrastructure Market (2026-2032)
- Taiwan Airport Winter Services Market (2026-2032)
- Vietnam Airport Winter Services Market (2026-2032)
Industry Events and Analyst Meet

HIMTEX 2026

India Refining Summit 2026

India EV Show 2026

EV tech India Expo 2026

Auto Tech Asia 2026
Whitepaper
- Middle East & Africa Commercial Security Market Click here to view more.
- Middle East & Africa Fire Safety Systems & Equipment Market Click here to view more.
- GCC Drone Market Click here to view more.
- Middle East Lighting Fixture Market Click here to view more.
- GCC Physical & Perimeter Security Market Click here to view more.