Azerbaijan Inorganic Pigments Market (2026-2032) Outlook | Trends, Revenue, Value, Share, Growth, Size, Companies, Analysis, Industry & Forecast
Market Forecast By Type (Titanium Dioxide, Iron Oxide, Cadmium, Carbon Blank, Lead Chromate, Chromium Oxide, Others), By Colour (Red, Yellow, Orange, Green, Blue, Black, White, Others), By Chemistry (Oxide, Silicate, Carbonate, Sulphate, Sulphide, Others), By Grade (Food Grade, Pharmaceutical Grade, Industrial Grade, Others), By Form (Powder, Liquid), By Application (Plastics, Paints & Coatings, Printing Inks, Glass & Ceramics, Cosmetics, Paper Industry, Food Industry, Others) And Competitive Landscape
| Product Code: ETC190569 | Publication Date: May 2022 | Updated Date: Jun 2026 | Product Type: Market Research Report | |
| Publisher: 6Wresearch | Author: Ravi Bhandari | No. of Pages: 60 | No. of Figures: 40 | No. of Tables: 7 |
Azerbaijan Inorganic Pigments Market Size, Share & Growth Rate
The Azerbaijan Inorganic Pigments Market was estimated at USD 1268 Million in 2025 and is projected to reach USD 2197 Million by 2032, growing at a CAGR of 8.2% from 2026 to 2032. This robust growth trajectory is primarily driven by the surging demand from the construction and automotive sectors, as well as the increasing emphasis on sustainable and durable materials. As infrastructure projects ramp up and manufacturing activities expand, the appetite for high-quality inorganic pigments continues to rise, reinforcing the market's growth potential.
Azerbaijan Inorganic Pigments Market Year-wise Growth Rate and Key Drivers
This graph highlights how the Azerbaijan Inorganic Pigments Market has steadily grown over the years, supported by major growth factors.
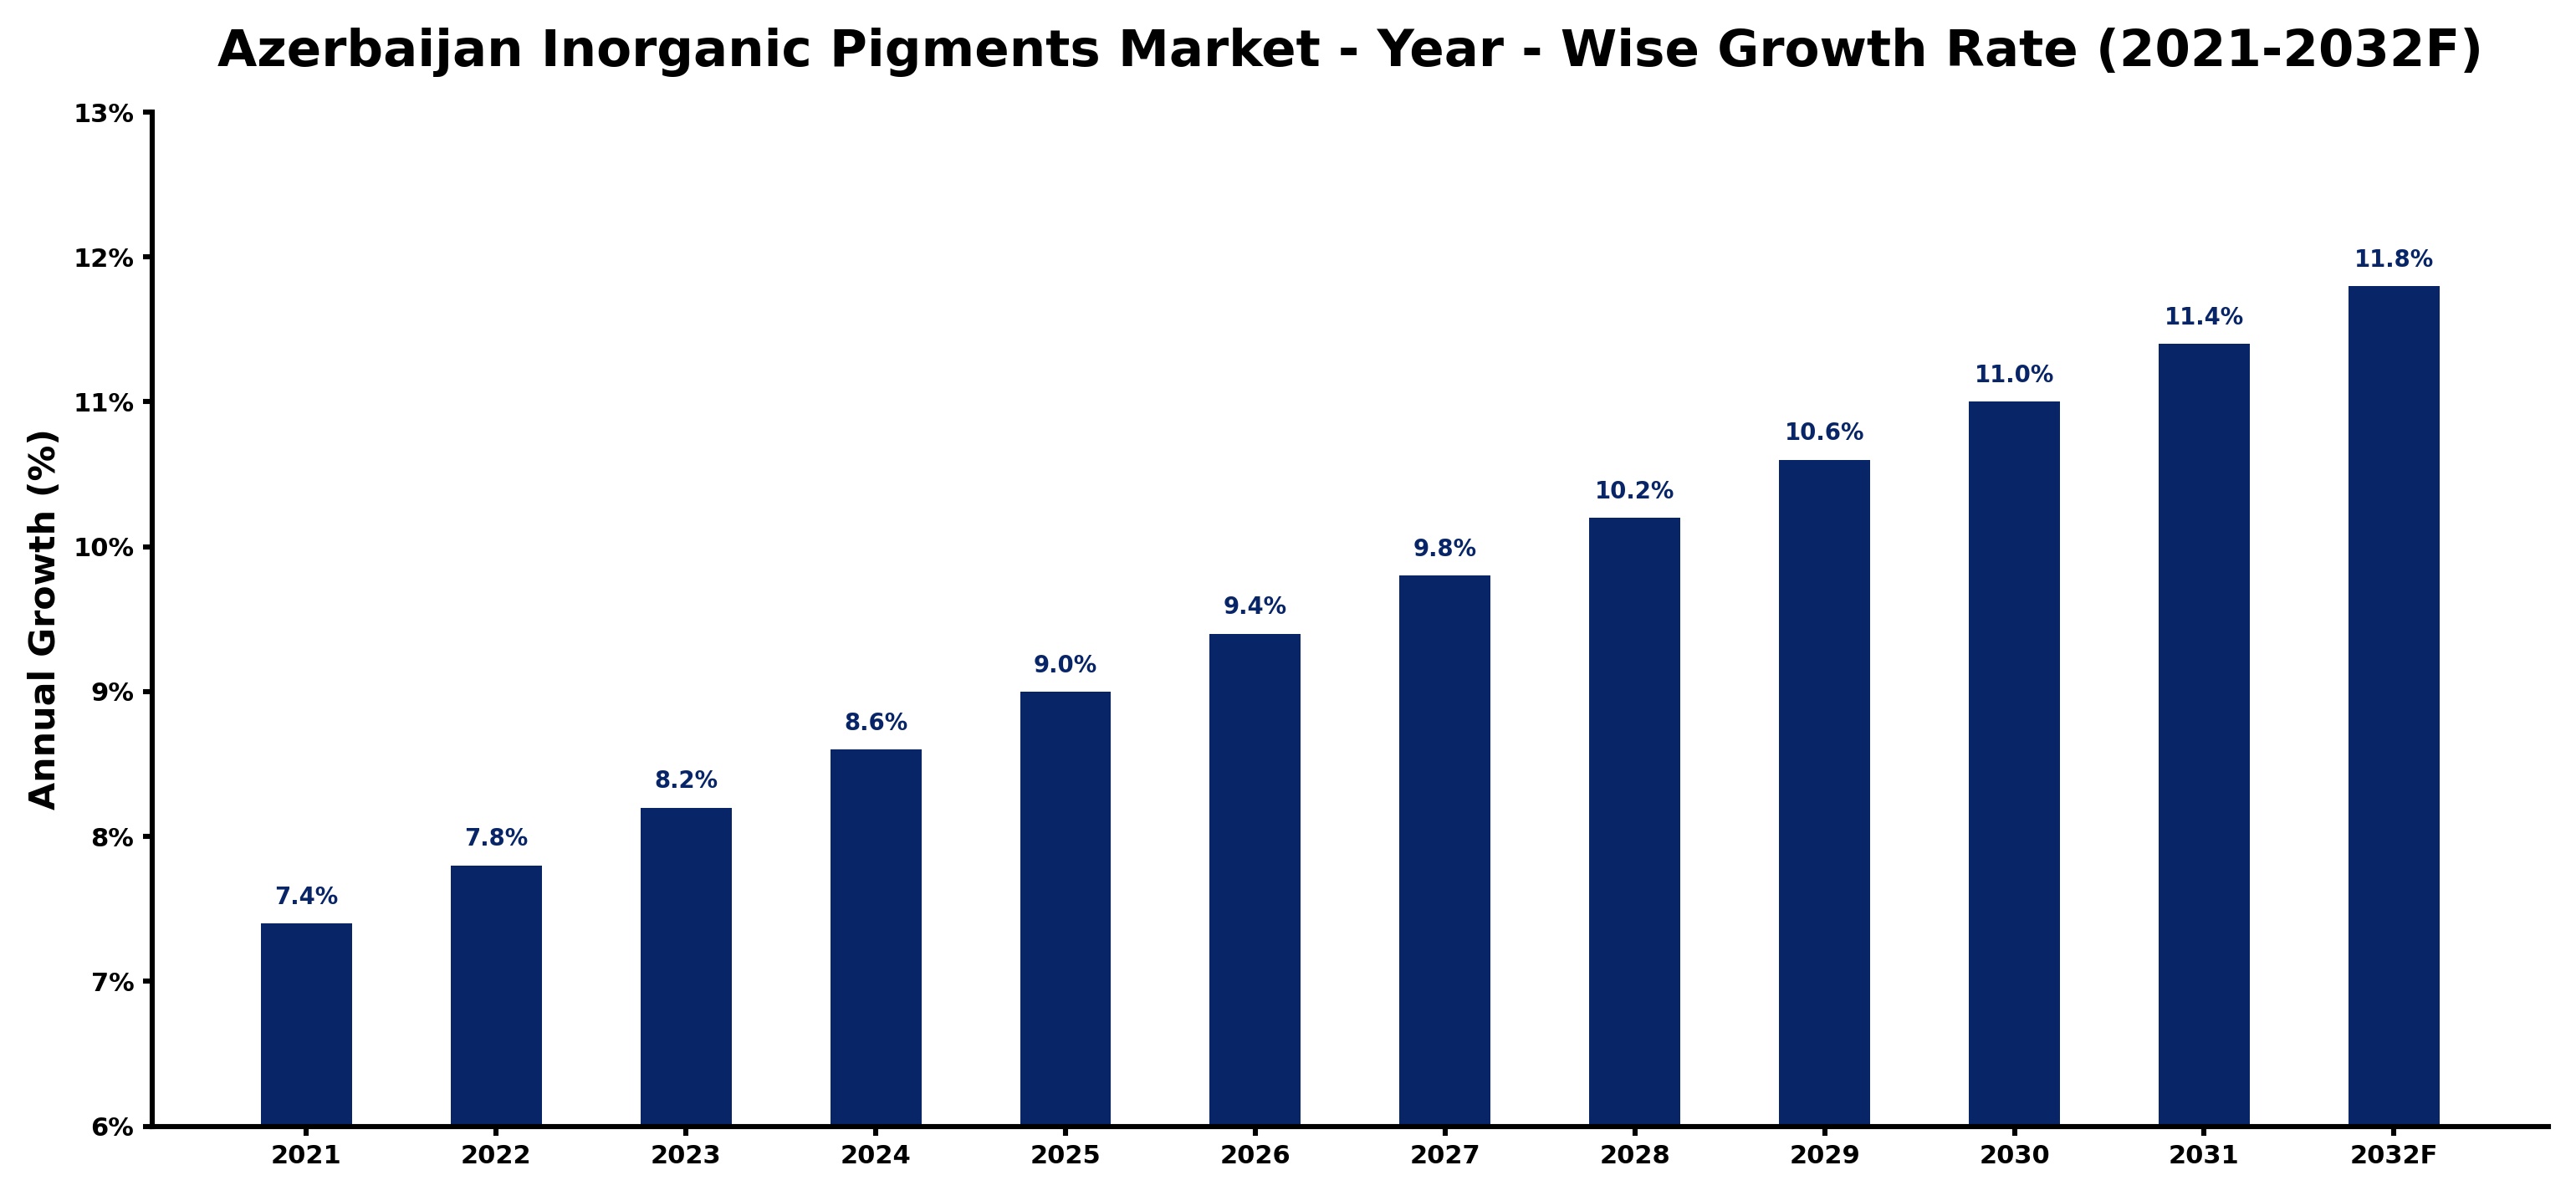
The table below presents the year‑wise growth rates along with the key drivers influencing the market
| Year | Growth Rate | Major Drivers |
| 2021 | 7.4% | Construction sector demand increased significantly |
| 2022 | 7.8% | Automotive industry growth accelerated demand |
| 2023 | 8.2% | Industrial activity supported growth |
| 2024 | 8.6% | Infrastructure projects boosted pigment usage |
| 2025 | 9.0% | Consumer goods production increased steadily |
| 2026 | 9.4% | Textile industry growth enhanced demand |
| 2027 | 9.8% | Electronics manufacturing expanded pigment applications |
| 2028 | 10.2% | Renewable energy sector drove innovation |
| 2029 | 10.6% | Packaging industry growth increased consumption |
| 2030 | 11.0% | Agricultural sector demand surged upward |
| 2031 | 11.4% | Art and craft market expanded |
| 2032 | 11.8% | Cosmetics industry growth enhanced usage |
Note - Market size estimations and growth projections presented in this report are based on 6Wresearch’s advanced forecasting approach, validated with industry datasets as of June 2026.
Azerbaijan Inorganic Pigments Market Synopsis
The strongest force currently shaping the Azerbaijan Inorganic Pigments Market is the booming construction sector. With government initiatives aimed at enhancing infrastructure, the need for durable and aesthetically pleasing materials is accelerating the demand for high-performance inorganic pigments across various applications.
Moreover, as industries shift towards environmentally friendly practices, manufacturers are prioritizing the development of sustainable pigment formulations. This trend is fostering innovation within the market, as companies explore new compositions to cater to both local and international customer preferences.
Azerbaijan Inorganic Pigments Market Key Takeaways
- The market is primarily driven by demand from the construction, automotive, and packaging sectors.
- Technological advancements are leading to innovative pigment formulations, enhancing color performance and sustainability.
- Government policies supporting domestic manufacturing are strengthening the market landscape.
- Environmental regulations are prompting companies to develop alternatives to traditional heavy metal-based pigments.
- The market's competitive dynamics are influenced by cost-effectiveness and product quality.
Evaluation of Restraints in Azerbaijan Inorganic Pigments Market
While the Azerbaijan Inorganic Pigments Market is poised for growth, it faces significant restraints that could limit its potential. Stringent environmental regulations surrounding the production and use of inorganic pigments often pose challenges for manufacturers. Concerns regarding the health impacts of certain materials, particularly those containing heavy metals, are prompting regulatory bodies to implement stricter compliance measures. Additionally, the availability of raw materials for pigment production can be inconsistent, which may disrupt supply chains and hinder market responsiveness. These factors necessitate strategic planning and adaptation from industry players to navigate the complex landscape effectively.
Azerbaijan Inorganic Pigments Market Trends
The market is currently witnessing several key trends that are influencing demand and production technologies. Notably, there is a marked shift toward the use of eco-friendly and non-toxic pigments, reflecting a global trend towards sustainability. Additionally, advancements in nanotechnology are allowing for the development of pigments with enhanced color strength and stability, appealing to industries that prioritize performance. Furthermore, as digital printing technologies evolve, there is increasing demand for inorganic pigments in the printing inks sector, expanding their application range.
Azerbaijan Inorganic Pigments Market Opportunities
Genuine growth and investment opportunities within the Azerbaijan Inorganic Pigments Market lie in the expansion of domestic production capabilities. The government's support for local manufacturers presents a unique chance for companies to innovate and capture market share. Additionally, the increasing demand for high-performance pigments tailored for specific applications, such as automotive coatings and high-end construction materials, opens avenues for product differentiation. Companies that can effectively navigate regulatory landscapes while investing in R&D are likely to gain competitive advantages.
Government Initiatives in the Azerbaijan Inorganic Pigments Market
The government of Azerbaijan is actively implementing policies to bolster the growth of the inorganic pigments market. Initiatives include providing financial incentives for local manufacturers, promoting technology transfer, and establishing stringent quality standards for production. These efforts are aimed at fostering a robust domestic supply chain, reducing reliance on imports, and enhancing the overall competitiveness of the sector. Furthermore, the government is prioritizing innovation through funding research projects and supporting collaboration between industry and academic institutions.
Future Insights of the Azerbaijan Inorganic Pigments Market
Looking ahead to the period from 2026 to 2032, the Azerbaijan Inorganic Pigments Market is set to evolve significantly. The integration of advanced technologies in production processes and a heightened focus on sustainability will likely redefine market dynamics. As demand for environmentally friendly pigments increases, manufacturers are expected to pivot towards R&D initiatives that promote cleaner production practices. Additionally, the anticipated growth in construction and industrial sectors will continue to propel market expansion, allowing Azerbaijan to position itself as a competitive player in the regional and global pigment markets.
Azerbaijan Inorganic Pigments Market Latest Developments (May 2025 - June 2026)
In recent months, the Azerbaijan Inorganic Pigments Market has seen several notable developments. Manufacturers are increasingly focusing on sustainable practices, aligning their offerings with global environmental standards. Innovations in pigment technology have led to the introduction of new formulations that cater to emerging customer preferences, particularly in the construction and automotive sectors. Additionally, government-supported initiatives aimed at enhancing local production capabilities are gaining traction, paving the way for a more self-sufficient pigment industry.
Azerbaijan Inorganic Pigments Market - Key Attractiveness of the Report
- 10 Years of Market Numbers
- Historical Data Starting from 2022 to 2025
- Base Year: 2025
- Forecast Data until 2032
- Key Performance Indicators Impacting the Market
- Major Upcoming Developments and Projects
Key Highlights of the Report:
- Azerbaijan Inorganic Pigments Market Outlook
- Market Size of Azerbaijan Inorganic Pigments Market, 2025
- Forecast of Azerbaijan Inorganic Pigments Market, 2032
- Historical Data and Forecast of Azerbaijan Inorganic Pigments Revenues & Volume for the Period 2022-2032F
- Azerbaijan Inorganic Pigments Market Trend Evolution
- Azerbaijan Inorganic Pigments Market Drivers and Challenges
- Azerbaijan Inorganic Pigments Price Trends
- Azerbaijan Inorganic Pigments Porter's Five Forces
- Azerbaijan Inorganic Pigments Industry Life Cycle
- Historical Data and Forecast of Azerbaijan Inorganic Pigments Market Revenues & Volume By Type for the Period 2022-2032F
- Historical Data and Forecast of Azerbaijan Inorganic Pigments Market Revenues & Volume By Titanium Dioxide for the Period 2022-2032F
- Historical Data and Forecast of Azerbaijan Inorganic Pigments Market Revenues & Volume By Iron Oxide, Cadmium for the Period 2022-2032F
- Historical Data and Forecast of Azerbaijan Inorganic Pigments Market Revenues & Volume By Carbon Blank for the Period 2022-2032F
- Historical Data and Forecast of Azerbaijan Inorganic Pigments Market Revenues & Volume By Lead Chromate for the Period 2022-2032F
- Historical Data and Forecast of Azerbaijan Inorganic Pigments Market Revenues & Volume By Chromium Oxide for the Period 2022-2032F
- Historical Data and Forecast of Azerbaijan Inorganic Pigments Market Revenues & Volume By Others for the Period 2022-2032F
- Historical Data and Forecast of Azerbaijan Inorganic Pigments Market Revenues & Volume By Colour for the Period 2022-2032F
- Historical Data and Forecast of Azerbaijan Inorganic Pigments Market Revenues & Volume By Red for the Period 2022-2032F
- Historical Data and Forecast of Azerbaijan Inorganic Pigments Market Revenues & Volume By Yellow for the Period 2022-2032F
- Historical Data and Forecast of Azerbaijan Inorganic Pigments Market Revenues & Volume By Orange for the Period 2022-2032F
- Historical Data and Forecast of Azerbaijan Inorganic Pigments Market Revenues & Volume By Green for the Period 2022-2032F
- Historical Data and Forecast of Azerbaijan Inorganic Pigments Market Revenues & Volume By Blue for the Period 2022-2032F
- Historical Data and Forecast of Azerbaijan Inorganic Pigments Market Revenues & Volume By Black for the Period 2022-2032F
- Historical Data and Forecast of Azerbaijan Inorganic Pigments Market Revenues & Volume By White for the Period 2022-2032F
- Historical Data and Forecast of Azerbaijan Inorganic Pigments Market Revenues & Volume By Others for the Period 2022-2032F
- Historical Data and Forecast of Azerbaijan Inorganic Pigments Market Revenues & Volume By Chemistry for the Period 2022-2032F
- Historical Data and Forecast of Azerbaijan Inorganic Pigments Market Revenues & Volume By Oxide for the Period 2022-2032F
- Historical Data and Forecast of Azerbaijan Inorganic Pigments Market Revenues & Volume By Silicate for the Period 2022-2032F
- Historical Data and Forecast of Azerbaijan Inorganic Pigments Market Revenues & Volume By Carbonate for the Period 2022-2032F
- Historical Data and Forecast of Azerbaijan Inorganic Pigments Market Revenues & Volume By Sulphate for the Period 2022-2032F
- Historical Data and Forecast of Azerbaijan Inorganic Pigments Market Revenues & Volume By Sulphide for the Period 2022-2032F
- Historical Data and Forecast of Azerbaijan Inorganic Pigments Market Revenues & Volume By Others for the Period 2022-2032F
- Historical Data and Forecast of Azerbaijan Inorganic Pigments Market Revenues & Volume By Grade for the Period 2022-2032F
- Historical Data and Forecast of Azerbaijan Inorganic Pigments Market Revenues & Volume By Food Grade for the Period 2022-2032F
- Historical Data and Forecast of Azerbaijan Inorganic Pigments Market Revenues & Volume By Pharmaceutical Grade for the Period 2022-2032F
- Historical Data and Forecast of Azerbaijan Inorganic Pigments Market Revenues & Volume By Industrial Grade for the Period 2022-2032F
- Historical Data and Forecast of Azerbaijan Inorganic Pigments Market Revenues & Volume By Others for the Period 2022-2032F
- Historical Data and Forecast of Azerbaijan Inorganic Pigments Market Revenues & Volume By Form for the Period 2022-2032F
- Historical Data and Forecast of Azerbaijan Inorganic Pigments Market Revenues & Volume By Powder for the Period 2022-2032F
- Historical Data and Forecast of Azerbaijan Inorganic Pigments Market Revenues & Volume By Liquid for the Period 2022-2032F
- Historical Data and Forecast of Azerbaijan Inorganic Pigments Market Revenues & Volume By Application for the Period 2022-2032F
- Historical Data and Forecast of Azerbaijan Inorganic Pigments Market Revenues & Volume By Plastics for the Period 2022-2032F
- Historical Data and Forecast of Azerbaijan Inorganic Pigments Market Revenues & Volume By Paints & Coatings for the Period 2022-2032F
- Historical Data and Forecast of Azerbaijan Inorganic Pigments Market Revenues & Volume By Printing Inks for the Period 2022-2032F
- Historical Data and Forecast of Azerbaijan Inorganic Pigments Market Revenues & Volume By Glass & Ceramics for the Period 2022-2032F
- Historical Data and Forecast of Azerbaijan Inorganic Pigments Market Revenues & Volume By Cosmetics for the Period 2022-2032F
- Historical Data and Forecast of Azerbaijan Inorganic Pigments Market Revenues & Volume By Paper Industry for the Period 2022-2032F
- Historical Data and Forecast of Azerbaijan Inorganic Pigments Market Revenues & Volume By Food Industry for the Period 2022-2032F
- Historical Data and Forecast of Azerbaijan Inorganic Pigments Market Revenues & Volume By Others for the Period 2022-2032F
- Azerbaijan Inorganic Pigments Import Export Trade Statistics
- Market Opportunity Assessment By Type
- Market Opportunity Assessment By Colour
- Market Opportunity Assessment By Chemistry
- Market Opportunity Assessment By Grade
- Market Opportunity Assessment By Form
- Market Opportunity Assessment By Application
- Azerbaijan Inorganic Pigments Top Companies Market Share
- Azerbaijan Inorganic Pigments Competitive Benchmarking By Technical and Operational Parameters
- Azerbaijan Inorganic Pigments Company Profiles
- Azerbaijan Inorganic Pigments Key Strategic Recommendations
Azerbaijan Inorganic Pigments Market - Frequently Asked Questions
The market is projected to reach USD 2197 Million by 2032, growing from an estimated USD 1268 Million in 2025, indicating a robust CAGR of 8.2% from 2026 to 2032.
Government policies are enhancing domestic manufacturing through financial support, ensuring product quality, and promoting innovation, which collectively boost the competitiveness of local manufacturers.
The primary demand for inorganic pigments comes from the construction sector, automotive coatings, and the production of consumer goods, where performance and durability are crucial.
Manufacturers are grappling with challenges related to environmental regulations, the sourcing of high-quality raw materials, and competition from alternative pigments in various applications.
Emerging trends include a shift towards eco-friendly pigments and innovations in nanotechnology, which enhance color performance and expand the range of applications for inorganic pigments.
As the construction sector grows, the demand for durable and visually appealing materials rises, thereby significantly driving the need for high-quality inorganic pigments used in architectural coatings and other applications.
6Wresearch actively monitors the Azerbaijan Inorganic Pigments Market and publishes its comprehensive annual report, highlighting emerging trends, growth drivers, revenue analysis, and forecast outlook. Our insights help businesses to make data-backed strategic decisions with ongoing market dynamics. Our analysts track relevent industries related to the Azerbaijan Inorganic Pigments Market, allowing our clients with actionable intelligence and reliable forecasts tailored to emerging regional needs.
Yes, we provide customisation as per your requirements. To learn more, feel free to contact us on sales@6wresearch.com
1 Executive Summary |
2 Introduction |
2.1 Key Highlights of the Report |
2.2 Report Description |
2.3 Market Scope & Segmentation |
2.4 Research Methodology |
2.5 Assumptions |
3 Azerbaijan Inorganic Pigments Market Overview |
3.1 Azerbaijan Country Macro Economic Indicators |
3.2 Azerbaijan Inorganic Pigments Market Revenues & Volume, 2022 & 2032F |
3.3 Azerbaijan Inorganic Pigments Market - Industry Life Cycle |
3.4 Azerbaijan Inorganic Pigments Market - Porter's Five Forces |
3.5 Azerbaijan Inorganic Pigments Market Revenues & Volume Share, By Type, 2022 & 2032F |
3.6 Azerbaijan Inorganic Pigments Market Revenues & Volume Share, By Colour, 2022 & 2032F |
3.7 Azerbaijan Inorganic Pigments Market Revenues & Volume Share, By Chemistry, 2022 & 2032F |
3.8 Azerbaijan Inorganic Pigments Market Revenues & Volume Share, By Grade, 2022 & 2032F |
3.9 Azerbaijan Inorganic Pigments Market Revenues & Volume Share, By Form, 2022 & 2032F |
3.10 Azerbaijan Inorganic Pigments Market Revenues & Volume Share, By Application, 2022 & 2032F |
4 Azerbaijan Inorganic Pigments Market Dynamics |
4.1 Impact Analysis |
4.2 Market Drivers |
4.2.1 Growing demand for inorganic pigments in various industries such as construction, automotive, and packaging. |
4.2.2 Increasing investments in infrastructure projects in Azerbaijan leading to higher demand for inorganic pigments. |
4.2.3 Rising awareness about the benefits of inorganic pigments over organic pigments in terms of durability and color stability. |
4.3 Market Restraints |
4.3.1 Fluctuating prices of raw materials used in the production of inorganic pigments impacting profit margins. |
4.3.2 Stringent regulations related to environmental concerns and disposal of inorganic pigments waste. |
4.3.3 Intense competition from alternative pigment options such as organic pigments and dyes. |
5 Azerbaijan Inorganic Pigments Market Trends |
6 Azerbaijan Inorganic Pigments Market, By Types |
6.1 Azerbaijan Inorganic Pigments Market, By Type |
6.1.1 Overview and Analysis |
6.1.2 Azerbaijan Inorganic Pigments Market Revenues & Volume, By Type, 2022-2032F |
6.1.3 Azerbaijan Inorganic Pigments Market Revenues & Volume, By Titanium Dioxide, 2022-2032F |
6.1.4 Azerbaijan Inorganic Pigments Market Revenues & Volume, By Iron Oxide, Cadmium, 2022-2032F |
6.1.5 Azerbaijan Inorganic Pigments Market Revenues & Volume, By Carbon Blank, 2022-2032F |
6.1.6 Azerbaijan Inorganic Pigments Market Revenues & Volume, By Lead Chromate, 2022-2032F |
6.1.7 Azerbaijan Inorganic Pigments Market Revenues & Volume, By Chromium Oxide, 2022-2032F |
6.1.8 Azerbaijan Inorganic Pigments Market Revenues & Volume, By Others, 2022-2032F |
6.2 Azerbaijan Inorganic Pigments Market, By Colour |
6.2.1 Overview and Analysis |
6.2.2 Azerbaijan Inorganic Pigments Market Revenues & Volume, By Red, 2022-2032F |
6.2.3 Azerbaijan Inorganic Pigments Market Revenues & Volume, By Yellow, 2022-2032F |
6.2.4 Azerbaijan Inorganic Pigments Market Revenues & Volume, By Orange, 2022-2032F |
6.2.5 Azerbaijan Inorganic Pigments Market Revenues & Volume, By Green, 2022-2032F |
6.2.6 Azerbaijan Inorganic Pigments Market Revenues & Volume, By Blue, 2022-2032F |
6.2.7 Azerbaijan Inorganic Pigments Market Revenues & Volume, By Black, 2022-2032F |
6.2.8 Azerbaijan Inorganic Pigments Market Revenues & Volume, By Others, 2022-2032F |
6.2.9 Azerbaijan Inorganic Pigments Market Revenues & Volume, By Others, 2022-2032F |
6.3 Azerbaijan Inorganic Pigments Market, By Chemistry |
6.3.1 Overview and Analysis |
6.3.2 Azerbaijan Inorganic Pigments Market Revenues & Volume, By Oxide, 2022-2032F |
6.3.3 Azerbaijan Inorganic Pigments Market Revenues & Volume, By Silicate, 2022-2032F |
6.3.4 Azerbaijan Inorganic Pigments Market Revenues & Volume, By Carbonate, 2022-2032F |
6.3.5 Azerbaijan Inorganic Pigments Market Revenues & Volume, By Sulphate, 2022-2032F |
6.3.6 Azerbaijan Inorganic Pigments Market Revenues & Volume, By Sulphide, 2022-2032F |
6.3.7 Azerbaijan Inorganic Pigments Market Revenues & Volume, By Others, 2022-2032F |
6.4 Azerbaijan Inorganic Pigments Market, By Grade |
6.4.1 Overview and Analysis |
6.4.2 Azerbaijan Inorganic Pigments Market Revenues & Volume, By Food Grade, 2022-2032F |
6.4.3 Azerbaijan Inorganic Pigments Market Revenues & Volume, By Pharmaceutical Grade, 2022-2032F |
6.4.4 Azerbaijan Inorganic Pigments Market Revenues & Volume, By Industrial Grade, 2022-2032F |
6.4.5 Azerbaijan Inorganic Pigments Market Revenues & Volume, By Others, 2022-2032F |
6.5 Azerbaijan Inorganic Pigments Market, By Form |
6.5.1 Overview and Analysis |
6.5.2 Azerbaijan Inorganic Pigments Market Revenues & Volume, By Powder, 2022-2032F |
6.5.3 Azerbaijan Inorganic Pigments Market Revenues & Volume, By Liquid, 2022-2032F |
6.6 Azerbaijan Inorganic Pigments Market, By Application |
6.6.1 Overview and Analysis |
6.6.2 Azerbaijan Inorganic Pigments Market Revenues & Volume, By Plastics, 2022-2032F |
6.6.3 Azerbaijan Inorganic Pigments Market Revenues & Volume, By Paints & Coatings, 2022-2032F |
6.6.4 Azerbaijan Inorganic Pigments Market Revenues & Volume, By Printing Inks, 2022-2032F |
6.6.5 Azerbaijan Inorganic Pigments Market Revenues & Volume, By Glass & Ceramics, 2022-2032F |
6.6.6 Azerbaijan Inorganic Pigments Market Revenues & Volume, By Cosmetics, 2022-2032F |
6.6.7 Azerbaijan Inorganic Pigments Market Revenues & Volume, By Paper Industry, 2022-2032F |
6.6.8 Azerbaijan Inorganic Pigments Market Revenues & Volume, By Others, 2022-2032F |
6.6.9 Azerbaijan Inorganic Pigments Market Revenues & Volume, By Others, 2022-2032F |
7 Azerbaijan Inorganic Pigments Market Import-Export Trade Statistics |
7.1 Azerbaijan Inorganic Pigments Market Export to Major Countries |
7.2 Azerbaijan Inorganic Pigments Market Imports from Major Countries |
8 Azerbaijan Inorganic Pigments Market Key Performance Indicators |
8.1 Research and development investment in innovative inorganic pigment formulations. |
8.2 Adoption rate of eco-friendly inorganic pigments. |
8.3 Number of collaborations and partnerships with end-user industries for customized pigment solutions. |
8.4 Market penetration in new application areas for inorganic pigments. |
8.5 Customer satisfaction and loyalty metrics for inorganic pigment products. |
9 Azerbaijan Inorganic Pigments Market - Opportunity Assessment |
9.1 Azerbaijan Inorganic Pigments Market Opportunity Assessment, By Type, 2022 & 2032F |
9.2 Azerbaijan Inorganic Pigments Market Opportunity Assessment, By Colour, 2022 & 2032F |
9.3 Azerbaijan Inorganic Pigments Market Opportunity Assessment, By Chemistry, 2022 & 2032F |
9.4 Azerbaijan Inorganic Pigments Market Opportunity Assessment, By Grade, 2022 & 2032F |
9.5 Azerbaijan Inorganic Pigments Market Opportunity Assessment, By Form, 2022 & 2032F |
9.6 Azerbaijan Inorganic Pigments Market Opportunity Assessment, By Application, 2022 & 2032F |
10 Azerbaijan Inorganic Pigments Market - Competitive Landscape |
10.1 Azerbaijan Inorganic Pigments Market Revenue Share, By Companies, 2025 |
10.2 Azerbaijan Inorganic Pigments Market Competitive Benchmarking, By Operating and Technical Parameters |
11 Company Profiles |
12 Recommendations |
13 Disclaimer |
Global Go To Market Strategy - 2030
Export potential enables firms to identify high-growth global markets with greater confidence by combining advanced trade intelligence with a structured quantitative methodology. The framework analyzes emerging demand trends and country-level import patterns while integrating macroeconomic and trade datasets such as GDP and population forecasts, bilateral import–export flows, tariff structures, elasticity differentials between developed and developing economies, geographic distance, and import demand projections. Using weighted trade values from 2020–2024 as the base period to project country-to-country export potential for 2030, these inputs are operationalized through calculated drivers such as gravity model parameters, tariff impact factors, and projected GDP per-capita growth. Through an analysis of hidden potentials, demand hotspots, and market conditions that are most favorable to success, this method enables firms to focus on target countries, maximize returns, and global expansion with data, backed by accuracy.
By factoring in the projected importer demand gap that is currently unmet and could be potential opportunity, it identifies the potential for the Exporter (Country) among 190 countries, against the general trade analysis, which identifies the biggest importer or exporter.
To discover high-growth global markets and optimize your business strategy:
Click Here
Pricing
- Single User License$ 1,995
- Department License$ 2,400
- Site License$ 3,120
- Global License$ 3,795

Leadership Perspectives from Industry Events
Search
Thought Leadership and Analyst Meet


Our Clients
6WResearch In News
- India Air Conditioner Market Set for Strong Rebound in 2026 After Weather-Led Correction and GST-Driven Recovery: 6Wresearch
- ADAS in India: How Automatic Emergency Braking, Blind Spot Detection & Driver Monitoring are Transforming Road Safety
- Doha a strategic location for EV manufacturing hub: IPA Qatar
- Demand for luxury TVs surging in the GCC, says Samsung
- Empowering Growth: The Thriving Journey of Bangladesh’s Cable Industry
- Demand for luxury TVs surging in the GCC, says Samsung
Latest Reports
- Nicaragua RPG Gaming Market (2026-2032)
- New Zealand RPG Gaming Market (2026-2032)
- Netherlands RPG Gaming Market (2026-2032)
- Nauru RPG Gaming Market (2026-2032)
- Namibia RPG Gaming Market (2026-2032)
- Mozambique RPG Gaming Market (2026-2032)
- Montenegro RPG Gaming Market (2026-2032)
- Mongolia RPG Gaming Market (2026-2032)
- Monaco RPG Gaming Market (2026-2032)
- Micronesia RPG Gaming Market (2026-2032)
Industry Events and Analyst Meet

EV India Expo 2026

HIMTEX 2026

India Refining Summit 2026

India EV Show 2026

EV tech India Expo 2026
Whitepaper
- Middle East & Africa Commercial Security Market Click here to view more.
- Middle East & Africa Fire Safety Systems & Equipment Market Click here to view more.
- GCC Drone Market Click here to view more.
- Middle East Lighting Fixture Market Click here to view more.
- GCC Physical & Perimeter Security Market Click here to view more.