Bahrain Marine Cleaning Products Market (2026-2032) Outlook | Analysis, Trends, Forecast, Value, Industry, Companies, Revenue, Share, Size & Growth
Market Forecast By Type (Stainless Steel Cleaner, Teak Cleaner, Engine Cleaner, Hull Cleaner, Others), By Application (Decks, Hulls, Machinery, Walls, Engine Rooms, Bilges, Others), By End-Use (Passenger Ship, Cargo Ship, Fishing Boat, Others) And Competitive Landscape
| Product Code: ETC296864 | Publication Date: Aug 2022 | Updated Date: Mar 2026 | Product Type: Market Research Report | |
| Publisher: 6Wresearch | Author: Shubham Padhi | No. of Pages: 75 | No. of Figures: 35 | No. of Tables: 20 |
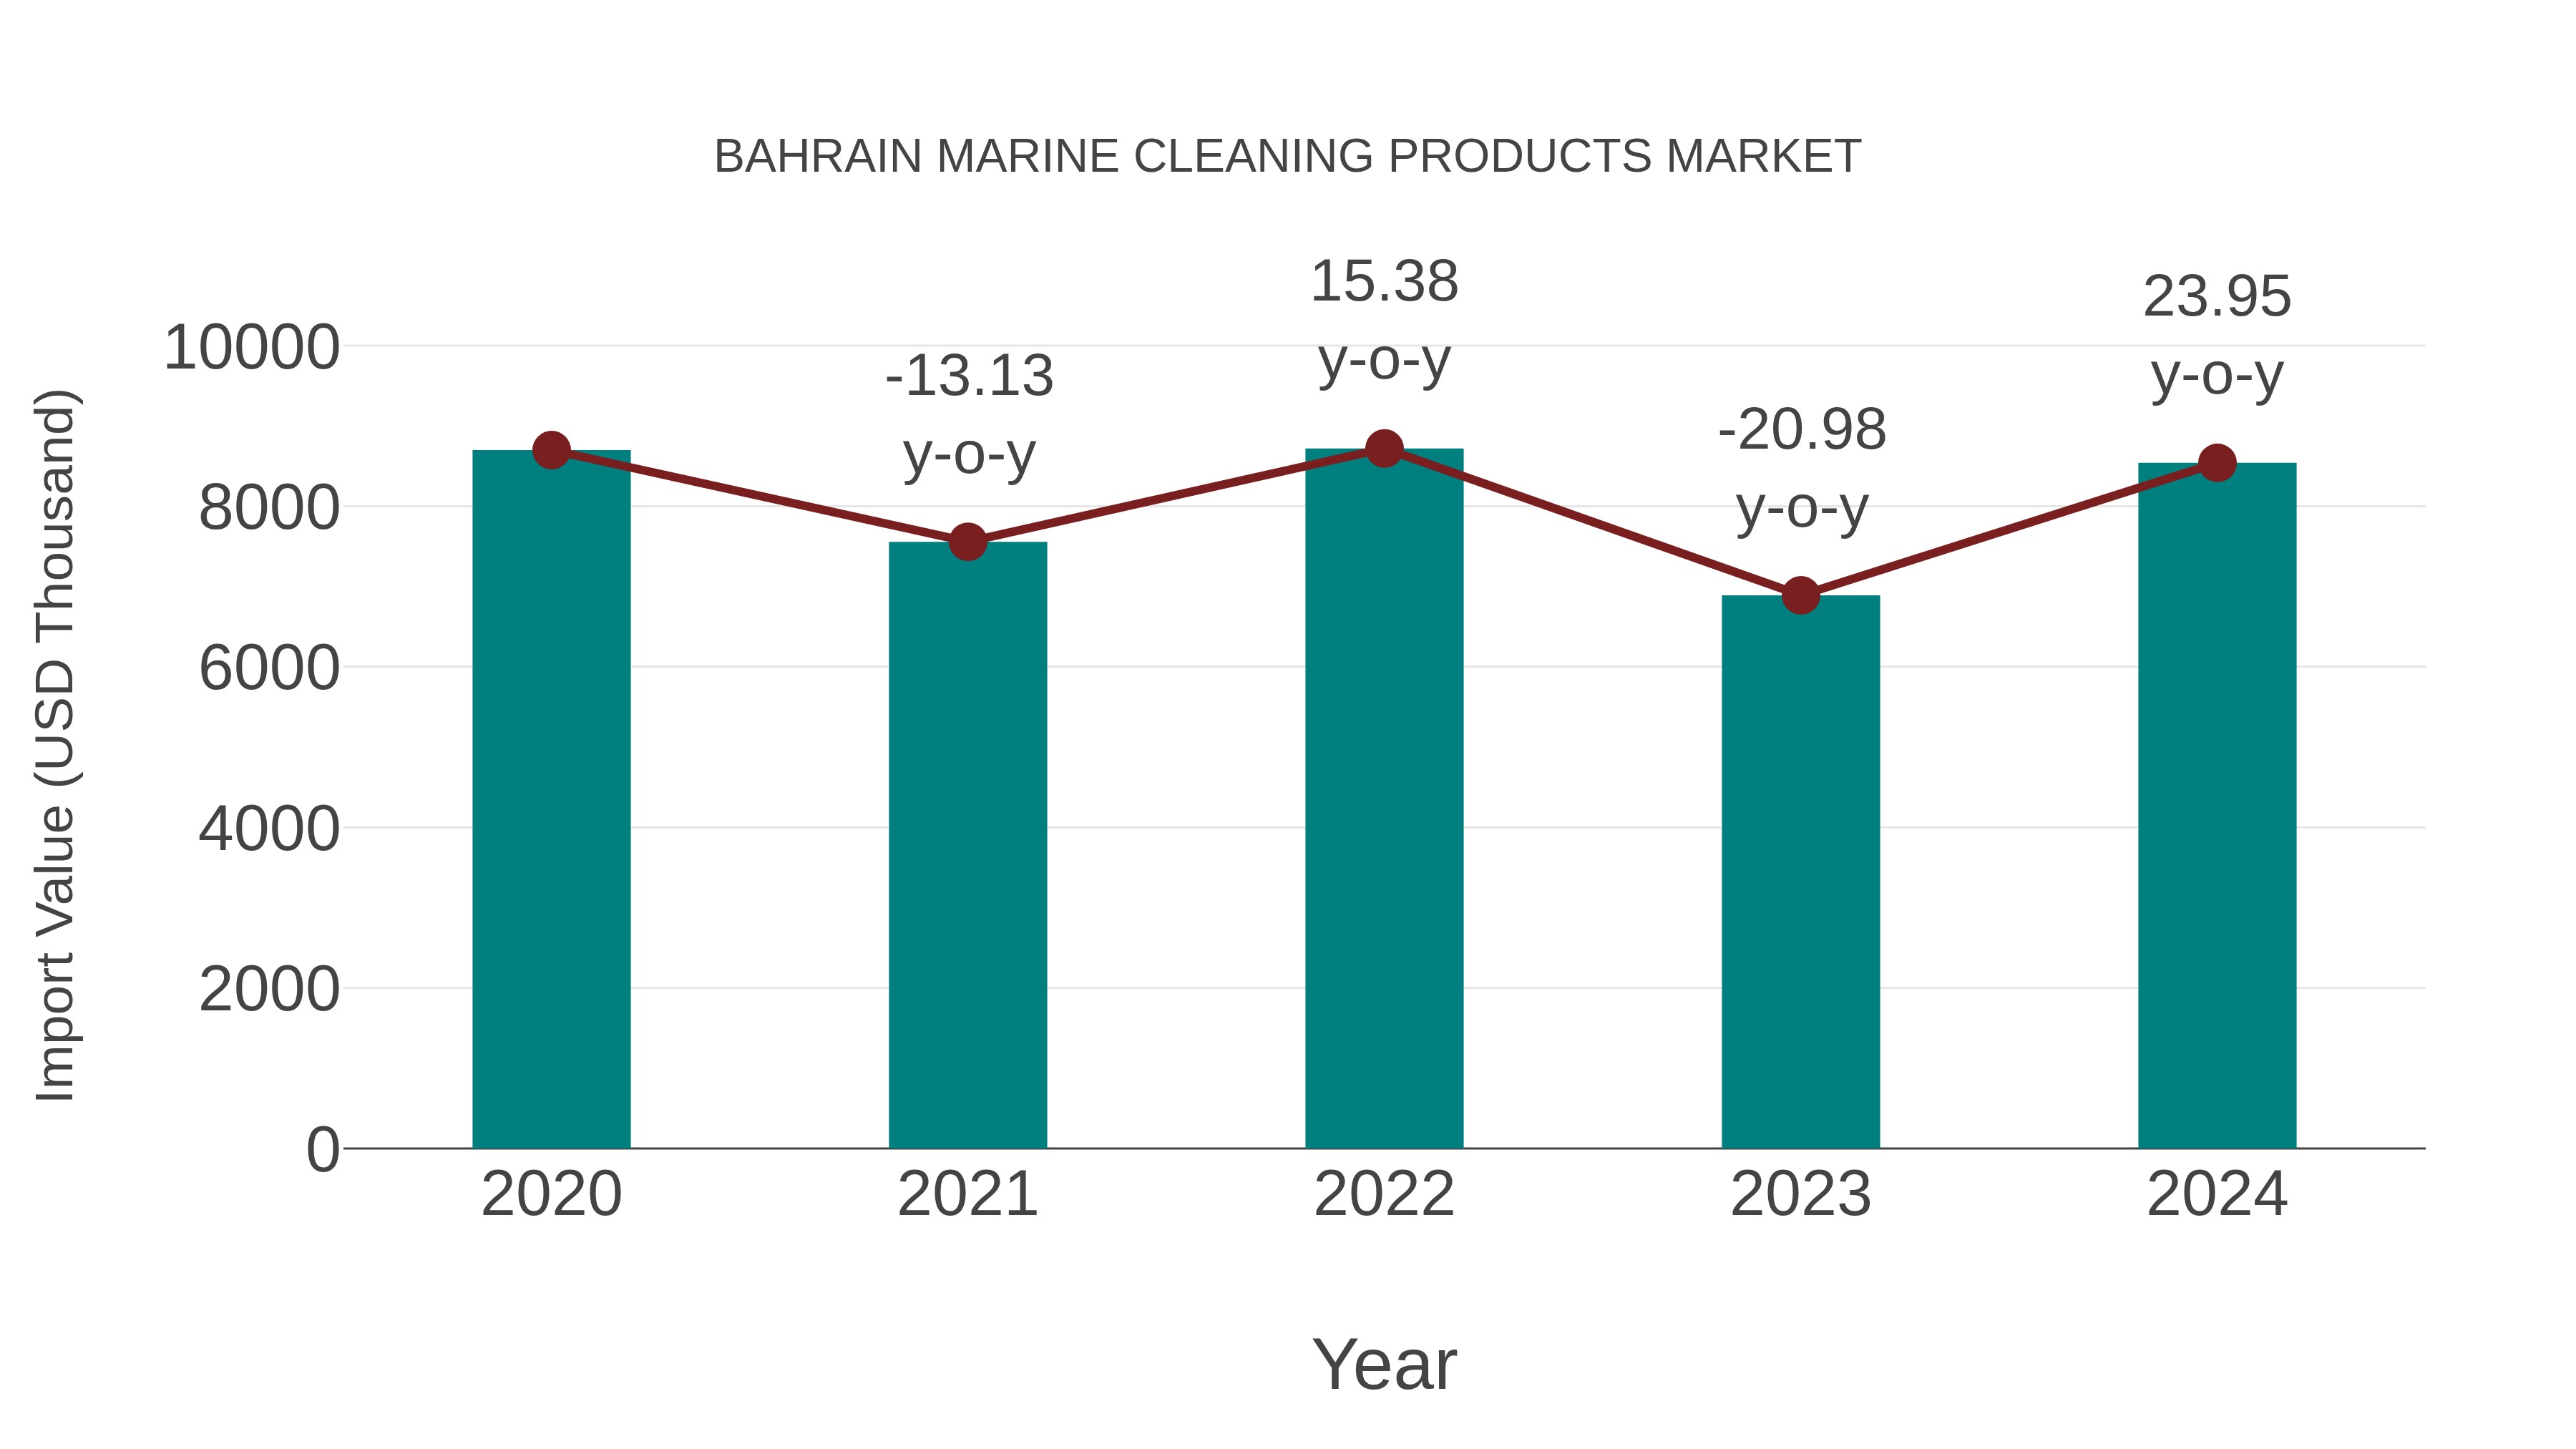
Bahrain Marine Cleaning Products Market: Import Trend Analysis
In the Bahrain marine cleaning products market, the import trend witnessed a notable growth rate of 23.95% from 2023 to 2024, contrasting with a compound annual growth rate (CAGR) of -0.46% from 2020 to 2024. This shift could be attributed to a surge in demand for environmentally friendly cleaning solutions in response to stricter environmental regulations.
Bahrain Marine Cleaning Products Market Overview
Bahrain`s marine cleaning products market is growing as maritime industries focus on maintaining the cleanliness and efficiency of ships and marine structures. These products are essential for cleaning various marine surfaces, preventing corrosion, and ensuring compliance with environmental standards. The market is driven by the increasing number of ships and yachts in Bahrain, alongside the country`s robust maritime sector. The demand for eco-friendly and biodegradable cleaning solutions is on the rise as businesses seek to reduce the environmental impact of marine operations while maintaining high standards of cleanliness and hygiene.
Drivers of the market
In Bahrain, the marine cleaning products market is seeing increased demand as environmental regulations become stricter. The market is shifting towards eco-friendly and biodegradable cleaning agents designed for vessel and offshore platform maintenance. Additionally, there is a growing emphasis on cleaning products that reduce water usage while ensuring the effective removal of biofouling and oil residues. Technological advancements are also playing a key role, with the introduction of more efficient, cost-effective cleaning solutions designed to meet the operational needs of the expanding marine and oil industries.
Challenges of the market
The marine cleaning products market in Bahrain faces challenges due to the relatively small scale of the country`s maritime sector. Limited demand for marine cleaning products from local shipping and boating industries restricts market growth. Additionally, the market is highly dependent on imported cleaning products, which increases costs for local businesses. Competition from international suppliers offering more affordable or specialized marine cleaning products further complicates the market. Furthermore, environmental regulations concerning marine pollution add to the operational costs, particularly for locally operated vessels.
Investment opportunities in the Market
Bahrains maritime sector, including ports, shipping, and yacht maintenance, requires high-quality marine cleaning products. Investment in eco-friendly and advanced cleaning solutions can cater to the marine industrys need for effective maintenance while complying with environmental regulations.
Government Policy of the market
The marine cleaning products market aligns with Bahrains environmental regulations and maritime industry growth. Government initiatives such as the National Environmental Strategy encourage eco-friendly practices in port operations and shipping maintenance. These regulations are shaping the demand for biodegradable and non-toxic marine cleaning solutions, with tax breaks for green products.
Key Highlights of the Report:
- Bahrain Marine Cleaning Products Market Outlook
- Market Size of Bahrain Marine Cleaning Products Market, 2025
- Forecast of Bahrain Marine Cleaning Products Market, 2032
- Historical Data and Forecast of Bahrain Marine Cleaning Products Revenues & Volume for the Period 2022 - 2032F
- Bahrain Marine Cleaning Products Market Trend Evolution
- Bahrain Marine Cleaning Products Market Drivers and Challenges
- Bahrain Marine Cleaning Products Price Trends
- Bahrain Marine Cleaning Products Porter's Five Forces
- Bahrain Marine Cleaning Products Industry Life Cycle
- Historical Data and Forecast of Bahrain Marine Cleaning Products Market Revenues & Volume By Type for the Period 2022 - 2032F
- Historical Data and Forecast of Bahrain Marine Cleaning Products Market Revenues & Volume By Stainless Steel Cleaner for the Period 2022 - 2032F
- Historical Data and Forecast of Bahrain Marine Cleaning Products Market Revenues & Volume By Teak Cleaner for the Period 2022 - 2032F
- Historical Data and Forecast of Bahrain Marine Cleaning Products Market Revenues & Volume By Engine Cleaner for the Period 2022 - 2032F
- Historical Data and Forecast of Bahrain Marine Cleaning Products Market Revenues & Volume By Hull Cleaner for the Period 2022 - 2032F
- Historical Data and Forecast of Bahrain Marine Cleaning Products Market Revenues & Volume By Others for the Period 2022 - 2032F
- Historical Data and Forecast of Bahrain Marine Cleaning Products Market Revenues & Volume By Application for the Period 2022 - 2032F
- Historical Data and Forecast of Bahrain Marine Cleaning Products Market Revenues & Volume By Decks for the Period 2022 - 2032F
- Historical Data and Forecast of Bahrain Marine Cleaning Products Market Revenues & Volume By Hulls for the Period 2022 - 2032F
- Historical Data and Forecast of Bahrain Marine Cleaning Products Market Revenues & Volume By Machinery for the Period 2022 - 2032F
- Historical Data and Forecast of Bahrain Marine Cleaning Products Market Revenues & Volume By Walls for the Period 2022 - 2032F
- Historical Data and Forecast of Bahrain Marine Cleaning Products Market Revenues & Volume By Engine Rooms for the Period 2022 - 2032F
- Historical Data and Forecast of Bahrain Marine Cleaning Products Market Revenues & Volume By Bilges for the Period 2022 - 2032F
- Historical Data and Forecast of Bahrain Marine Cleaning Products Market Revenues & Volume By Others for the Period 2022 - 2032F
- Historical Data and Forecast of Bahrain Marine Cleaning Products Market Revenues & Volume By End-Use for the Period 2022 - 2032F
- Historical Data and Forecast of Bahrain Marine Cleaning Products Market Revenues & Volume By Passenger Ship for the Period 2022 - 2032F
- Historical Data and Forecast of Bahrain Marine Cleaning Products Market Revenues & Volume By Cargo Ship for the Period 2022 - 2032F
- Historical Data and Forecast of Bahrain Marine Cleaning Products Market Revenues & Volume By Fishing Boat for the Period 2022 - 2032F
- Historical Data and Forecast of Bahrain Marine Cleaning Products Market Revenues & Volume By Others for the Period 2022 - 2032F
- Bahrain Marine Cleaning Products Import Export Trade Statistics
- Market Opportunity Assessment By Type
- Market Opportunity Assessment By Application
- Market Opportunity Assessment By End-Use
- Bahrain Marine Cleaning Products Top Companies Market Share
- Bahrain Marine Cleaning Products Competitive Benchmarking By Technical and Operational Parameters
- Bahrain Marine Cleaning Products Company Profiles
- Bahrain Marine Cleaning Products Key Strategic Recommendations
Bahrain Marine Cleaning Products Market (2026-2032): FAQs
6Wresearch actively monitors the Bahrain Marine Cleaning Products Market and publishes its comprehensive annual report, highlighting emerging trends, growth drivers, revenue analysis, and forecast outlook. Our insights help businesses to make data-backed strategic decisions with ongoing market dynamics. Our analysts track relevent industries related to the Bahrain Marine Cleaning Products Market, allowing our clients with actionable intelligence and reliable forecasts tailored to emerging regional needs.
Yes, we provide customisation as per your requirements. To learn more, feel free to contact us on sales@6wresearch.com
1 Executive Summary |
2 Introduction |
2.1 Key Highlights of the Report |
2.2 Report Description |
2.3 Market Scope & Segmentation |
2.4 Research Methodology |
2.5 Assumptions |
3 Bahrain Marine Cleaning Products Market Overview |
3.1 Bahrain Country Macro Economic Indicators |
3.2 Bahrain Marine Cleaning Products Market Revenues & Volume, 2022 & 2032F |
3.3 Bahrain Marine Cleaning Products Market - Industry Life Cycle |
3.4 Bahrain Marine Cleaning Products Market - Porter's Five Forces |
3.5 Bahrain Marine Cleaning Products Market Revenues & Volume Share, By Type, 2022 & 2032F |
3.6 Bahrain Marine Cleaning Products Market Revenues & Volume Share, By Application, 2022 & 2032F |
3.7 Bahrain Marine Cleaning Products Market Revenues & Volume Share, By End-Use, 2022 & 2032F |
4 Bahrain Marine Cleaning Products Market Dynamics |
4.1 Impact Analysis |
4.2 Market Drivers |
4.2.1 Increasing maritime activities in Bahrain |
4.2.2 Stringent environmental regulations promoting the use of eco-friendly cleaning products |
4.2.3 Growth in the tourism sector leading to higher demand for marine cleaning products |
4.3 Market Restraints |
4.3.1 Fluctuating raw material prices affecting product costs |
4.3.2 Competition from substitute products or traditional cleaning methods |
5 Bahrain Marine Cleaning Products Market Trends |
6 Bahrain Marine Cleaning Products Market, By Types |
6.1 Bahrain Marine Cleaning Products Market, By Type |
6.1.1 Overview and Analysis |
6.1.2 Bahrain Marine Cleaning Products Market Revenues & Volume, By Type, 2022-2032F |
6.1.3 Bahrain Marine Cleaning Products Market Revenues & Volume, By Stainless Steel Cleaner, 2022-2032F |
6.1.4 Bahrain Marine Cleaning Products Market Revenues & Volume, By Teak Cleaner, 2022-2032F |
6.1.5 Bahrain Marine Cleaning Products Market Revenues & Volume, By Engine Cleaner, 2022-2032F |
6.1.6 Bahrain Marine Cleaning Products Market Revenues & Volume, By Hull Cleaner, 2022-2032F |
6.1.7 Bahrain Marine Cleaning Products Market Revenues & Volume, By Others, 2022-2032F |
6.2 Bahrain Marine Cleaning Products Market, By Application |
6.2.1 Overview and Analysis |
6.2.2 Bahrain Marine Cleaning Products Market Revenues & Volume, By Decks, 2022-2032F |
6.2.3 Bahrain Marine Cleaning Products Market Revenues & Volume, By Hulls, 2022-2032F |
6.2.4 Bahrain Marine Cleaning Products Market Revenues & Volume, By Machinery, 2022-2032F |
6.2.5 Bahrain Marine Cleaning Products Market Revenues & Volume, By Walls, 2022-2032F |
6.2.6 Bahrain Marine Cleaning Products Market Revenues & Volume, By Engine Rooms, 2022-2032F |
6.2.7 Bahrain Marine Cleaning Products Market Revenues & Volume, By Bilges, 2022-2032F |
6.3 Bahrain Marine Cleaning Products Market, By End-Use |
6.3.1 Overview and Analysis |
6.3.2 Bahrain Marine Cleaning Products Market Revenues & Volume, By Passenger Ship, 2022-2032F |
6.3.3 Bahrain Marine Cleaning Products Market Revenues & Volume, By Cargo Ship, 2022-2032F |
6.3.4 Bahrain Marine Cleaning Products Market Revenues & Volume, By Fishing Boat, 2022-2032F |
6.3.5 Bahrain Marine Cleaning Products Market Revenues & Volume, By Others, 2022-2032F |
7 Bahrain Marine Cleaning Products Market Import-Export Trade Statistics |
7.1 Bahrain Marine Cleaning Products Market Export to Major Countries |
7.2 Bahrain Marine Cleaning Products Market Imports from Major Countries |
8 Bahrain Marine Cleaning Products Market Key Performance Indicators |
8.1 Number of marine vessels using environmentally friendly cleaning products |
8.2 Percentage increase in the adoption of marine cleaning solutions by Bahraini ports |
8.3 Growth in demand for specialized marine cleaning products |
8.4 Rate of compliance with environmental regulations in the maritime sector |
8.5 Number of partnerships or collaborations between marine cleaning product manufacturers and key industry players in Bahrain |
9 Bahrain Marine Cleaning Products Market - Opportunity Assessment |
9.1 Bahrain Marine Cleaning Products Market Opportunity Assessment, By Type, 2022 & 2032F |
9.2 Bahrain Marine Cleaning Products Market Opportunity Assessment, By Application, 2022 & 2032F |
9.3 Bahrain Marine Cleaning Products Market Opportunity Assessment, By End-Use, 2022 & 2032F |
10 Bahrain Marine Cleaning Products Market - Competitive Landscape |
10.1 Bahrain Marine Cleaning Products Market Revenue Share, By Companies, 2025 |
10.2 Bahrain Marine Cleaning Products Market Competitive Benchmarking, By Operating and Technical Parameters |
11 Company Profiles |
12 Recommendations |
13 Disclaimer |
Global Go To Market Strategy - 2030
Export potential enables firms to identify high-growth global markets with greater confidence by combining advanced trade intelligence with a structured quantitative methodology. The framework analyzes emerging demand trends and country-level import patterns while integrating macroeconomic and trade datasets such as GDP and population forecasts, bilateral import–export flows, tariff structures, elasticity differentials between developed and developing economies, geographic distance, and import demand projections. Using weighted trade values from 2020–2024 as the base period to project country-to-country export potential for 2030, these inputs are operationalized through calculated drivers such as gravity model parameters, tariff impact factors, and projected GDP per-capita growth. Through an analysis of hidden potentials, demand hotspots, and market conditions that are most favorable to success, this method enables firms to focus on target countries, maximize returns, and global expansion with data, backed by accuracy.
By factoring in the projected importer demand gap that is currently unmet and could be potential opportunity, it identifies the potential for the Exporter (Country) among 190 countries, against the general trade analysis, which identifies the biggest importer or exporter.
To discover high-growth global markets and optimize your business strategy:
Click Here
Pricing
- Single User License$ 1,995
- Department License$ 2,400
- Site License$ 3,120
- Global License$ 3,795

Leadership Perspectives from Industry Events
Search
Thought Leadership and Analyst Meet


Our Clients
6WResearch In News
- India Air Conditioner Market Set for Strong Rebound in 2026 After Weather-Led Correction and GST-Driven Recovery: 6Wresearch
- ADAS in India: How Automatic Emergency Braking, Blind Spot Detection & Driver Monitoring are Transforming Road Safety
- Doha a strategic location for EV manufacturing hub: IPA Qatar
- Demand for luxury TVs surging in the GCC, says Samsung
- Empowering Growth: The Thriving Journey of Bangladesh’s Cable Industry
- Demand for luxury TVs surging in the GCC, says Samsung
Latest Reports
- Nicaragua RPG Gaming Market (2026-2032)
- New Zealand RPG Gaming Market (2026-2032)
- Netherlands RPG Gaming Market (2026-2032)
- Nauru RPG Gaming Market (2026-2032)
- Namibia RPG Gaming Market (2026-2032)
- Mozambique RPG Gaming Market (2026-2032)
- Montenegro RPG Gaming Market (2026-2032)
- Mongolia RPG Gaming Market (2026-2032)
- Monaco RPG Gaming Market (2026-2032)
- Micronesia RPG Gaming Market (2026-2032)
Industry Events and Analyst Meet

EV India Expo 2026

HIMTEX 2026

India Refining Summit 2026

India EV Show 2026

EV tech India Expo 2026
Whitepaper
- Middle East & Africa Commercial Security Market Click here to view more.
- Middle East & Africa Fire Safety Systems & Equipment Market Click here to view more.
- GCC Drone Market Click here to view more.
- Middle East Lighting Fixture Market Click here to view more.
- GCC Physical & Perimeter Security Market Click here to view more.