Bahrain Neon Gas Market (2026-2032) Outlook | Growth, Trends, Value, Size, Forecast, Share, Industry, Companies, Analysis & Revenue
Market Forecast By Type (Low, High, Ultra High), By Application (Semiconductor, LCD, Imaging and Lighting, Refrigerator, Laser, Medical, Others) And Competitive Landscape
| Product Code: ETC094863 | Publication Date: Jun 2021 | Updated Date: Jun 2026 | Product Type: Report | |
| Publisher: 6Wresearch | Author: Ravi Bhandari | No. of Pages: 70 | No. of Figures: 35 | No. of Tables: 5 |
Bahrain Neon Gas Market Size, Share & Growth Rate
The Bahrain Neon Gas Market was estimated at USD 962 Million in 2025 and is projected to reach USD 1722 Million by 2032, growing at a CAGR of 8.7% from 2026 to 2032. This impressive trajectory is primarily fueled by the rising demand for neon gas in lighting and advertising applications, where its vibrant characteristics enhance visibility. Moreover, the burgeoning electronics industry in Bahrain is increasingly adopting neon gas for high-tech applications, further solidifying its market position.
Bahrain Neon Gas Market Growth Rate Analysis (2021-2032)
The Bahrain neon gas market is experiencing robust growth, with an impressive increase forecasted, escalating from 8.0% in 2021 to a remarkable 12.4% by 2032. This growth can be attributed to rising consumer demand in sectors such as electronics and signage, which rely heavily on neon for innovative applications. Additionally, investments in advanced manufacturing technologies are refining production processes, enhancing efficiency and output. The ongoing energy transition towards sustainable solutions, coupled with supportive policies promoting the usage of noble gases, further bolsters market expansion. The upward trend reflects not just a response to local needs, but also the strategic positioning of Bahrain in the broader regional market, making it an attractive hub for future investments.
Bahrain Neon Gas Market Year-wise Growth Rate and Key Drivers
This graph highlights how the Bahrain Neon Gas Market has steadily grown over the past five years, supported by major growth factors.
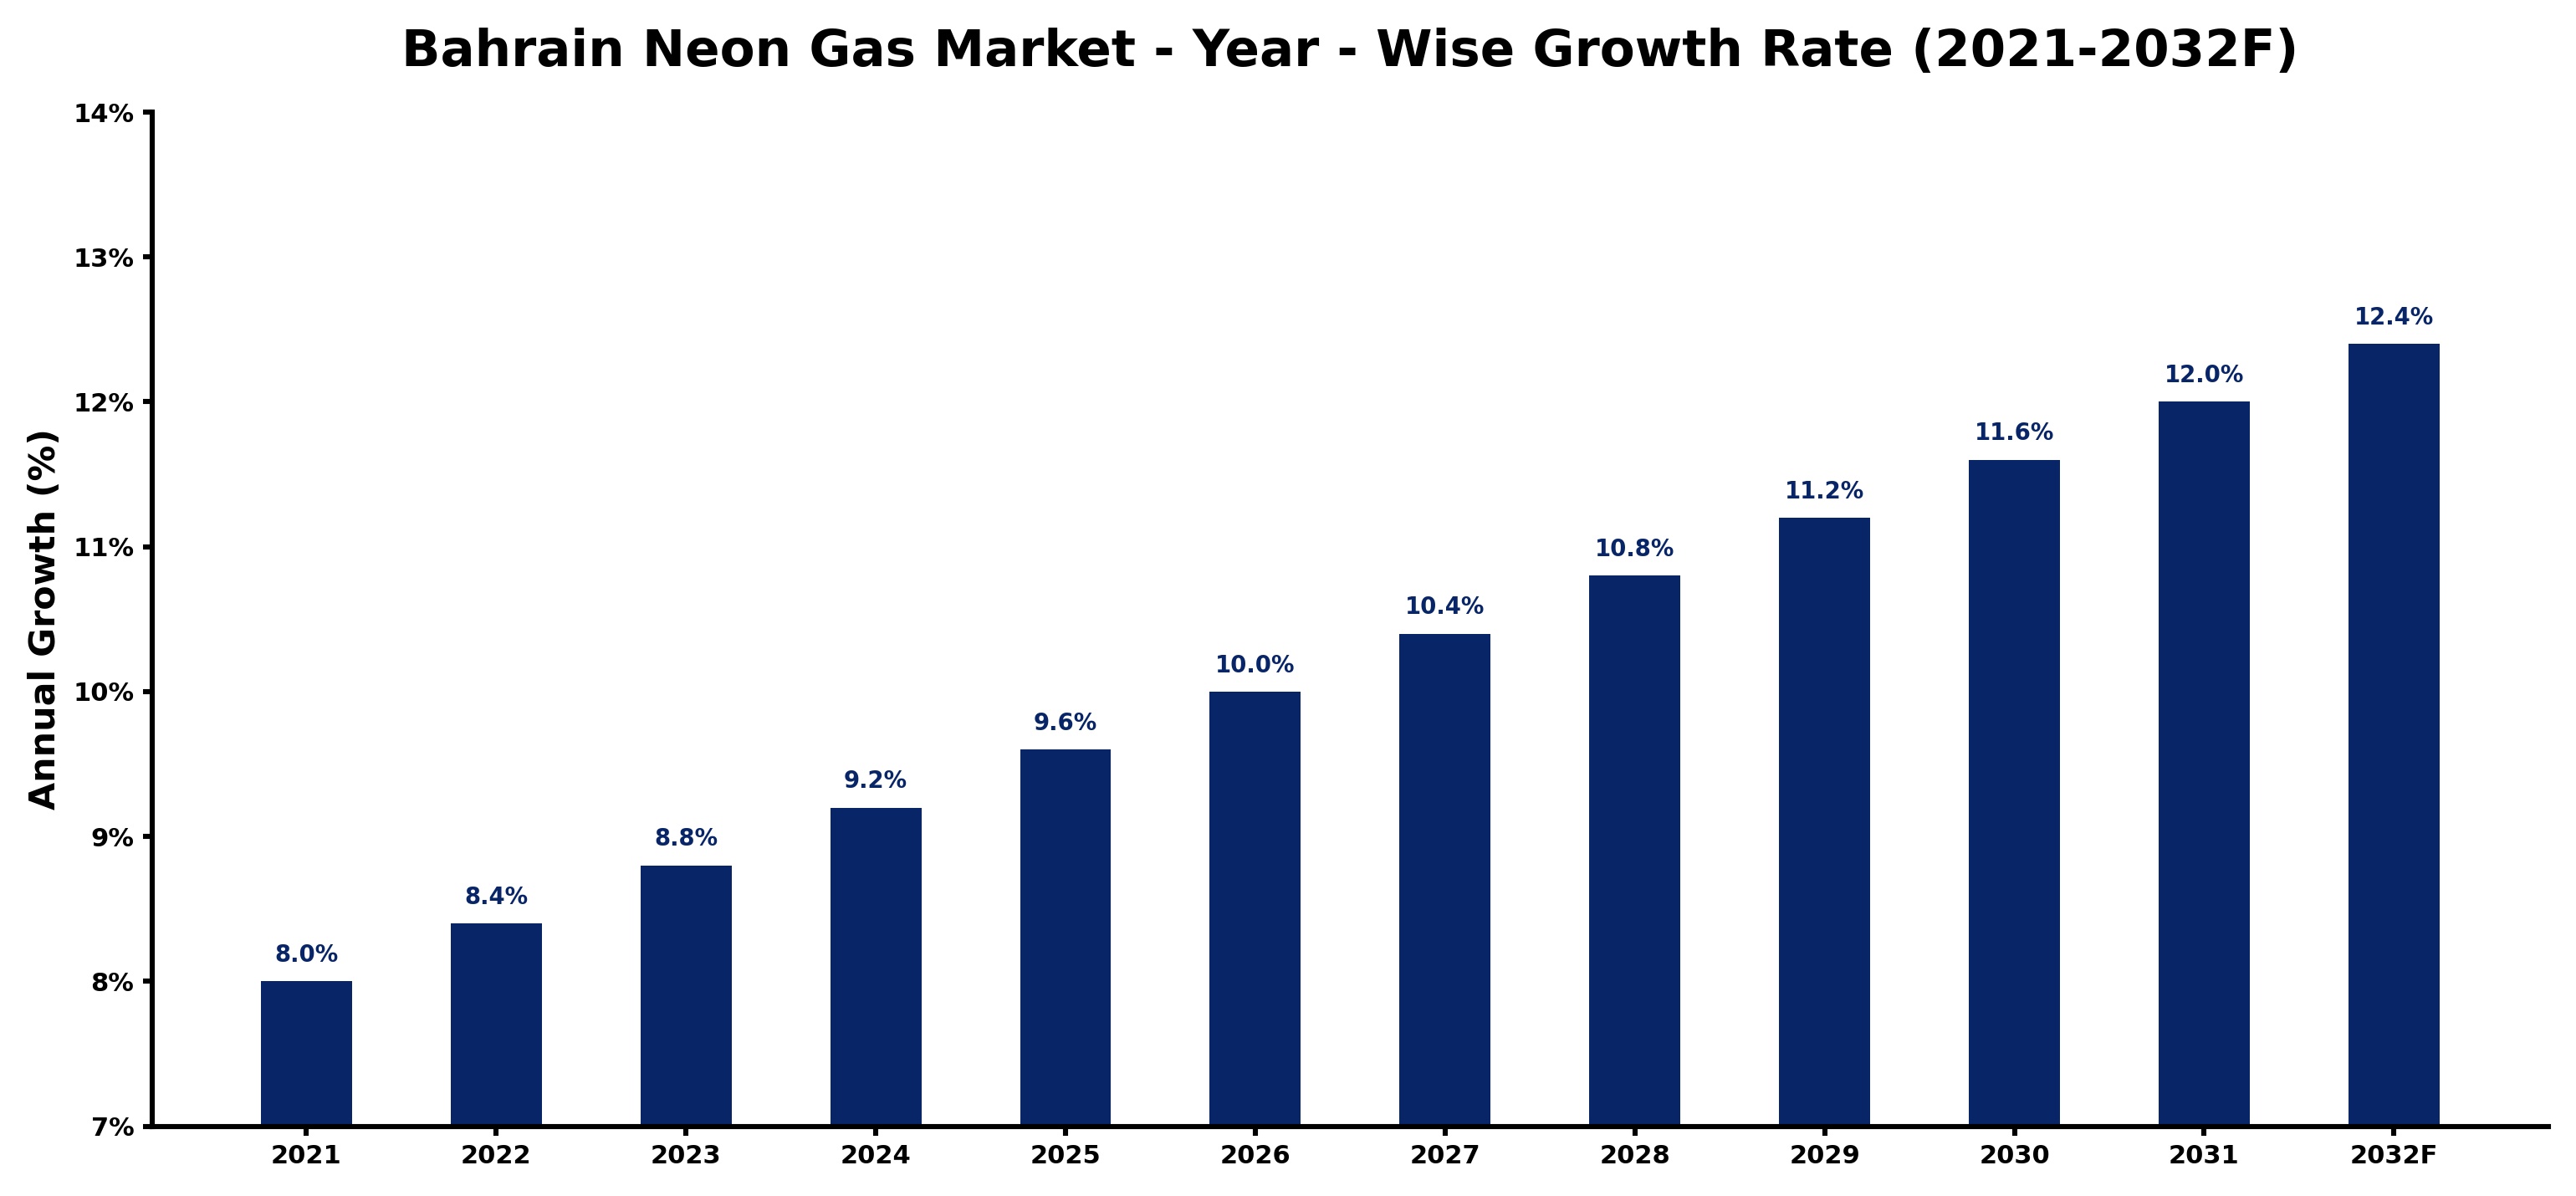
The table below presents the year‑wise growth rates along with the key drivers influencing the market
| Year | Growth Rate | Major Drivers |
| 2021 | 8.0% | Domestic chemical production boosts neon gas manufacturing capabilities |
| 2022 | 8.4% | Technological upgrades in gas production enhance operational efficiency |
| 2023 | 8.8% | New neon plant investments boosted local manufacturing capacity utilization |
| 2024 | 9.2% | New investments in refining infrastructure boosted neon gas production capacity |
| 2025 | 9.6% | Bahrain's industrial modernization drives demand for advanced neon lighting technologies |
| 2026 | 10.0% | Export driven demand spurred investments in neon gas production facilities |
| 2027 | 10.4% | Investment in advanced gas separation technology boosted production efficiency |
| 2028 | 10.8% | Infrastructure development projects boosted demand for specialty gas supplies |
| 2029 | 11.2% | Improved pipeline infrastructure boosted neon gas supply reliability |
| 2030 | 11.6% | Local demand for neon in LEDs spurred regional production investments |
| 2031 | 12.0% | Technology integration in gas processing boosted efficiency and output |
| 2032 | 12.4% | Local neon gas production enhancements boost regional glass manufacturing capacity |
Note - Market size estimations and growth projections presented in this report are based on 6Wresearch’s advanced forecasting approach, validated with industry datasets as of June 2026.
Bahrain Neon Gas Market Synopsis
The most significant force shaping the Bahrain Neon Gas Market currently is the rapid expansion in the lighting and advertising sectors. Neon lights are not only aesthetically pleasing but also a preferred choice for many commercial projects due to their energy efficiency and visual impact. This trend is complemented by the government's push for urban development, contributing to a greater demand for neon in architectural and signage applications.
Additionally, the increased integration of neon in electronic devices is driving demand, as local manufacturers strive to leverage cutting-edge technologies. This synergy between traditional uses of neon and modern applications creates a robust framework for sustained market growth in Bahrain.
Bahrain Neon Gas Market Key Takeaways
- The market is experiencing a significant shift towards energy-efficient lighting solutions.
- Infrastructure development is a major driver of neon gas demand in Bahrain.
- Import dependencies pose risks due to fluctuations in global gas prices.
- Investment opportunities in local production facilities are on the rise.
- Government policies support the growth of high-tech industries, boosting neon gas usage.
Evaluation of Restraints in Bahrain Neon Gas Market
Despite the positive outlook, the Bahrain Neon Gas Market faces notable restraints that could hinder its growth trajectory. The specialized nature of neon gas applications confines its use to select industries, primarily lighting and electronics. Limited local production capabilities add to the challenges, as the market remains heavily reliant on imports, making it vulnerable to supply chain disruptions and price volatility. Additionally, the high costs associated with the production and storage of neon gas present barriers to entry for new players in the market.
Bahrain Neon Gas Market Trends
Current trends in the Bahrain Neon Gas Market indicate a growing preference for innovative lighting solutions, particularly in commercial and public spaces. As businesses increasingly seek to enhance their visibility, the demand for customized neon signage is on the rise. Furthermore, advancements in technology are leading to the incorporation of neon gas in various high-tech applications, including specialized display systems, which is likely to amplify market demand. Sustainability considerations are also shaping the market, with an emphasis on energy-efficient lighting as businesses aim to reduce their carbon footprint.
Bahrain Neon Gas Market Opportunities
The Bahrain Neon Gas Market offers numerous investment opportunities, particularly in local production and distribution. Establishing manufacturing facilities to meet the rising demand for neon gas in electronics and specialized lighting can provide a competitive edge. Moreover, as Bahrain continues to strengthen its infrastructure, opportunities for exporting neon gas to other Gulf Cooperation Council (GCC) countries are emerging, further expanding the market's potential. Investments in research and development to innovate new applications for neon gas could also drive future growth.
Government Initiatives in the Bahrain Neon Gas Market
The Bahraini government recognizes the importance of the neon gas market in supporting high-tech industries and has implemented policies aimed at enhancing industrial growth. Public spending on infrastructure projects directly contributes to increased demand for neon gas, particularly in signage and lighting applications. Regulatory frameworks governing the importation and use of industrial gases ensure safety and environmental compliance, facilitating a stable market environment for neon gas.
Future Insights of the Bahrain Neon Gas Market
Looking ahead to 2026-2032, the Bahrain Neon Gas Market is poised for dynamic growth driven by technological advancements and rising urbanization. The increasing integration of neon in diverse applications will likely solidify its relevance in both traditional and emerging sectors. As local production capabilities expand and export opportunities arise, the market is set to flourish. Additionally, ongoing government support and investment in infrastructure will further enhance the attractiveness of the neon gas market in Bahrain.
Bahrain Neon Gas Market Latest Developments (May 2025 - June 2026)
In recent months, the Bahrain Neon Gas Market has seen a noticeable shift toward innovation, with local stakeholders exploring sustainable production methods and applications. There is a growing emphasis on integrating neon gas in high-tech displays and energy-efficient lighting solutions. The government has launched new initiatives to support industrial growth, further bolstering the market's prospects. Collaborations between various sectors are emerging, focusing on advancing the applications of neon gas in both commercial and residential settings.
Bahrain Neon Gas Market - Key Attractiveness of the Report
- 10 Years of Market Numbers
- Historical Data Starting from 2022 to 2025
- Base Year: 2025
- Forecast Data until 2032
- Key Performance Indicators Impacting the Market
- Major Upcoming Developments and Projects
Key Highlights of the Report:
- Bahrain Neon Gas Market Outlook
- Market Size of Bahrain Neon Gas Market, 2025
- Forecast of Bahrain Neon Gas Market, 2032
- Historical Data and Forecast of Bahrain Neon Gas Revenues & Volume for the Period 2022-2032F
- Bahrain Neon Gas Market Trend Evolution
- Bahrain Neon Gas Market Drivers and Challenges
- Bahrain Neon Gas Price Trends
- Bahrain Neon Gas Porter's Five Forces
- Bahrain Neon Gas Industry Life Cycle
- Historical Data and Forecast of Bahrain Neon Gas Market Revenues & Volume By Type for the Period 2022-2032F
- Historical Data and Forecast of Bahrain Neon Gas Market Revenues & Volume By Low for the Period 2022-2032F
- Historical Data and Forecast of Bahrain Neon Gas Market Revenues & Volume By High for the Period 2022-2032F
- Historical Data and Forecast of Bahrain Neon Gas Market Revenues & Volume By Ultra High for the Period 2022-2032F
- Historical Data and Forecast of Bahrain Neon Gas Market Revenues & Volume By Application for the Period 2022-2032F
- Historical Data and Forecast of Bahrain Neon Gas Market Revenues & Volume By Semiconductor for the Period 2022-2032F
- Historical Data and Forecast of Bahrain Neon Gas Market Revenues & Volume By LCD for the Period 2022-2032F
- Historical Data and Forecast of Bahrain Neon Gas Market Revenues & Volume By Imaging and Lighting for the Period 2022-2032F
- Historical Data and Forecast of Bahrain Neon Gas Market Revenues & Volume By Refrigerator for the Period 2022-2032F
- Historical Data and Forecast of Bahrain Neon Gas Market Revenues & Volume By Laser for the Period 2022-2032F
- Historical Data and Forecast of Bahrain Neon Gas Market Revenues & Volume By Medical for the Period 2022-2032F
- Historical Data and Forecast of Bahrain Neon Gas Market Revenues & Volume By Others for the Period 2022-2032F
- Bahrain Neon Gas Import Export Trade Statistics
- Market Opportunity Assessment By Type
- Market Opportunity Assessment By Application
- Bahrain Neon Gas Top Companies Market Share
- Bahrain Neon Gas Competitive Benchmarking By Technical and Operational Parameters
- Bahrain Neon Gas Company Profiles
- Bahrain Neon Gas Key Strategic Recommendations
Bahrain Neon Gas Market - Frequently Asked Questions
The Bahrain Neon Gas Market is projected to reach USD 1722 Million by 2032, growing from USD 962 Million in 2025 at a CAGR of 8.7% from 2026 to 2032.
Urban development drives demand for neon gas as cities expand, increasing the need for eye-catching signage and innovative lighting solutions.
Government initiatives aim to promote industrial growth and ensure a stable supply of industrial gases, positively impacting the demand for neon gas.
Yes, there are significant opportunities for establishing local production facilities and exploring export markets to other GCC countries.
The primary applications include commercial lighting, signage, and specialized uses within the electronics industry, contributing to the market's growth.
Import dependency makes the market susceptible to global gas price fluctuations and supply chain disruptions, which can affect availability and pricing.
6Wresearch actively monitors the Bahrain Neon Gas Market and publishes its comprehensive annual report, highlighting emerging trends, growth drivers, revenue analysis, and forecast outlook. Our insights help businesses to make data-backed strategic decisions with ongoing market dynamics. Our analysts track relevent industries related to the Bahrain Neon Gas Market, allowing our clients with actionable intelligence and reliable forecasts tailored to emerging regional needs.
Yes, we provide customisation as per your requirements. To learn more, feel free to contact us on sales@6wresearch.com
1 Executive Summary |
2 Introduction |
2.1 Key Highlights of the Report |
2.2 Report Description |
2.3 Market Scope & Segmentation |
2.4 Research Methodology |
2.5 Assumptions |
3 Bahrain Neon Gas Market Overview |
3.1 Bahrain Country Macro Economic Indicators |
3.2 Bahrain Neon Gas Market Revenues & Volume, 2022 & 2032F |
3.3 Bahrain Neon Gas Market - Industry Life Cycle |
3.4 Bahrain Neon Gas Market - Porter's Five Forces |
3.5 Bahrain Neon Gas Market Revenues & Volume Share, By Type, 2022 & 2032F |
3.6 Bahrain Neon Gas Market Revenues & Volume Share, By Form, 2022 & 2032F |
4 Bahrain Neon Gas Market Dynamics |
4.1 Impact Analysis |
4.2 Market Drivers |
4.3 Market Restraints |
5 Bahrain Neon Gas Market Trends |
6 Bahrain Neon Gas Market, By Types |
6.1 Bahrain Neon Gas Market, By Type |
6.1.1 Overview and Analysis |
6.1.2 Bahrain Neon Gas Market Revenues & Volume, By Type, 2022-2032F |
6.1.3 Bahrain Neon Gas Market Revenues & Volume, By Low, 2022-2032F |
6.1.4 Bahrain Neon Gas Market Revenues & Volume, By High, 2022-2032F |
6.1.5 Bahrain Neon Gas Market Revenues & Volume, By Ultra High, 2022-2032F |
6.2 Bahrain Neon Gas Market, By Application |
6.2.1 Overview and Analysis |
6.2.2 Bahrain Neon Gas Market Revenues & Volume, By Semiconductor, 2022-2032F |
6.2.3 Bahrain Neon Gas Market Revenues & Volume, By LCD, 2022-2032F |
6.2.4 Bahrain Neon Gas Market Revenues & Volume, By Imaging and Lighting, 2022-2032F |
6.2.5 Bahrain Neon Gas Market Revenues & Volume, By Refrigerator, 2022-2032F |
6.2.6 Bahrain Neon Gas Market Revenues & Volume, By Laser, 2022-2032F |
6.2.7 Bahrain Neon Gas Market Revenues & Volume, By Medical, 2022-2032F |
7 Bahrain Neon Gas Market Import-Export Trade Statistics |
7.1 Bahrain Neon Gas Market Export to Major Countries |
7.2 Bahrain Neon Gas Market Imports from Major Countries |
8 Bahrain Neon Gas Market Key Performance Indicators |
9 Bahrain Neon Gas Market - Opportunity Assessment |
9.1 Bahrain Neon Gas Market Opportunity Assessment, By Type, 2022 & 2032F |
9.2 Bahrain Neon Gas Market Opportunity Assessment, By Application, 2022 & 2032F |
10 Bahrain Neon Gas Market - Competitive Landscape |
10.1 Bahrain Neon Gas Market Revenue Share, By Companies, 2025 |
10.2 Bahrain Neon Gas Market Competitive Benchmarking, By Operating and Technical Parameters |
11 Company Profiles |
12 Recommendations |
13 Disclaimer |
Global Go To Market Strategy - 2030
Export potential enables firms to identify high-growth global markets with greater confidence by combining advanced trade intelligence with a structured quantitative methodology. The framework analyzes emerging demand trends and country-level import patterns while integrating macroeconomic and trade datasets such as GDP and population forecasts, bilateral import–export flows, tariff structures, elasticity differentials between developed and developing economies, geographic distance, and import demand projections. Using weighted trade values from 2020–2024 as the base period to project country-to-country export potential for 2030, these inputs are operationalized through calculated drivers such as gravity model parameters, tariff impact factors, and projected GDP per-capita growth. Through an analysis of hidden potentials, demand hotspots, and market conditions that are most favorable to success, this method enables firms to focus on target countries, maximize returns, and global expansion with data, backed by accuracy.
By factoring in the projected importer demand gap that is currently unmet and could be potential opportunity, it identifies the potential for the Exporter (Country) among 190 countries, against the general trade analysis, which identifies the biggest importer or exporter.
To discover high-growth global markets and optimize your business strategy:
Click Here
Pricing
- Single User License$ 1,995
- Department License$ 2,400
- Site License$ 3,120
- Global License$ 3,795

Leadership Perspectives from Industry Events
Search
Thought Leadership and Analyst Meet


Our Clients
6WResearch In News
- India Air Conditioner Market Set for Strong Rebound in 2026 After Weather-Led Correction and GST-Driven Recovery: 6Wresearch
- ADAS in India: How Automatic Emergency Braking, Blind Spot Detection & Driver Monitoring are Transforming Road Safety
- Doha a strategic location for EV manufacturing hub: IPA Qatar
- Demand for luxury TVs surging in the GCC, says Samsung
- Empowering Growth: The Thriving Journey of Bangladesh’s Cable Industry
- Demand for luxury TVs surging in the GCC, says Samsung
Latest Reports
- Nicaragua RPG Gaming Market (2026-2032)
- New Zealand RPG Gaming Market (2026-2032)
- Netherlands RPG Gaming Market (2026-2032)
- Nauru RPG Gaming Market (2026-2032)
- Namibia RPG Gaming Market (2026-2032)
- Mozambique RPG Gaming Market (2026-2032)
- Montenegro RPG Gaming Market (2026-2032)
- Mongolia RPG Gaming Market (2026-2032)
- Monaco RPG Gaming Market (2026-2032)
- Micronesia RPG Gaming Market (2026-2032)
Industry Events and Analyst Meet

HIMTEX 2026

India Refining Summit 2026

India EV Show 2026

EV tech India Expo 2026

Auto Tech Asia 2026
Whitepaper
- Middle East & Africa Commercial Security Market Click here to view more.
- Middle East & Africa Fire Safety Systems & Equipment Market Click here to view more.
- GCC Drone Market Click here to view more.
- Middle East Lighting Fixture Market Click here to view more.
- GCC Physical & Perimeter Security Market Click here to view more.