Oman Neon Gas Market (2026-2032) Outlook | Companies, Forecast, Trends, Revenue, Analysis, Size, Share, Growth, Value & Industry
Market Forecast By Type (Low, High, Ultra High), By Application (Semiconductor, LCD, Imaging and Lighting, Refrigerator, Laser, Medical, Others) And Competitive Landscape
| Product Code: ETC094862 | Publication Date: Jun 2021 | Updated Date: Jun 2026 | Product Type: Report | |
| Publisher: 6Wresearch | Author: Bhawna Singh | No. of Pages: 70 | No. of Figures: 35 | No. of Tables: 5 |
Oman Neon Gas Market Size, Share & Growth Rate
The Oman Neon Gas Market was estimated at USD 225 Million in 2025 and is projected to reach USD 317 Million by 2032, growing at a CAGR of 5.0% from 2026 to 2032. This growth is primarily driven by the surging demand across various sectors including healthcare, electronics, and automotive applications. As industries increasingly adopt neon gas for its unique properties in lighting and signage, the market in Oman is poised for significant expansion.
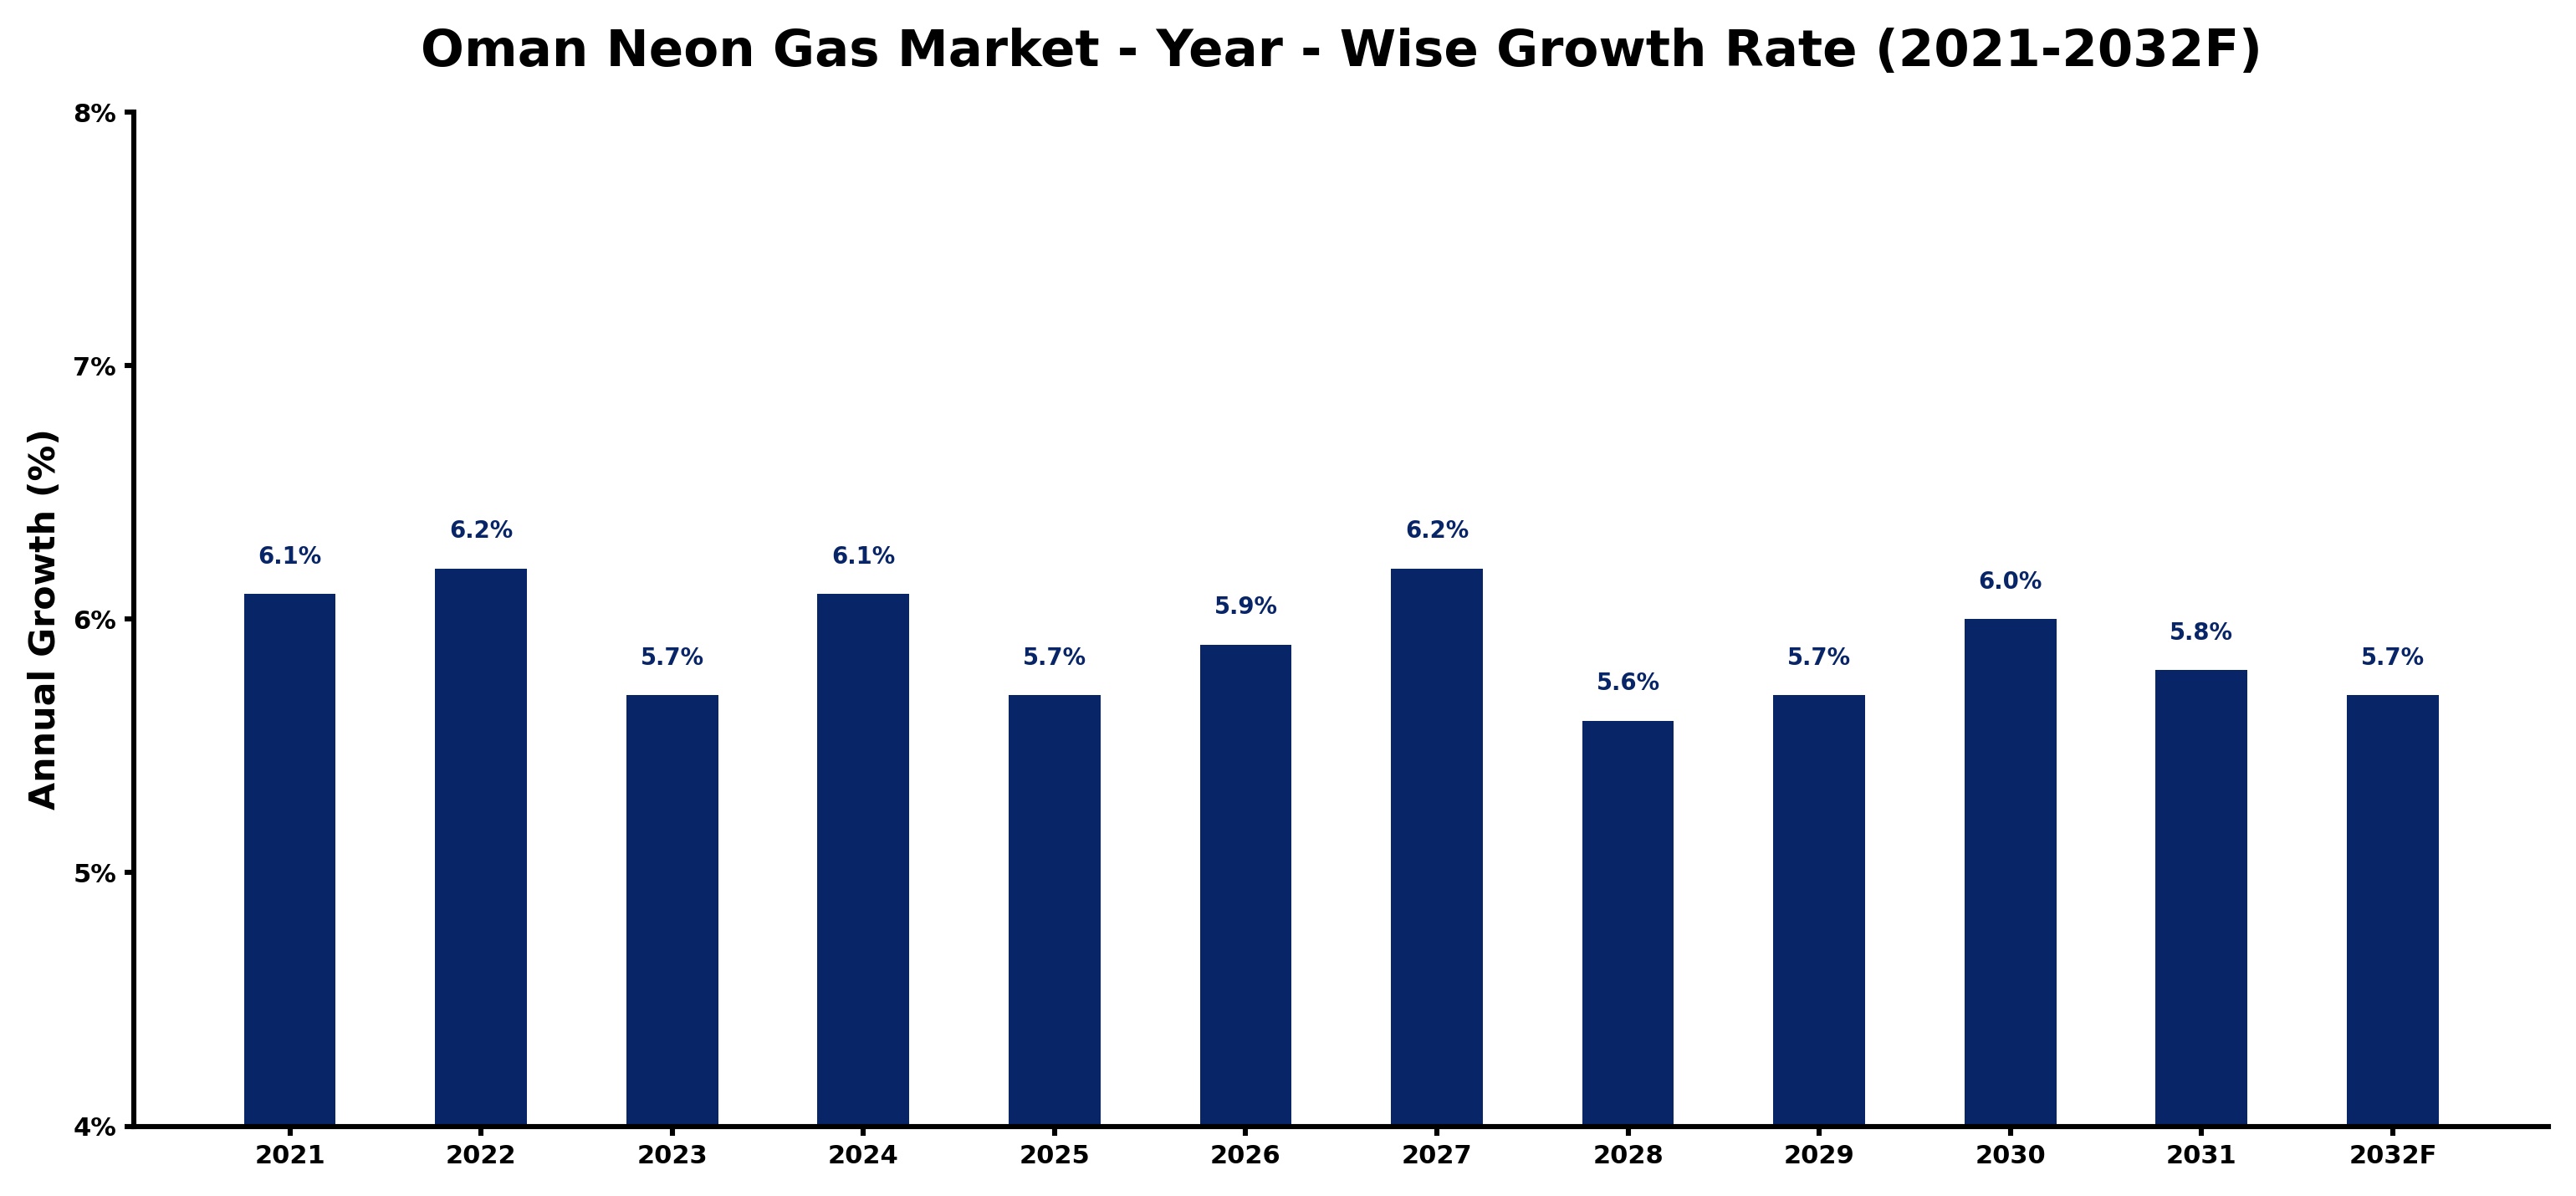
Oman Neon Gas Market Growth Rate Analysis (2021-2032)
The Oman Neon Gas market has exhibited stable growth, with a slight uptick in growth rates from 6.1% in 2021 to 6.2% in 2022, driven primarily by increasing demand from the electronics and healthcare sectors. However, growth moderated to 5.7% in 2023 due to supply chain disruptions and global inflationary pressures. As the market rebounds, growth is projected to stabilize around 6.1% in 2024 and 6.2% in 2027, as investments in infrastructure and technology accelerate amidst government policies favoring energy transition. The market is poised for a gradual recovery, with growth rates ranging between 5.6% and 6.0% through 2032, reflecting a resilient consumer demand and ongoing digitalization efforts.
Oman Neon Gas Market Year-wise Growth Rate and Key Drivers
This graph highlights how the Oman Neon Gas Market has steadily grown over the past five years, supported by major growth factors.
The table below presents the year‑wise growth rates along with the key drivers influencing the market
| Year | Growth Rate | Major Drivers |
| 2021 | 6.1% | Upgraded neon gas production facilities boosted overall market efficiency |
| 2022 | 6.2% | Export driven demand boosts neon gas production facility investments |
| 2023 | 5.7% | Gas supply stabilization boosted downstream neon production capabilities |
| 2024 | 6.1% | Modernized production techniques boost neon gas manufacturing capacity |
| 2025 | 5.7% | Technology upgrades in neon gas production boosted export capabilities |
| 2026 | 5.9% | Local manufacturers invest in advanced neon gas production facilities |
| 2027 | 6.2% | Higher industrial gas supply investments bolster neon production capabilities |
| 2028 | 5.6% | Advanced sensor integration optimized neon gas production efficiency |
| 2029 | 5.7% | Capacity upgrades in neon gas facilities enhanced output efficiency |
| 2030 | 6.0% | Modernized chemical processing plants drive neon gas production capacity |
| 2031 | 5.8% | New gas processing plants boost local neon gas production capacity |
| 2032 | 5.7% | Manufacturing investments in renewable energy bolster neon gas demand |
Note - Market size estimations and growth projections presented in this report are based on 6Wresearch’s advanced forecasting approach, validated with industry datasets as of June 2026.
Oman Neon Gas Market Synopsis
Recent developments in the Oman neon gas market highlight a vibrant landscape characterized by escalating interest from both commercial and residential sectors. The resurgence of neon lighting as a popular aesthetic choice has invigorated demand, particularly in urban areas.
Moreover, advancements in technology are facilitating the enhancement of neon gas applications, thus broadening its utility in new domains. This, combined with ongoing urbanization and industrial growth, sets a favorable stage for the market's progression.
Oman Neon Gas Market Key Takeaways
- The market is experiencing rising demand fueled by various industrial applications.
- Strategic partnerships and product innovations are crucial for market players to enhance their presence.
- Growing popularity of neon signs is significantly impacting market dynamics.
- Technological advancements are improving production efficiency and quality.
- Government policies are actively shaping the regulatory landscape of the neon gas market.
Evaluation of Restraints in Oman Neon Gas Market
Despite the positive growth trajectory, the Oman neon gas market faces several significant challenges. Chief among these are the fluctuations in raw material prices, which can directly impact production costs and market stability. Additionally, the availability of skilled labor for the handling and operation of specialized neon gas equipment is limited, creating operational inefficiencies. Regulatory complexities surrounding the safe storage and transportation of neon gas further complicate market dynamics, necessitating compliance strategies that can be resource-intensive for businesses. These factors, if unaddressed, could stymie the market's potential for growth.
Oman Neon Gas Market Trends
The Oman neon gas market is currently influenced by several emerging trends. Notably, the electronics and healthcare sectors are witnessing an increased demand for neon gas, particularly in applications involving advanced lighting and medical equipment. Furthermore, the use of neon in creative advertising and decorative displays continues to gain traction, enhancing its visibility in the entertainment sector. Concurrently, technological innovations in the production and purification processes of neon gas are leading to improved product offerings that are both efficient and high-quality, further supporting market growth.
Oman Neon Gas Market Opportunities
Investment opportunities abound within the Oman neon gas market as demand for the gas expands across multiple industries. Investors are encouraged to consider initiatives in production facilities and distribution networks tailored to local needs. Moreover, entering strategic partnerships with industry stakeholders or pursuing research and development efforts focused on innovative applications can yield substantial returns. The ongoing shift toward energy-efficient lighting and unique decorative solutions presents fertile ground for new ventures and expansions in the market.
Government Initiatives in the Oman Neon Gas Market
The Omani government has enacted several policies aimed at regulating the neon gas sector, focusing on safety and environmental sustainability. These policies include stringent licensing requirements for production facilities and guidelines to ensure the safe handling and storage of neon gas. Additionally, there are incentives designed to foster the use of neon gas in high-tech applications, including semiconductor manufacturing and specialized lighting solutions. The government's supportive stance underscores a commitment to both industry growth and the protection of public health and safety.
Future Insights of the Oman Neon Gas Market
Looking ahead to the period of 2026-2032, the Oman neon gas market is set to flourish, driven by heightened industrial applications in sectors such as healthcare and electronics. The continued demand for neon gas in traditional applications like signage, alongside its emerging roles in advanced technologies, positions the market for consistent expansion. However, fluctuations in raw material sourcing and regulatory compliance will necessitate vigilant management. Overall, the outlook remains optimistic, with substantial opportunities for innovation and growth on the horizon.
Oman Neon Gas Market Latest Developments (May 2025 - June 2026)
Recent developments in the Oman neon gas market indicate a shift towards increased collaboration among industry players to enhance product offerings and address market challenges. Companies are exploring innovative production techniques aimed at reducing costs while improving the quality of neon gas. Furthermore, there is a rising focus on sustainable practices in production and distribution, reflecting a broader commitment to environmental stewardship within the sector.
Oman Neon Gas Market - Key Attractiveness of the Report
- 10 Years of Market Numbers
- Historical Data Starting from 2022 to 2025
- Base Year: 2025
- Forecast Data until 2032
- Key Performance Indicators Impacting the Market
- Major Upcoming Developments and Projects
Key Highlights of the Report:
- Oman Neon Gas Market Outlook
- Market Size of Oman Neon Gas Market, 2025
- Forecast of Oman Neon Gas Market, 2032
- Historical Data and Forecast of Oman Neon Gas Revenues & Volume for the Period 2022-2032F
- Oman Neon Gas Market Trend Evolution
- Oman Neon Gas Market Drivers and Challenges
- Oman Neon Gas Price Trends
- Oman Neon Gas Porter's Five Forces
- Oman Neon Gas Industry Life Cycle
- Historical Data and Forecast of Oman Neon Gas Market Revenues & Volume By Type for the Period 2022-2032F
- Historical Data and Forecast of Oman Neon Gas Market Revenues & Volume By Low for the Period 2022-2032F
- Historical Data and Forecast of Oman Neon Gas Market Revenues & Volume By High for the Period 2022-2032F
- Historical Data and Forecast of Oman Neon Gas Market Revenues & Volume By Ultra High for the Period 2022-2032F
- Historical Data and Forecast of Oman Neon Gas Market Revenues & Volume By Application for the Period 2022-2032F
- Historical Data and Forecast of Oman Neon Gas Market Revenues & Volume By Semiconductor for the Period 2022-2032F
- Historical Data and Forecast of Oman Neon Gas Market Revenues & Volume By LCD for the Period 2022-2032F
- Historical Data and Forecast of Oman Neon Gas Market Revenues & Volume By Imaging and Lighting for the Period 2022-2032F
- Historical Data and Forecast of Oman Neon Gas Market Revenues & Volume By Refrigerator for the Period 2022-2032F
- Historical Data and Forecast of Oman Neon Gas Market Revenues & Volume By Laser for the Period 2022-2032F
- Historical Data and Forecast of Oman Neon Gas Market Revenues & Volume By Medical for the Period 2022-2032F
- Historical Data and Forecast of Oman Neon Gas Market Revenues & Volume By Others for the Period 2022-2032F
- Oman Neon Gas Import Export Trade Statistics
- Market Opportunity Assessment By Type
- Market Opportunity Assessment By Application
- Oman Neon Gas Top Companies Market Share
- Oman Neon Gas Competitive Benchmarking By Technical and Operational Parameters
- Oman Neon Gas Company Profiles
- Oman Neon Gas Key Strategic Recommendations
Oman Neon Gas Market - Frequently Asked Questions
The Oman Neon Gas Market is estimated at USD 225 Million in 2025 and is projected to grow to USD 317 Million by 2032, reflecting a robust CAGR of 5.0% from 2026 to 2032.
The healthcare sector is increasingly utilizing neon gas for applications such as cryosurgery and advanced medical equipment, driving a significant portion of market demand.
Businesses often grapple with fluctuating raw material costs and complex regulatory frameworks that govern the safe handling and transportation of neon gas.
Yes, there have been advancements in purification processes that enhance the efficiency and quality of neon gas products, aligning with the growing market demand.
The Omani government enforces policies that regulate production and safety standards, encouraging sustainable practices while promoting the growth of the neon gas market.
The electronics and advertising sectors are anticipated to lead the growth in neon gas demand, driven by an increase in decorative uses and technological applications.
6Wresearch actively monitors the Oman Neon Gas Market and publishes its comprehensive annual report, highlighting emerging trends, growth drivers, revenue analysis, and forecast outlook. Our insights help businesses to make data-backed strategic decisions with ongoing market dynamics. Our analysts track relevent industries related to the Oman Neon Gas Market, allowing our clients with actionable intelligence and reliable forecasts tailored to emerging regional needs.
Yes, we provide customisation as per your requirements. To learn more, feel free to contact us on sales@6wresearch.com
1 Executive Summary |
2 Introduction |
2.1 Key Highlights of the Report |
2.2 Report Description |
2.3 Market Scope & Segmentation |
2.4 Research Methodology |
2.5 Assumptions |
3 Oman Neon Gas Market Overview |
3.1 Oman Country Macro Economic Indicators |
3.2 Oman Neon Gas Market Revenues & Volume, 2022 & 2032F |
3.3 Oman Neon Gas Market - Industry Life Cycle |
3.4 Oman Neon Gas Market - Porter's Five Forces |
3.5 Oman Neon Gas Market Revenues & Volume Share, By Type, 2022 & 2032F |
3.6 Oman Neon Gas Market Revenues & Volume Share, By Form, 2022 & 2032F |
4 Oman Neon Gas Market Dynamics |
4.1 Impact Analysis |
4.2 Market Drivers |
4.3 Market Restraints |
5 Oman Neon Gas Market Trends |
6 Oman Neon Gas Market, By Types |
6.1 Oman Neon Gas Market, By Type |
6.1.1 Overview and Analysis |
6.1.2 Oman Neon Gas Market Revenues & Volume, By Type, 2022-2032F |
6.1.3 Oman Neon Gas Market Revenues & Volume, By Low, 2022-2032F |
6.1.4 Oman Neon Gas Market Revenues & Volume, By High, 2022-2032F |
6.1.5 Oman Neon Gas Market Revenues & Volume, By Ultra High, 2022-2032F |
6.2 Oman Neon Gas Market, By Application |
6.2.1 Overview and Analysis |
6.2.2 Oman Neon Gas Market Revenues & Volume, By Semiconductor, 2022-2032F |
6.2.3 Oman Neon Gas Market Revenues & Volume, By LCD, 2022-2032F |
6.2.4 Oman Neon Gas Market Revenues & Volume, By Imaging and Lighting, 2022-2032F |
6.2.5 Oman Neon Gas Market Revenues & Volume, By Refrigerator, 2022-2032F |
6.2.6 Oman Neon Gas Market Revenues & Volume, By Laser, 2022-2032F |
6.2.7 Oman Neon Gas Market Revenues & Volume, By Medical, 2022-2032F |
7 Oman Neon Gas Market Import-Export Trade Statistics |
7.1 Oman Neon Gas Market Export to Major Countries |
7.2 Oman Neon Gas Market Imports from Major Countries |
8 Oman Neon Gas Market Key Performance Indicators |
9 Oman Neon Gas Market - Opportunity Assessment |
9.1 Oman Neon Gas Market Opportunity Assessment, By Type, 2022 & 2032F |
9.2 Oman Neon Gas Market Opportunity Assessment, By Application, 2022 & 2032F |
10 Oman Neon Gas Market - Competitive Landscape |
10.1 Oman Neon Gas Market Revenue Share, By Companies, 2025 |
10.2 Oman Neon Gas Market Competitive Benchmarking, By Operating and Technical Parameters |
11 Company Profiles |
12 Recommendations |
13 Disclaimer |
Global Go To Market Strategy - 2030
Export potential enables firms to identify high-growth global markets with greater confidence by combining advanced trade intelligence with a structured quantitative methodology. The framework analyzes emerging demand trends and country-level import patterns while integrating macroeconomic and trade datasets such as GDP and population forecasts, bilateral import–export flows, tariff structures, elasticity differentials between developed and developing economies, geographic distance, and import demand projections. Using weighted trade values from 2020–2024 as the base period to project country-to-country export potential for 2030, these inputs are operationalized through calculated drivers such as gravity model parameters, tariff impact factors, and projected GDP per-capita growth. Through an analysis of hidden potentials, demand hotspots, and market conditions that are most favorable to success, this method enables firms to focus on target countries, maximize returns, and global expansion with data, backed by accuracy.
By factoring in the projected importer demand gap that is currently unmet and could be potential opportunity, it identifies the potential for the Exporter (Country) among 190 countries, against the general trade analysis, which identifies the biggest importer or exporter.
To discover high-growth global markets and optimize your business strategy:
Click Here
Pricing
- Single User License$ 1,995
- Department License$ 2,400
- Site License$ 3,120
- Global License$ 3,795

Leadership Perspectives from Industry Events
Search
Thought Leadership and Analyst Meet


Our Clients
6WResearch In News
- India Air Conditioner Market Set for Strong Rebound in 2026 After Weather-Led Correction and GST-Driven Recovery: 6Wresearch
- ADAS in India: How Automatic Emergency Braking, Blind Spot Detection & Driver Monitoring are Transforming Road Safety
- Doha a strategic location for EV manufacturing hub: IPA Qatar
- Demand for luxury TVs surging in the GCC, says Samsung
- Empowering Growth: The Thriving Journey of Bangladesh’s Cable Industry
- Demand for luxury TVs surging in the GCC, says Samsung
Latest Reports
- Poland Fire Protection Systems Market (2026-2032)
- Cape Verde Portable Hand-Thrown Extinguisher Market (2026-2032)
- Canada Portable Hand-Thrown Extinguisher Market (2026-2032)
- Cameroon Portable Hand-Thrown Extinguisher Market (2026-2032)
- Burundi Portable Hand-Thrown Extinguisher Market (2026-2032)
- Burkina Faso Portable Hand-Thrown Extinguisher Market (2026-2032)
- Bulgaria Portable Hand-Thrown Extinguisher Market (2026-2032)
- Brunei Portable Hand-Thrown Extinguisher Market (2026-2032)
- Botswana Portable Hand-Thrown Extinguisher Market (2026-2032)
- Bosnia and Herzegovina Portable Hand-Thrown Extinguisher Market (2026-2032)
Industry Events and Analyst Meet

HIMTEX 2026

India Refining Summit 2026

India EV Show 2026

EV tech India Expo 2026

Auto Tech Asia 2026
Whitepaper
- Middle East & Africa Commercial Security Market Click here to view more.
- Middle East & Africa Fire Safety Systems & Equipment Market Click here to view more.
- GCC Drone Market Click here to view more.
- Middle East Lighting Fixture Market Click here to view more.
- GCC Physical & Perimeter Security Market Click here to view more.