Jordan Neon Gas Market (2026-2032) Outlook | Value, Companies, Growth, Share, Revenue, Trends, Industry, Analysis, Size & Forecast
Market Forecast By Type (Low, High, Ultra High), By Application (Semiconductor, LCD, Imaging and Lighting, Refrigerator, Laser, Medical, Others) And Competitive Landscape
| Product Code: ETC094865 | Publication Date: Jun 2021 | Updated Date: Jun 2026 | Product Type: Report | |
| Publisher: 6Wresearch | Author: Sachin Kumar Rai | No. of Pages: 70 | No. of Figures: 35 | No. of Tables: 5 |
Jordan Neon Gas Market Size, Share & Growth Rate
The Jordan Neon Gas Market was estimated at USD 220 Million in 2025 and is projected to reach USD 291 Million by 2032, growing at a CAGR of 4.1% from 2026 to 2032. This growth trajectory is primarily driven by the increasing utilization of neon gas in vibrant advertising signage, critical healthcare applications, and advancements in the electronics sector, particularly in plasma display technology. As industries strive for energy-efficient solutions, the adoption of neon gas continues to gain momentum in Jordan.
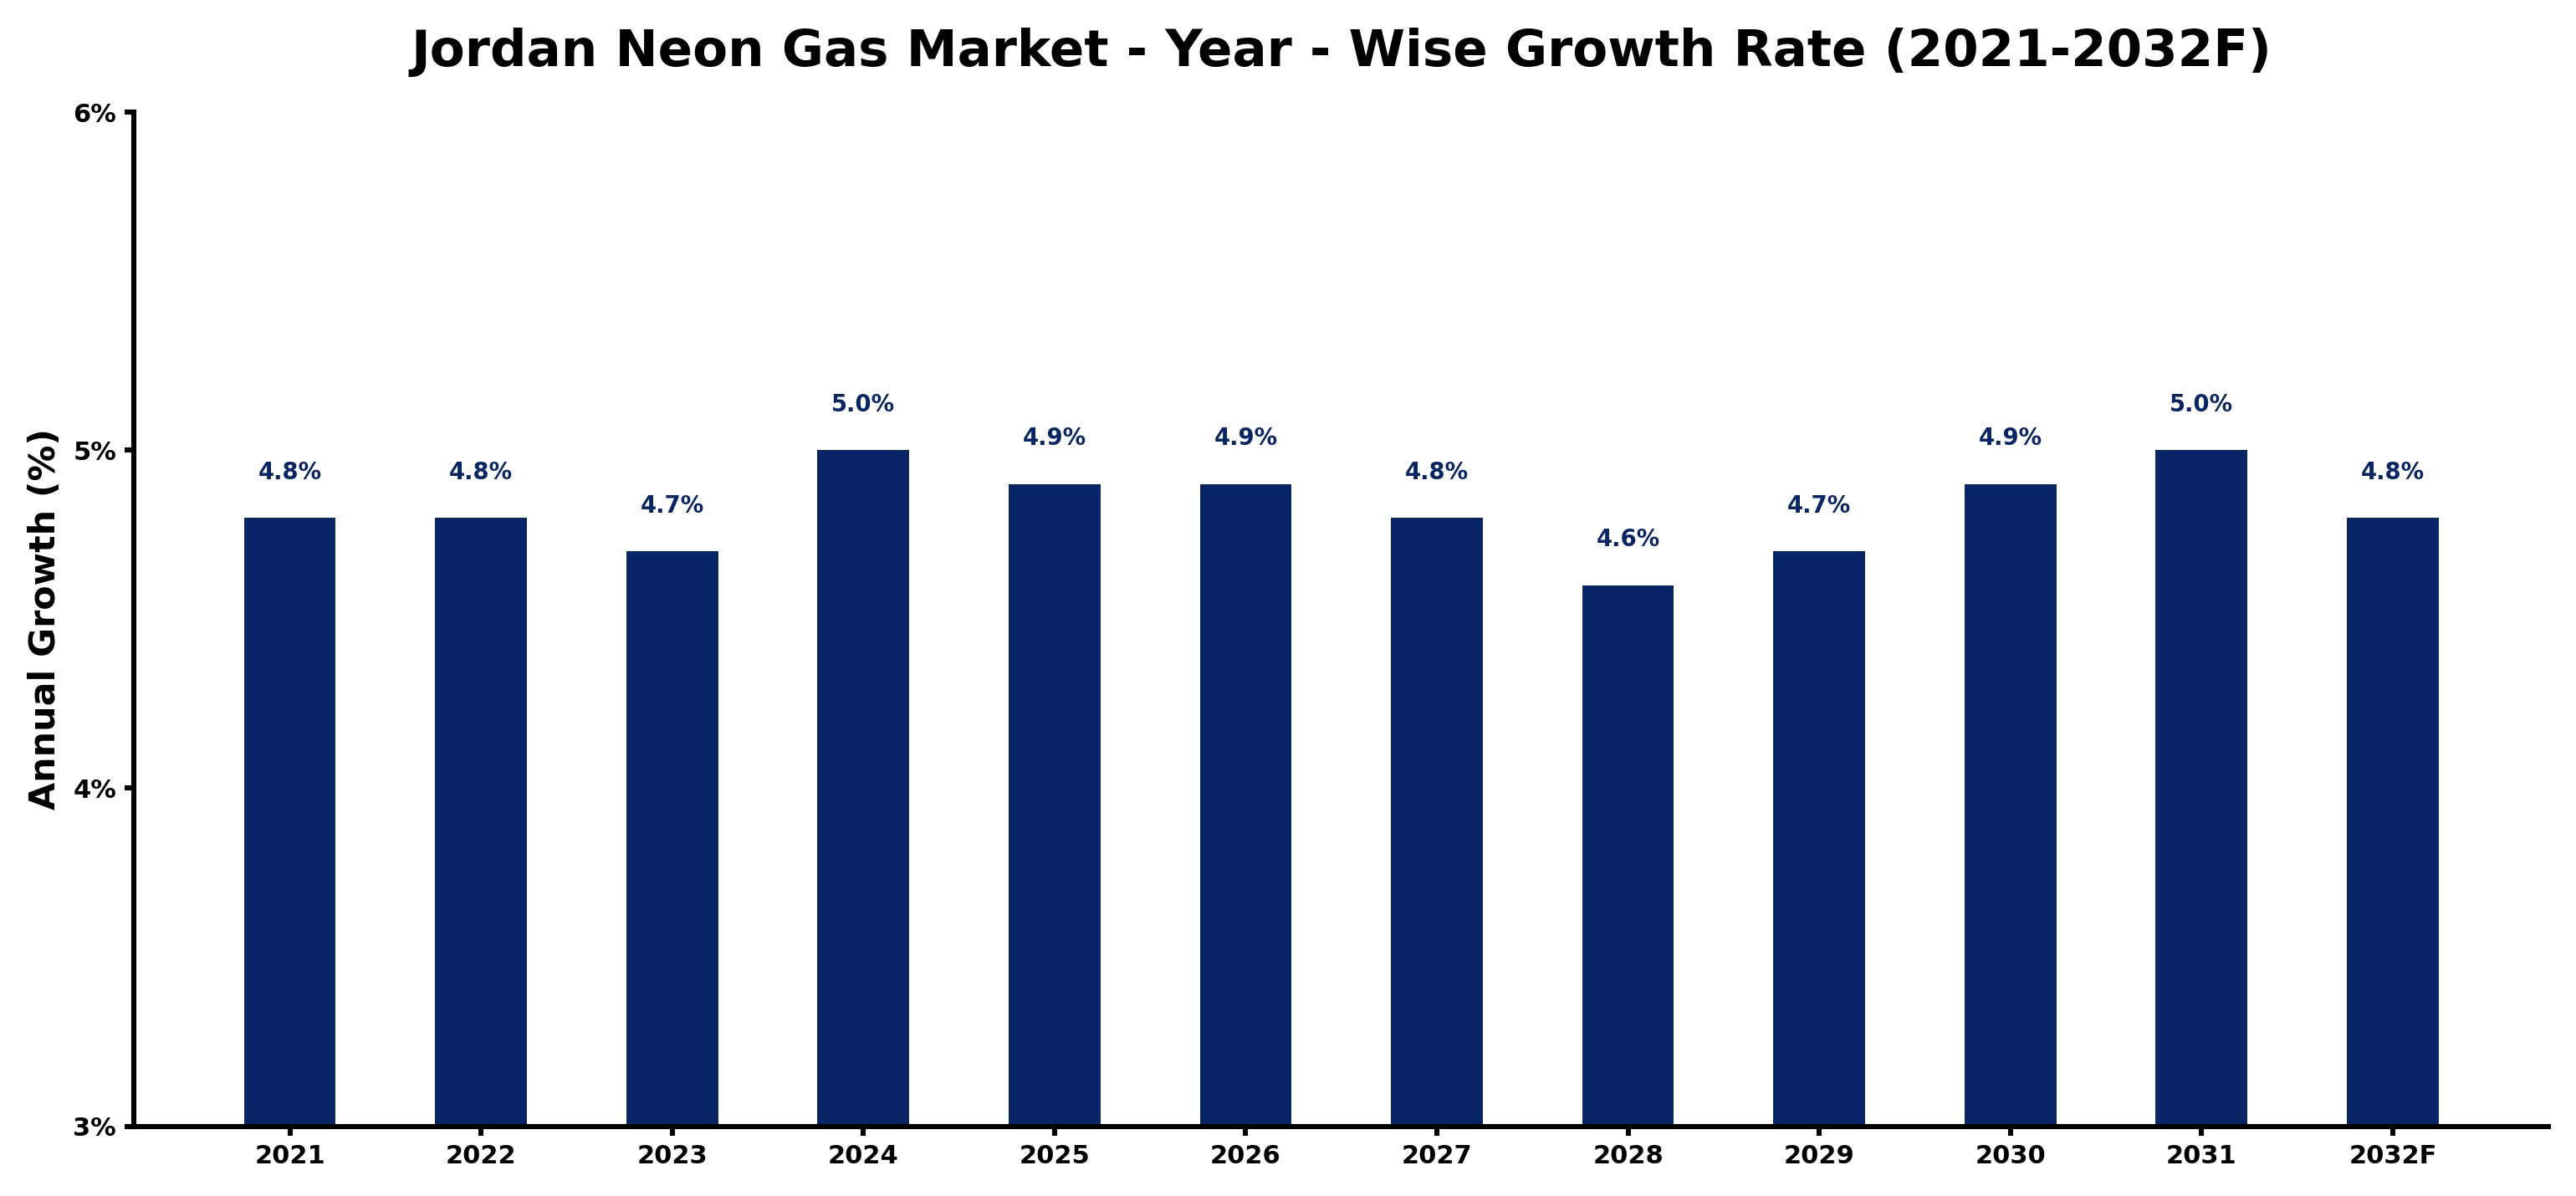
Jordan Neon Gas Market Growth Rate Analysis (2021-2032)
The Jordan neon gas market has experienced stable growth, with rates hovering around 4.7% to 5.0% from 2021 through 2032. In particular, 2021 and 2022 both recorded a solid growth of 4.8%, fueled by increased consumer demand in sectors like signage and lighting. The slight dip to 4.7% in 2023 can be attributed to supply chain disruptions, but a rebound to 5.0% is expected in 2024 as investments in infrastructure and technology improve production efficiency. Moving forward, growth is anticipated to stabilize around 4.8% to 4.9%, driven by ongoing energy transitions and enhanced digitalization in manufacturing processes, which will further bolster market resilience.
Jordan Neon Gas Market Year-wise Growth Rate and Key Drivers
This graph highlights how the Jordan Neon Gas Market has steadily grown over the past five years, supported by major growth factors.
The table below presents the year‑wise growth rates along with the key drivers influencing the market
| Year | Growth Rate | Major Drivers |
| 2021 | 4.8% | Regional construction projects boost demand for specialty gas applications |
| 2022 | 4.8% | Strengthened gas separation unit installations boosted neon production efficiency |
| 2023 | 4.7% | Neon gas recovery systems improved efficiency in glass manufacturing processes |
| 2024 | 5.0% | Improved supply chain logistics enhanced neon gas distribution efficiency |
| 2025 | 4.9% | Manufacturing investments in neon extraction technology boost local production capacity |
| 2026 | 4.9% | Domestic manufacturers invest in technology for neon gas extraction |
| 2027 | 4.8% | Export driven investments boost neon gas production capabilities in Jordan |
| 2028 | 4.6% | Local demand for neon gas supports increased manufacturing output |
| 2029 | 4.7% | Local semiconductor production surge boosts neon gas demand |
| 2030 | 4.9% | Advanced neon production techniques boost manufacturing efficiency in Jordan |
| 2031 | 5.0% | Strategic investments in gas pipeline infrastructure boost local supply reliability |
| 2032 | 4.8% | Infrastructure upgrades boosted neon gas production efficiency and output |
Note - Market size estimations and growth projections presented in this report are based on 6Wresearch’s advanced forecasting approach, validated with industry datasets as of June 2026.
Jordan Neon Gas Market Synopsis
The demand for neon gas in Jordan is significantly bolstered by its extensive application in neon signage and decorative lighting, which not only enhances aesthetic appeal but also provides energy-efficient solutions. The versatility of neon gas in healthcare for equipment calibration further establishes its critical role across various sectors.
Moreover, the electronics industry increasingly harnesses neon gas in the manufacturing of plasma display panels, reflecting a broader trend toward modernization and innovation. With ongoing technological advancements, the market is poised for sustainable growth, meeting diverse application needs.
Jordan Neon Gas Market Key Takeaways
- The Jordan Neon Gas Market is experiencing steady growth due to diverse industrial applications.
- Neon gas is integral to neon signage, healthcare calibration, and electronics manufacturing.
- Technological innovations and energy-efficient lighting are key market drivers.
- Investment opportunities exist in production facilities and innovative applications.
- Government regulations promote safety and sustainability within the market.
Evaluation of Restraints in Jordan Neon Gas Market
Despite the promising growth of the Jordan Neon Gas Market, several constraints could impede its expansion. The limited abundance of neon gas in the atmosphere results in higher production costs compared to alternative gases, which may deter potential entrants. Additionally, fluctuations in demand from sectors like signage and electronics can create instability in the market. Geopolitical tensions and trade regulations further complicate the importation processes, potentially affecting supply chains and pricing structures. Consequently, market participants must navigate these challenges to sustain competitive advantages and adapt to evolving dynamics.
Jordan Neon Gas Market Trends
The landscape of the Jordan Neon Gas Market is characterized by notable trends that are reshaping demand. One key trend is the growing adoption of neon gas in medical applications, particularly in advanced procedures like cryosurgery. Additionally, a marked interest in eco-friendly lighting solutions has emerged, spurring innovation within the industry. The automotive sector is also recognizing the utility of neon gas in airbag deployment systems, thereby diversifying its applications. These trends indicate a transformative phase where neon gas is not only a conventional choice but increasingly viewed through the lens of modern technological requirements.
Jordan Neon Gas Market Opportunities
The Jordan Neon Gas Market presents lucrative investment opportunities, particularly in the production and distribution sectors. As industries continue to embrace neon gas for its diverse applications, establishing production facilities could yield significant returns. Moreover, investing in research and development to explore new applications for neon gas stands to enhance market appeal. Collaborations with research institutions or tech companies may also drive innovations, leading to competitive advantages and increased market share. These avenues highlight the potential for growth in a niche yet expanding market.
Government Initiatives in the Jordan Neon Gas Market
The Jordanian government plays a crucial role in regulating the Neon Gas Market, implementing policies that ensure safety, quality, and fair competition. Licensing requirements are strictly enforced for companies involved in neon gas production and distribution, promoting adherence to environmental and safety standards. Moreover, the government actively monitors market pricing to discourage monopolistic practices and encourage healthy competition. Initiatives aimed at fostering research and development within neon gas technology reflect the government's commitment to sustainability and innovation in this burgeoning sector.
Future Insights of the Jordan Neon Gas Market
Looking ahead to the period from 2026 to 2032, the Jordan Neon Gas Market is expected to maintain its positive growth trajectory. With the healthcare sector poised for significant advancements in medical imaging and equipment applications, the demand for neon gas will likely intensify. Additionally, as the electronics sector continues to evolve, fueled by innovations in display technologies, neon gas will remain an essential component. Strategic collaborations, technological advancements, and an expanded scope of applications will collectively underpin market growth and ensure that neon gas plays a pivotal role in Jordan's industrial landscape.
Jordan Neon Gas Market Latest Developments (May 2025 - June 2026)
In the past year, the Jordan Neon Gas Market has seen various advancements aimed at enhancing production efficiency and application diversity. The industry has witnessed a rise in collaborations between manufacturers and technology developers focused on optimizing the use of neon gas in various sectors. Concurrently, there has been an uptick in public awareness regarding the benefits of neon lighting, further promoting its adoption across urban settings. As market players adjust to changing consumer preferences, innovative strategies are being deployed to ensure that neon gas remains a relevant and sought-after resource.
Jordan Neon Gas Market - Key Attractiveness of the Report
- 10 Years of Market Numbers
- Historical Data Starting from 2022 to 2025
- Base Year: 2025
- Forecast Data until 2032
- Key Performance Indicators Impacting the Market
- Major Upcoming Developments and Projects
Key Highlights of the Report:
- Jordan Neon Gas Market Outlook
- Market Size of Jordan Neon Gas Market, 2025
- Forecast of Jordan Neon Gas Market, 2032
- Historical Data and Forecast of Jordan Neon Gas Revenues & Volume for the Period 2022-2032F
- Jordan Neon Gas Market Trend Evolution
- Jordan Neon Gas Market Drivers and Challenges
- Jordan Neon Gas Price Trends
- Jordan Neon Gas Porter's Five Forces
- Jordan Neon Gas Industry Life Cycle
- Historical Data and Forecast of Jordan Neon Gas Market Revenues & Volume By Type for the Period 2022-2032F
- Historical Data and Forecast of Jordan Neon Gas Market Revenues & Volume By Low for the Period 2022-2032F
- Historical Data and Forecast of Jordan Neon Gas Market Revenues & Volume By High for the Period 2022-2032F
- Historical Data and Forecast of Jordan Neon Gas Market Revenues & Volume By Ultra High for the Period 2022-2032F
- Historical Data and Forecast of Jordan Neon Gas Market Revenues & Volume By Application for the Period 2022-2032F
- Historical Data and Forecast of Jordan Neon Gas Market Revenues & Volume By Semiconductor for the Period 2022-2032F
- Historical Data and Forecast of Jordan Neon Gas Market Revenues & Volume By LCD for the Period 2022-2032F
- Historical Data and Forecast of Jordan Neon Gas Market Revenues & Volume By Imaging and Lighting for the Period 2022-2032F
- Historical Data and Forecast of Jordan Neon Gas Market Revenues & Volume By Refrigerator for the Period 2022-2032F
- Historical Data and Forecast of Jordan Neon Gas Market Revenues & Volume By Laser for the Period 2022-2032F
- Historical Data and Forecast of Jordan Neon Gas Market Revenues & Volume By Medical for the Period 2022-2032F
- Historical Data and Forecast of Jordan Neon Gas Market Revenues & Volume By Others for the Period 2022-2032F
- Jordan Neon Gas Import Export Trade Statistics
- Market Opportunity Assessment By Type
- Market Opportunity Assessment By Application
- Jordan Neon Gas Top Companies Market Share
- Jordan Neon Gas Competitive Benchmarking By Technical and Operational Parameters
- Jordan Neon Gas Company Profiles
- Jordan Neon Gas Key Strategic Recommendations
Jordan Neon Gas Market - Frequently Asked Questions
The market is projected to grow from USD 220 Million in 2025 to USD 291 Million by 2032, reflecting a CAGR of 4.1% from 2026 to 2032, driven by demand across various sectors.
Neon gas plays a crucial role in calibrating medical equipment and is increasingly utilized in applications such as cryosurgery and imaging, enhancing healthcare outcomes.
Neon gas is essential in the manufacturing of plasma display panels and semiconductor production, supporting technological advancements in the electronics sector.
The vibrant aesthetic appeal, coupled with the energy efficiency of neon lighting, has resulted in increased adoption in advertising, urban signage, and decorative applications.
Yes, the limited natural abundance of neon gas, higher production costs, and geopolitical factors impacting imports can restrict supply and affect pricing stability in the market.
6Wresearch actively monitors the Jordan Neon Gas Market and publishes its comprehensive annual report, highlighting emerging trends, growth drivers, revenue analysis, and forecast outlook. Our insights help businesses to make data-backed strategic decisions with ongoing market dynamics. Our analysts track relevent industries related to the Jordan Neon Gas Market, allowing our clients with actionable intelligence and reliable forecasts tailored to emerging regional needs.
Yes, we provide customisation as per your requirements. To learn more, feel free to contact us on sales@6wresearch.com
1 Executive Summary |
2 Introduction |
2.1 Key Highlights of the Report |
2.2 Report Description |
2.3 Market Scope & Segmentation |
2.4 Research Methodology |
2.5 Assumptions |
3 Jordan Neon Gas Market Overview |
3.1 Jordan Country Macro Economic Indicators |
3.2 Jordan Neon Gas Market Revenues & Volume, 2022 & 2032F |
3.3 Jordan Neon Gas Market - Industry Life Cycle |
3.4 Jordan Neon Gas Market - Porter's Five Forces |
3.5 Jordan Neon Gas Market Revenues & Volume Share, By Type, 2022 & 2032F |
3.6 Jordan Neon Gas Market Revenues & Volume Share, By Form, 2022 & 2032F |
4 Jordan Neon Gas Market Dynamics |
4.1 Impact Analysis |
4.2 Market Drivers |
4.3 Market Restraints |
5 Jordan Neon Gas Market Trends |
6 Jordan Neon Gas Market, By Types |
6.1 Jordan Neon Gas Market, By Type |
6.1.1 Overview and Analysis |
6.1.2 Jordan Neon Gas Market Revenues & Volume, By Type, 2022-2032F |
6.1.3 Jordan Neon Gas Market Revenues & Volume, By Low, 2022-2032F |
6.1.4 Jordan Neon Gas Market Revenues & Volume, By High, 2022-2032F |
6.1.5 Jordan Neon Gas Market Revenues & Volume, By Ultra High, 2022-2032F |
6.2 Jordan Neon Gas Market, By Application |
6.2.1 Overview and Analysis |
6.2.2 Jordan Neon Gas Market Revenues & Volume, By Semiconductor, 2022-2032F |
6.2.3 Jordan Neon Gas Market Revenues & Volume, By LCD, 2022-2032F |
6.2.4 Jordan Neon Gas Market Revenues & Volume, By Imaging and Lighting, 2022-2032F |
6.2.5 Jordan Neon Gas Market Revenues & Volume, By Refrigerator, 2022-2032F |
6.2.6 Jordan Neon Gas Market Revenues & Volume, By Laser, 2022-2032F |
6.2.7 Jordan Neon Gas Market Revenues & Volume, By Medical, 2022-2032F |
7 Jordan Neon Gas Market Import-Export Trade Statistics |
7.1 Jordan Neon Gas Market Export to Major Countries |
7.2 Jordan Neon Gas Market Imports from Major Countries |
8 Jordan Neon Gas Market Key Performance Indicators |
9 Jordan Neon Gas Market - Opportunity Assessment |
9.1 Jordan Neon Gas Market Opportunity Assessment, By Type, 2022 & 2032F |
9.2 Jordan Neon Gas Market Opportunity Assessment, By Application, 2022 & 2032F |
10 Jordan Neon Gas Market - Competitive Landscape |
10.1 Jordan Neon Gas Market Revenue Share, By Companies, 2025 |
10.2 Jordan Neon Gas Market Competitive Benchmarking, By Operating and Technical Parameters |
11 Company Profiles |
12 Recommendations |
13 Disclaimer |
Global Go To Market Strategy - 2030
Export potential enables firms to identify high-growth global markets with greater confidence by combining advanced trade intelligence with a structured quantitative methodology. The framework analyzes emerging demand trends and country-level import patterns while integrating macroeconomic and trade datasets such as GDP and population forecasts, bilateral import–export flows, tariff structures, elasticity differentials between developed and developing economies, geographic distance, and import demand projections. Using weighted trade values from 2020–2024 as the base period to project country-to-country export potential for 2030, these inputs are operationalized through calculated drivers such as gravity model parameters, tariff impact factors, and projected GDP per-capita growth. Through an analysis of hidden potentials, demand hotspots, and market conditions that are most favorable to success, this method enables firms to focus on target countries, maximize returns, and global expansion with data, backed by accuracy.
By factoring in the projected importer demand gap that is currently unmet and could be potential opportunity, it identifies the potential for the Exporter (Country) among 190 countries, against the general trade analysis, which identifies the biggest importer or exporter.
To discover high-growth global markets and optimize your business strategy:
Click Here
Pricing
- Single User License$ 1,995
- Department License$ 2,400
- Site License$ 3,120
- Global License$ 3,795

Leadership Perspectives from Industry Events
Search
Thought Leadership and Analyst Meet


Our Clients
6WResearch In News
- India Air Conditioner Market Set for Strong Rebound in 2026 After Weather-Led Correction and GST-Driven Recovery: 6Wresearch
- ADAS in India: How Automatic Emergency Braking, Blind Spot Detection & Driver Monitoring are Transforming Road Safety
- Doha a strategic location for EV manufacturing hub: IPA Qatar
- Demand for luxury TVs surging in the GCC, says Samsung
- Empowering Growth: The Thriving Journey of Bangladesh’s Cable Industry
- Demand for luxury TVs surging in the GCC, says Samsung
Latest Reports
- Nicaragua RPG Gaming Market (2026-2032)
- New Zealand RPG Gaming Market (2026-2032)
- Netherlands RPG Gaming Market (2026-2032)
- Nauru RPG Gaming Market (2026-2032)
- Namibia RPG Gaming Market (2026-2032)
- Mozambique RPG Gaming Market (2026-2032)
- Montenegro RPG Gaming Market (2026-2032)
- Mongolia RPG Gaming Market (2026-2032)
- Monaco RPG Gaming Market (2026-2032)
- Micronesia RPG Gaming Market (2026-2032)
Industry Events and Analyst Meet

HIMTEX 2026

India Refining Summit 2026

India EV Show 2026

EV tech India Expo 2026

Auto Tech Asia 2026
Whitepaper
- Middle East & Africa Commercial Security Market Click here to view more.
- Middle East & Africa Fire Safety Systems & Equipment Market Click here to view more.
- GCC Drone Market Click here to view more.
- Middle East Lighting Fixture Market Click here to view more.
- GCC Physical & Perimeter Security Market Click here to view more.