Bahrain Non-Metallic Mineral Deposit Market (2026-2032) | Forecast, Growth, Analysis, Size, Outlook, Industry, Revenue, Companies, Share, Value & Trends
Market Forecast By Form Types (Powder Form, Liquid Form), By Applications (Construction, Jewellery, Iron & Ore) And Competitive Landscape
| Product Code: ETC008824 | Publication Date: Oct 2020 | Updated Date: Jun 2026 | Product Type: Report | |
| Publisher: 6Wresearch | Author: Ravi Bhandari | No. of Pages: 70 | No. of Figures: 35 | No. of Tables: 5 |
Bahrain Non-Metallic Mineral Deposit Market Summary
The bahrain non-metallic mineral deposit market was estimated at USD 1092 Million in 2025 and is projected to reach USD 1998 Million by 2032, growing at a CAGR of 10.4% from 2026 to 2032.
Bahrain Non-Metallic Mineral Deposit Market Year-wise Growth Rate and Key Drivers
This graph highlights how the Bahrain Non-Metallic Mineral Deposit Market has steadily grown over the past five years, supported by major growth factors.
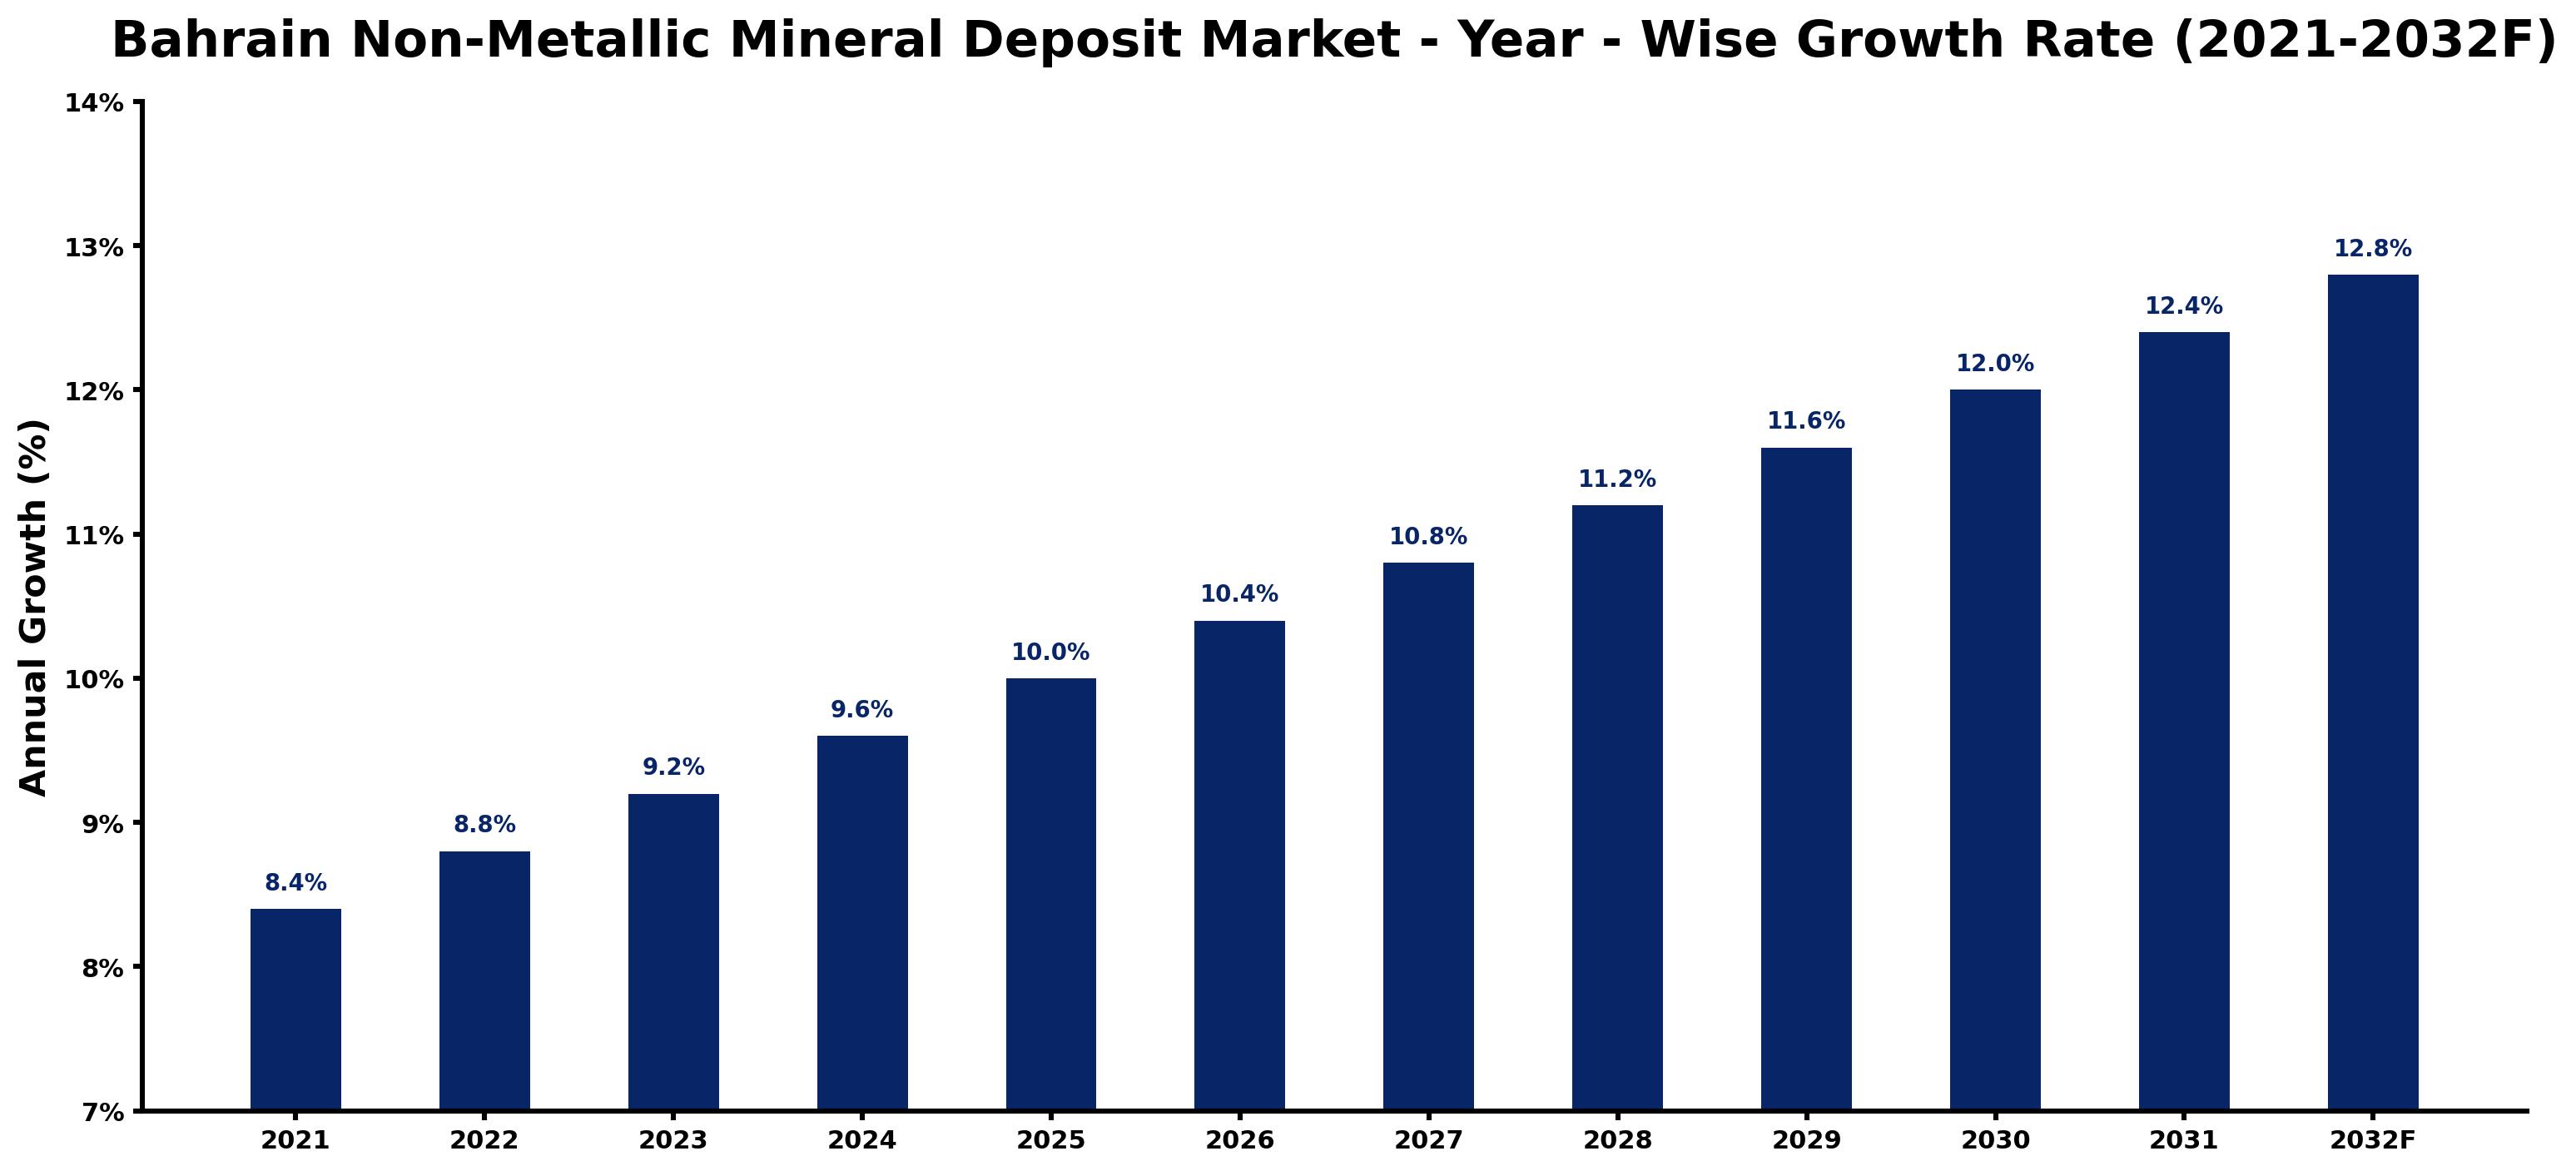
The table below presents the year wise growth rates along with the key drivers influencing the market
| Year | Growth Rate | Major Drivers |
| 2021 | 8.4% | Post-pandemic infrastructure projects in Bahrain highlighted a need for reliable non-metallic minerals. |
| 2022 | 8.8% | Intensified construction activities saw a significant uptick in local sourcing demands. |
| 2023 | 9.2% | Renewable energy projects increased reliance on non-metallic minerals for solar panel production. |
| 2024 | 9.6% | Local manufacturers began prioritizing sustainable materials amid rising environmental consciousness. |
| 2025 | 10.0% | Bahrain's strategic location attracted foreign investment, enhancing the mineral supply chain. |
| 2026 | 10.4% | New construction regulations favored the utilization of locally sourced non-metallic materials. |
| 2027 | 10.8% | Technological advancements in extraction processes led to lower operational costs and improved efficiency. |
| 2028 | 11.2% | Regional trade agreements expanded Bahrain's market reach, driving mineral export opportunities. |
| 2029 | 11.6% | Real estate developments created a consistent demand for non-metallic minerals in construction. |
| 2030 | 12.0% | Urbanization trends in Bahrain resulted in an escalating need for quality building materials. |
| 2031 | 12.4% | Innovative recycling methods gained traction, optimizing the use of existing mineral deposits. |
| 2032 | 12.8% | A shift toward sustainable infrastructure projects underscored the value of non-metallic minerals. |
Note - Market size estimations and growth projections presented in this report are based on 6Wresearch's advanced forecasting approach, validated with industry datasets as of June 2026.
Bahrain Non-Metallic Mineral Deposit Market Synopsis
The Bahrain Non-Metallic Mineral Deposit Market is projected to reach 10.4% and witness significant growth during the forecast period (2026-2032). This market encompasses essential minerals such as limestone, gypsum, and silica, which are vital for various industries including construction, ceramics, and industrial minerals. With the continuous urban development and construction activities across Bahrain, the demand for these non-metallic minerals is expected to rise.
Bahrain Non-Metallic Mineral Deposit Market Growth Drivers
The primary catalysts for growth in the Bahrain Non-Metallic Mineral Deposit Market are multifaceted and closely linked to various sectors of the economy:
- The construction industry is a major driver, as the demand for materials such as gypsum and limestone remains robust due to ongoing real estate and infrastructure projects.
- Urbanization initiatives within the Kingdom propel the requirement for non-metallic minerals, which are integral in cement production and various building materials.
- Government support for the mining sector fosters an enabling environment for domestic producers, thus facilitating market expansion.
- Technological advancements in mineral processing enhance extraction efficiency, minimizing costs and increasing profitability for operators in the market.
- Sustainable practices within the mining industry are gaining traction, attracting investment and improving the overall environmental footprint of mineral extraction.
Bahrain Non-Metallic Mineral Deposit Market Challenges and Restraints
Despite the potential for growth, the Bahrain Non-Metallic Mineral Deposit Market faces several challenges that could impede its progress:
- The depletion of high-quality mineral deposits poses significant challenges, as extraction becomes increasingly expensive and logistically complex.
- Environmental regulations are stringent, requiring compliance with sustainable mining practices that necessitate investment in advanced technologies.
- Land use restrictions complicate mining operations, often limiting the availability of extraction sites and increasing operational costs.
- Increasing competition from imported non-metallic minerals, frequently available at lower prices, places price pressure on local producers, thus impacting their competitiveness.
- The market must navigate fluctuating global commodity prices, which can affect profitability and make long-term planning more difficult.
Bahrain Non-Metallic Mineral Deposit Market Investment Opportunities
Investment opportunities within the Bahrain Non-Metallic Mineral Deposit Market are emerging across several sectors:
- As the construction industry continues its expansion, there are promising ventures in limestone and gypsum mining to meet local demand.
- Exploration of silica deposits presents opportunities for manufacturers in glass production and other industrial applications.
- Investments in value-added processing facilities for non-metallic minerals can enhance local supply chains, reducing reliance on imports.
- Developing partnerships with construction firms can provide mutual benefits, ensuring a steady demand for locally sourced minerals.
- With increased government spending on infrastructure, stakeholders can align strategic investments to leverage this momentum effectively.
Bahrain Non-Metallic Mineral Deposit Market Government Investment and Initiatives
The government of Bahrain plays a crucial role in supporting the non-metallic mineral deposit market through various policies and initiatives:
- Public spending on infrastructure projects such as roads, bridges, and residential complexes significantly boosts demand for non-metallic minerals.
- Government incentives for sustainable mining practices encourage companies to adopt eco-friendly technologies, thus aligning with global sustainability trends.
- Regulatory frameworks are designed to promote responsible resource management, balancing economic growth with environmental preservation.
- Investment in infrastructure improvements aids mining operations by enhancing transportation networks, thereby reducing logistical costs.
- Collaboration between public and private sectors is encouraged, fostering innovation and competitive practices within the market.
Bahrain Non-Metallic Mineral Deposit Market Latest Developments (May 2025 - June 2026)
Recent developments in the Bahrain Non-Metallic Mineral Deposit Market reflect shifting industry dynamics and evolving market conditions:
- Legislative changes aimed at simplifying mining regulations have been proposed to enhance the ease of doing business in the mineral extraction sector.
- Initiatives focusing on exploring new mineral deposits have gained traction, with governmental bodies promoting geological surveys to identify untapped resources.
- Collaboration between mining companies and research institutions has increased, driving innovations in extraction and processing technologies.
- Increased transparency in licensing processes has led to a more attractive investment climate for both domestic and international stakeholders.
- Community engagement initiatives are being implemented to address environmental concerns and ensure that local communities benefit from mining activities.
Bahrain Non-Metallic Mineral Deposit Market - Key Attractiveness of the Report
- 10 Years of Market Numbers
- Historical Data Starting from 2022 to 2025
- Base Year: 2025
- Forecast Data until 2032
- Key Performance Indicators Impacting the Market
- Major Upcoming Developments and Projects
Key Highlights of the Report:
- Bahrain Non-Metallic Mineral Deposit Market Outlook
- Market Size of Bahrain Non-Metallic Mineral Deposit Market, 2025
- Forecast of Bahrain Non-Metallic Mineral Deposit Market, 2032F
- Historical Data and Forecast of Bahrain Non-Metallic Mineral Deposit Revenues & Volume for the Period 2022-2032F
- Bahrain Non-Metallic Mineral Deposit Market Trend Evolution
- Bahrain Non-Metallic Mineral Deposit Market Drivers and Challenges
- Bahrain Non-Metallic Mineral Deposit Price Trends
- Bahrain Non-Metallic Mineral Deposit Porter's Five Forces
- Bahrain Non-Metallic Mineral Deposit Industry Life Cycle
- Historical Data and Forecast of Bahrain Non-Metallic Mineral Deposit Market Revenues & Volume By Form Types for the Period 2022-2032F
- Historical Data and Forecast of Bahrain Non-Metallic Mineral Deposit Market Revenues & Volume By Powder Form for the Period 2022-2032F
- Historical Data and Forecast of Bahrain Non-Metallic Mineral Deposit Market Revenues & Volume By Liquid Form for the Period 2022-2032F
- Historical Data and Forecast of Bahrain Non-Metallic Mineral Deposit Market Revenues & Volume By Applications for the Period 2022-2032F
- Historical Data and Forecast of Bahrain Non-Metallic Mineral Deposit Market Revenues & Volume By Construction for the Period 2022-2032F
- Historical Data and Forecast of Bahrain Non-Metallic Mineral Deposit Market Revenues & Volume By Jewellery for the Period 2022-2032F
- Historical Data and Forecast of Bahrain Non-Metallic Mineral Deposit Market Revenues & Volume By Iron & Ore for the Period 2022-2032F
- Bahrain Non-Metallic Mineral Deposit Import Export Trade Statistics
- Market Opportunity Assessment By Form Types
- Market Opportunity Assessment By Applications
- Bahrain Non-Metallic Mineral Deposit Top Companies Market Share
- Bahrain Non-Metallic Mineral Deposit Competitive Benchmarking By Technical and Operational Parameters
- Bahrain Non-Metallic Mineral Deposit Company Profiles
- Bahrain Non-Metallic Mineral Deposit Key Strategic Recommendations
Frequently Asked Questions About the Market Study (FAQs):
The primary minerals include limestone, gypsum, and silica, which are essential for construction and industrial applications.
Government policies fostering infrastructure development and sustainable mining practices significantly influence market growth and operational framework.
Challenges include the depletion of high-quality deposits, environmental regulations, and competition from imported minerals, which impact local producers.
Investment opportunities are found in mining, processing, and supply chain enhancements, particularly in response to the construction sector's growth.
6Wresearch actively monitors the Bahrain Non-Metallic Mineral Deposit Market and publishes its comprehensive annual report, highlighting emerging trends, growth drivers, revenue analysis, and forecast outlook. Our insights help businesses to make data-backed strategic decisions with ongoing market dynamics. Our analysts track relevent industries related to the Bahrain Non-Metallic Mineral Deposit Market, allowing our clients with actionable intelligence and reliable forecasts tailored to emerging regional needs.
Yes, we provide customisation as per your requirements. To learn more, feel free to contact us on sales@6wresearch.com
1 Executive Summary |
2 Introduction |
2.1 Key Highlights of the Report |
2.2 Report Description |
2.3 Market Scope & Segmentation |
2.4 Research Methodology |
2.5 Assumptions |
3 Bahrain Non-Metallic Mineral Deposit Market Overview |
3.1 Bahrain Country Macro Economic Indicators |
3.2 Bahrain Non-Metallic Mineral Deposit Market Revenues & Volume, 2022 & 2032F |
3.3 Bahrain Non-Metallic Mineral Deposit Market - Industry Life Cycle |
3.4 Bahrain Non-Metallic Mineral Deposit Market - Porter's Five Forces |
3.5 Bahrain Non-Metallic Mineral Deposit Market Revenues & Volume Share, By Form Types, 2022 & 2032F |
3.6 Bahrain Non-Metallic Mineral Deposit Market Revenues & Volume Share, By Applications, 2022 & 2032F |
4 Bahrain Non-Metallic Mineral Deposit Market Dynamics |
4.1 Impact Analysis |
4.2 Market Drivers |
4.2.1 Increasing construction activities in Bahrain |
4.2.2 Growing demand for industrial minerals in various sectors |
4.2.3 Government initiatives to promote mining and mineral exploration in the country |
4.3 Market Restraints |
4.3.1 Environmental regulations impacting mining operations |
4.3.2 Limited availability of skilled labor in the mining industry |
4.3.3 Fluctuating global prices of non-metallic minerals |
5 Bahrain Non-Metallic Mineral Deposit Market Trends |
6 Bahrain Non-Metallic Mineral Deposit Market, By Types |
6.1 Bahrain Non-Metallic Mineral Deposit Market, By Form Types |
6.1.1 Overview and Analysis |
6.1.2 Bahrain Non-Metallic Mineral Deposit Market Revenues & Volume, By Form Types, 2022-2032F |
6.1.3 Bahrain Non-Metallic Mineral Deposit Market Revenues & Volume, By Powder Form, 2022-2032F |
6.1.4 Bahrain Non-Metallic Mineral Deposit Market Revenues & Volume, By Liquid Form, 2022-2032F |
6.2 Bahrain Non-Metallic Mineral Deposit Market, By Applications |
6.2.1 Overview and Analysis |
6.2.2 Bahrain Non-Metallic Mineral Deposit Market Revenues & Volume, By Construction, 2022-2032F |
6.2.3 Bahrain Non-Metallic Mineral Deposit Market Revenues & Volume, By Jewellery, 2022-2032F |
6.2.4 Bahrain Non-Metallic Mineral Deposit Market Revenues & Volume, By Iron & Ore, 2022-2032F |
7 Bahrain Non-Metallic Mineral Deposit Market Import-Export Trade Statistics |
7.1 Bahrain Non-Metallic Mineral Deposit Market Export to Major Countries |
7.2 Bahrain Non-Metallic Mineral Deposit Market Imports from Major Countries |
8 Bahrain Non-Metallic Mineral Deposit Market Key Performance Indicators |
8.1 Exploration drilling success rate |
8.2 Average mineral recovery rate |
8.3 Investment in mining technology and innovation |
8.4 Environmental compliance and sustainability practices |
8.5 Market demand for non-metallic minerals |
9 Bahrain Non-Metallic Mineral Deposit Market - Opportunity Assessment |
9.1 Bahrain Non-Metallic Mineral Deposit Market Opportunity Assessment, By Form Types, 2022 & 2032F |
9.2 Bahrain Non-Metallic Mineral Deposit Market Opportunity Assessment, By Applications, 2022 & 2032F |
10 Bahrain Non-Metallic Mineral Deposit Market - Competitive Landscape |
10.1 Bahrain Non-Metallic Mineral Deposit Market Revenue Share, By Companies, 2025 |
10.2 Bahrain Non-Metallic Mineral Deposit Market Competitive Benchmarking, By Operating and Technical Parameters |
11 Company Profiles |
12 Recommendations |
13 Disclaimer |
Global Go To Market Strategy - 2030
Export potential enables firms to identify high-growth global markets with greater confidence by combining advanced trade intelligence with a structured quantitative methodology. The framework analyzes emerging demand trends and country-level import patterns while integrating macroeconomic and trade datasets such as GDP and population forecasts, bilateral import–export flows, tariff structures, elasticity differentials between developed and developing economies, geographic distance, and import demand projections. Using weighted trade values from 2020–2024 as the base period to project country-to-country export potential for 2030, these inputs are operationalized through calculated drivers such as gravity model parameters, tariff impact factors, and projected GDP per-capita growth. Through an analysis of hidden potentials, demand hotspots, and market conditions that are most favorable to success, this method enables firms to focus on target countries, maximize returns, and global expansion with data, backed by accuracy.
By factoring in the projected importer demand gap that is currently unmet and could be potential opportunity, it identifies the potential for the Exporter (Country) among 190 countries, against the general trade analysis, which identifies the biggest importer or exporter.
To discover high-growth global markets and optimize your business strategy:
Click Here
Pricing
- Single User License$ 1,995
- Department License$ 2,400
- Site License$ 3,120
- Global License$ 3,795

Leadership Perspectives from Industry Events
Search
Thought Leadership and Analyst Meet


Our Clients
6WResearch In News
- India Air Conditioner Market Set for Strong Rebound in 2026 After Weather-Led Correction and GST-Driven Recovery: 6Wresearch
- ADAS in India: How Automatic Emergency Braking, Blind Spot Detection & Driver Monitoring are Transforming Road Safety
- Doha a strategic location for EV manufacturing hub: IPA Qatar
- Demand for luxury TVs surging in the GCC, says Samsung
- Empowering Growth: The Thriving Journey of Bangladesh’s Cable Industry
- Demand for luxury TVs surging in the GCC, says Samsung
Latest Reports
- Nicaragua RPG Gaming Market (2026-2032)
- New Zealand RPG Gaming Market (2026-2032)
- Netherlands RPG Gaming Market (2026-2032)
- Nauru RPG Gaming Market (2026-2032)
- Namibia RPG Gaming Market (2026-2032)
- Mozambique RPG Gaming Market (2026-2032)
- Montenegro RPG Gaming Market (2026-2032)
- Mongolia RPG Gaming Market (2026-2032)
- Monaco RPG Gaming Market (2026-2032)
- Micronesia RPG Gaming Market (2026-2032)
Industry Events and Analyst Meet

EV India Expo 2026

HIMTEX 2026

India Refining Summit 2026

India EV Show 2026

EV tech India Expo 2026
Whitepaper
- Middle East & Africa Commercial Security Market Click here to view more.
- Middle East & Africa Fire Safety Systems & Equipment Market Click here to view more.
- GCC Drone Market Click here to view more.
- Middle East Lighting Fixture Market Click here to view more.
- GCC Physical & Perimeter Security Market Click here to view more.