Belgium Buildings Construction Market (2026-2032) | Demand, Segmentation, Share, Outlook, Value, Trends, Competition, Analysis, Strategic Insights, Drivers, Revenue, Industry, Consumer Insights, Size, Challenges, Supply, Investment Trends, Growth, Pricing Analysis, Restraints, Companies, Segments, Opportunities, Forecast, Strategy, Competitive
Market Forecast By Construction Type (Residential Buildings, Commercial Buildings, Industrial Facilities, Public Infrastructure, Smart Buildings), By Material Used (Concrete, Steel, Wood, Glass, Aluminum, Composites, Brick), By End User (Homeowners, Real Estate Developers, Manufacturing Plants, Government Agencies, Tech Companies) And Competitive Landscape
| Product Code: ETC12057538 | Publication Date: Apr 2025 | Updated Date: Apr 2026 | Product Type: Market Research Report | |
| Publisher: 6Wresearch | Author: Sachin Kumar Rai | No. of Pages: 65 | No. of Figures: 34 | No. of Tables: 19 |
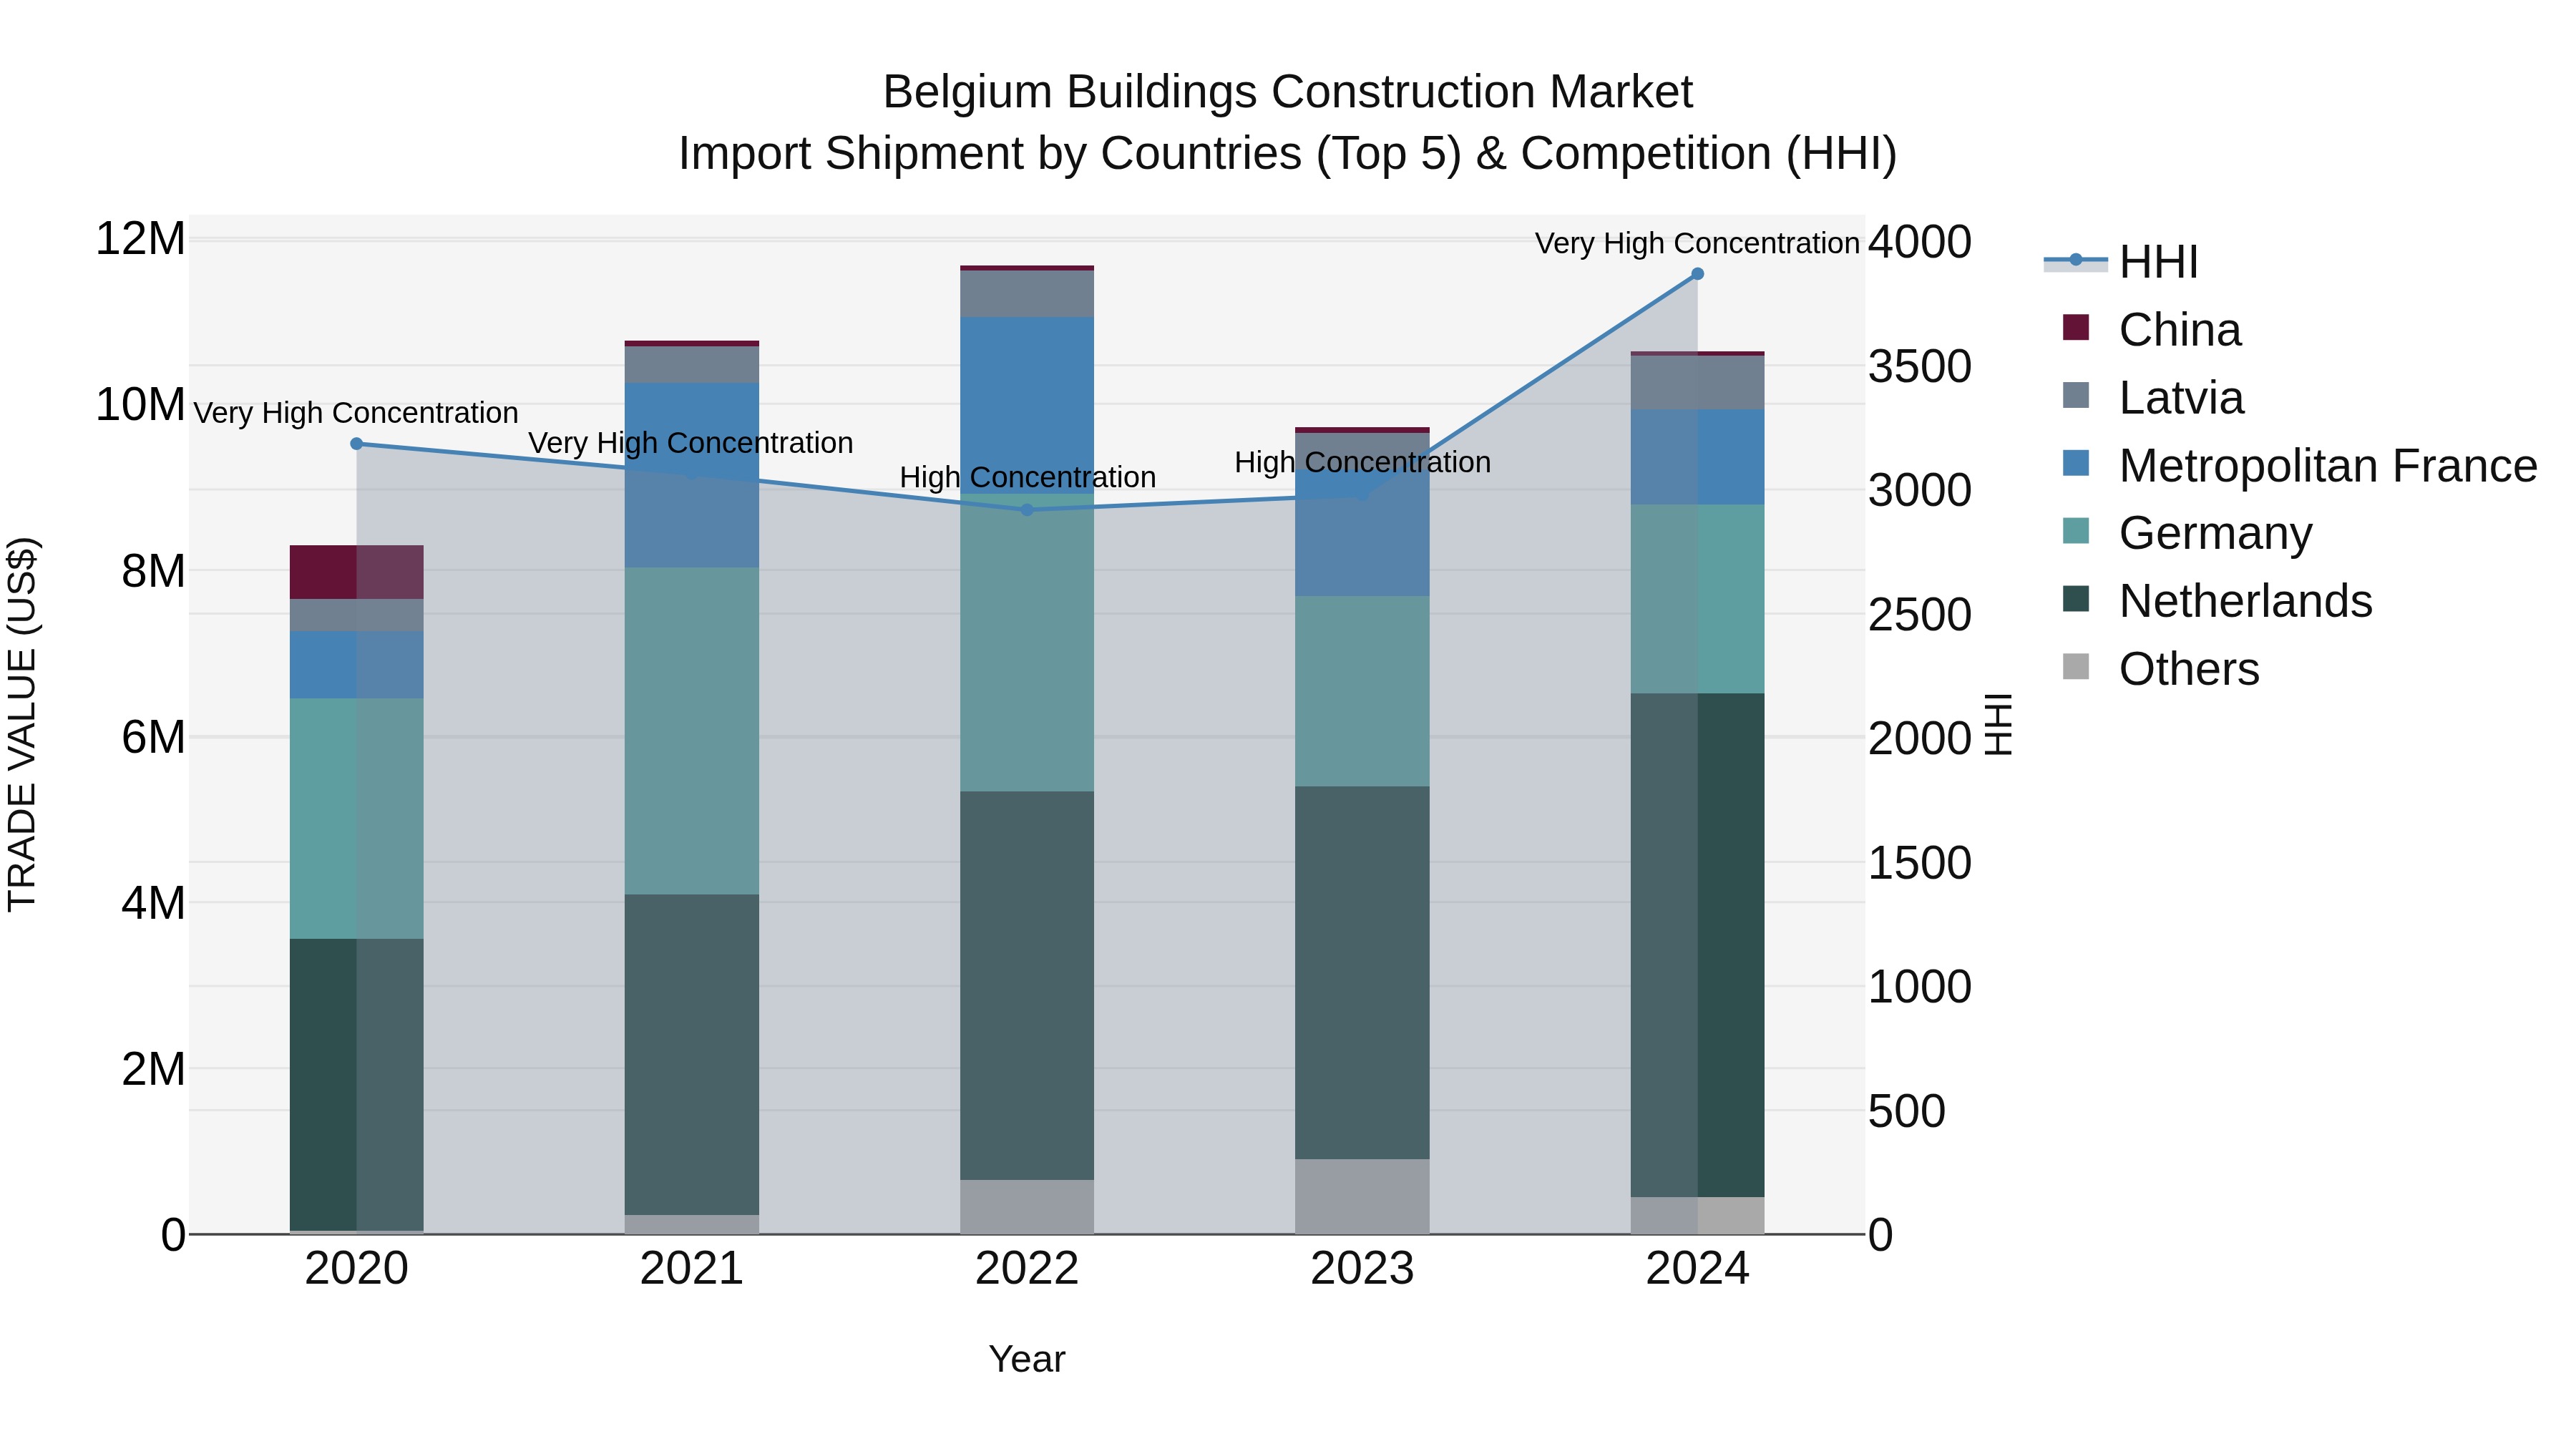
Belgium Buildings Construction Market Top 5 Importing Countries and Market Competition (HHI) Analysis
Belgium`s buildings construction import shipments in 2024 show a significant increase in concentration, with top exporters being Netherlands, Germany, Metropolitan France, Latvia, and Poland. The high Herfindahl-Hirschman Index (HHI) in 2023 escalated to very high in 2024, indicating a concentrated market. The compound annual growth rate (CAGR) from 2020 to 2024 stands at a healthy 6.39%, with a notable growth rate of 9.37% from 2023 to 2024. This data suggests a robust and competitive market landscape in the construction import sector for Belgium.
Key Highlights of the Report:
- Belgium Buildings Construction Market Outlook
- Market Size of Belgium Buildings Construction Market, 2025
- Forecast of Belgium Buildings Construction Market, 2032
- Historical Data and Forecast of Belgium Buildings Construction Revenues & Volume for the Period 2022 - 2032F
- Belgium Buildings Construction Market Trend Evolution
- Belgium Buildings Construction Market Drivers and Challenges
- Belgium Buildings Construction Price Trends
- Belgium Buildings Construction Porter's Five Forces
- Belgium Buildings Construction Industry Life Cycle
- Historical Data and Forecast of Belgium Buildings Construction Market Revenues & Volume By Construction Type for the Period 2022 - 2032F
- Historical Data and Forecast of Belgium Buildings Construction Market Revenues & Volume By Residential Buildings for the Period 2022 - 2032F
- Historical Data and Forecast of Belgium Buildings Construction Market Revenues & Volume By Commercial Buildings for the Period 2022 - 2032F
- Historical Data and Forecast of Belgium Buildings Construction Market Revenues & Volume By Industrial Facilities for the Period 2022 - 2032F
- Historical Data and Forecast of Belgium Buildings Construction Market Revenues & Volume By Public Infrastructure for the Period 2022 - 2032F
- Historical Data and Forecast of Belgium Buildings Construction Market Revenues & Volume By Smart Buildings for the Period 2022 - 2032F
- Historical Data and Forecast of Belgium Buildings Construction Market Revenues & Volume By Material Used for the Period 2022 - 2032F
- Historical Data and Forecast of Belgium Buildings Construction Market Revenues & Volume By Concrete for the Period 2022 - 2032F
- Historical Data and Forecast of Belgium Buildings Construction Market Revenues & Volume By Steel for the Period 2022 - 2032F
- Historical Data and Forecast of Belgium Buildings Construction Market Revenues & Volume By Wood for the Period 2022 - 2032F
- Historical Data and Forecast of Belgium Buildings Construction Market Revenues & Volume By Glass for the Period 2022 - 2032F
- Historical Data and Forecast of Belgium Buildings Construction Market Revenues & Volume By Aluminum for the Period 2022 - 2032F
- Historical Data and Forecast of Belgium Buildings Construction Market Revenues & Volume By Composites for the Period 2022 - 2032F
- Historical Data and Forecast of Belgium Buildings Construction Market Revenues & Volume By Brick for the Period 2022 - 2032F
- Historical Data and Forecast of Belgium Buildings Construction Market Revenues & Volume By End User for the Period 2022 - 2032F
- Historical Data and Forecast of Belgium Buildings Construction Market Revenues & Volume By Homeowners for the Period 2022 - 2032F
- Historical Data and Forecast of Belgium Buildings Construction Market Revenues & Volume By Real Estate Developers for the Period 2022 - 2032F
- Historical Data and Forecast of Belgium Buildings Construction Market Revenues & Volume By Manufacturing Plants for the Period 2022 - 2032F
- Historical Data and Forecast of Belgium Buildings Construction Market Revenues & Volume By Government Agencies for the Period 2022 - 2032F
- Historical Data and Forecast of Belgium Buildings Construction Market Revenues & Volume By Tech Companies for the Period 2022 - 2032F
- Belgium Buildings Construction Import Export Trade Statistics
- Market Opportunity Assessment By Construction Type
- Market Opportunity Assessment By Material Used
- Market Opportunity Assessment By End User
- Belgium Buildings Construction Top Companies Market Share
- Belgium Buildings Construction Competitive Benchmarking By Technical and Operational Parameters
- Belgium Buildings Construction Company Profiles
- Belgium Buildings Construction Key Strategic Recommendations
Frequently Asked Questions About the Market Study (FAQs):
6Wresearch actively monitors the Belgium Buildings Construction Market and publishes its comprehensive annual report, highlighting emerging trends, growth drivers, revenue analysis, and forecast outlook. Our insights help businesses to make data-backed strategic decisions with ongoing market dynamics. Our analysts track relevent industries related to the Belgium Buildings Construction Market, allowing our clients with actionable intelligence and reliable forecasts tailored to emerging regional needs.
Yes, we provide customisation as per your requirements. To learn more, feel free to contact us on sales@6wresearch.com
1 Executive Summary |
2 Introduction |
2.1 Key Highlights of the Report |
2.2 Report Description |
2.3 Market Scope & Segmentation |
2.4 Research Methodology |
2.5 Assumptions |
3 Belgium Buildings Construction Market Overview |
3.1 Belgium Country Macro Economic Indicators |
3.2 Belgium Buildings Construction Market Revenues & Volume, 2022 & 2032F |
3.3 Belgium Buildings Construction Market - Industry Life Cycle |
3.4 Belgium Buildings Construction Market - Porter's Five Forces |
3.5 Belgium Buildings Construction Market Revenues & Volume Share, By Construction Type, 2022 & 2032F |
3.6 Belgium Buildings Construction Market Revenues & Volume Share, By Material Used, 2022 & 2032F |
3.7 Belgium Buildings Construction Market Revenues & Volume Share, By End User, 2022 & 2032F |
4 Belgium Buildings Construction Market Dynamics |
4.1 Impact Analysis |
4.2 Market Drivers |
4.2.1 Increasing urbanization and population growth leading to higher demand for residential and commercial buildings. |
4.2.2 Government initiatives promoting sustainable construction practices and energy-efficient buildings. |
4.2.3 Technological advancements leading to innovation in construction materials and methods. |
4.3 Market Restraints |
4.3.1 Fluctuating raw material prices affecting construction costs. |
4.3.2 Regulatory challenges and bureaucratic hurdles delaying project approvals and construction timelines. |
5 Belgium Buildings Construction Market Trends |
6 Belgium Buildings Construction Market, By Types |
6.1 Belgium Buildings Construction Market, By Construction Type |
6.1.1 Overview and Analysis |
6.1.2 Belgium Buildings Construction Market Revenues & Volume, By Construction Type, 2022 - 2032F |
6.1.3 Belgium Buildings Construction Market Revenues & Volume, By Residential Buildings, 2022 - 2032F |
6.1.4 Belgium Buildings Construction Market Revenues & Volume, By Commercial Buildings, 2022 - 2032F |
6.1.5 Belgium Buildings Construction Market Revenues & Volume, By Industrial Facilities, 2022 - 2032F |
6.1.6 Belgium Buildings Construction Market Revenues & Volume, By Public Infrastructure, 2022 - 2032F |
6.1.7 Belgium Buildings Construction Market Revenues & Volume, By Smart Buildings, 2022 - 2032F |
6.2 Belgium Buildings Construction Market, By Material Used |
6.2.1 Overview and Analysis |
6.2.2 Belgium Buildings Construction Market Revenues & Volume, By Concrete, 2022 - 2032F |
6.2.3 Belgium Buildings Construction Market Revenues & Volume, By Steel, 2022 - 2032F |
6.2.4 Belgium Buildings Construction Market Revenues & Volume, By Wood, 2022 - 2032F |
6.2.5 Belgium Buildings Construction Market Revenues & Volume, By Glass, 2022 - 2032F |
6.2.6 Belgium Buildings Construction Market Revenues & Volume, By Aluminum, 2022 - 2032F |
6.2.7 Belgium Buildings Construction Market Revenues & Volume, By Composites, 2022 - 2032F |
6.3 Belgium Buildings Construction Market, By End User |
6.3.1 Overview and Analysis |
6.3.2 Belgium Buildings Construction Market Revenues & Volume, By Homeowners, 2022 - 2032F |
6.3.3 Belgium Buildings Construction Market Revenues & Volume, By Real Estate Developers, 2022 - 2032F |
6.3.4 Belgium Buildings Construction Market Revenues & Volume, By Manufacturing Plants, 2022 - 2032F |
6.3.5 Belgium Buildings Construction Market Revenues & Volume, By Government Agencies, 2022 - 2032F |
6.3.6 Belgium Buildings Construction Market Revenues & Volume, By Tech Companies, 2022 - 2032F |
7 Belgium Buildings Construction Market Import-Export Trade Statistics |
7.1 Belgium Buildings Construction Market Export to Major Countries |
7.2 Belgium Buildings Construction Market Imports from Major Countries |
8 Belgium Buildings Construction Market Key Performance Indicators |
8.1 Percentage of buildings constructed meeting green building standards. |
8.2 Adoption rate of innovative construction technologies in the market. |
8.3 Number of new building permits issued by local authorities. |
8.4 Percentage of construction projects completed within the scheduled timeline. |
8.5 Energy efficiency rating of newly constructed buildings. |
9 Belgium Buildings Construction Market - Opportunity Assessment |
9.1 Belgium Buildings Construction Market Opportunity Assessment, By Construction Type, 2022 & 2032F |
9.2 Belgium Buildings Construction Market Opportunity Assessment, By Material Used, 2022 & 2032F |
9.3 Belgium Buildings Construction Market Opportunity Assessment, By End User, 2022 & 2032F |
10 Belgium Buildings Construction Market - Competitive Landscape |
10.1 Belgium Buildings Construction Market Revenue Share, By Companies, 2025 |
10.2 Belgium Buildings Construction Market Competitive Benchmarking, By Operating and Technical Parameters |
11 Company Profiles |
12 Recommendations |
13 Disclaimer |
Global Go To Market Strategy - 2030
Export potential enables firms to identify high-growth global markets with greater confidence by combining advanced trade intelligence with a structured quantitative methodology. The framework analyzes emerging demand trends and country-level import patterns while integrating macroeconomic and trade datasets such as GDP and population forecasts, bilateral import–export flows, tariff structures, elasticity differentials between developed and developing economies, geographic distance, and import demand projections. Using weighted trade values from 2020–2024 as the base period to project country-to-country export potential for 2030, these inputs are operationalized through calculated drivers such as gravity model parameters, tariff impact factors, and projected GDP per-capita growth. Through an analysis of hidden potentials, demand hotspots, and market conditions that are most favorable to success, this method enables firms to focus on target countries, maximize returns, and global expansion with data, backed by accuracy.
By factoring in the projected importer demand gap that is currently unmet and could be potential opportunity, it identifies the potential for the Exporter (Country) among 190 countries, against the general trade analysis, which identifies the biggest importer or exporter.
To discover high-growth global markets and optimize your business strategy:
Click Here
Pricing
- Single User License$ 1,995
- Department License$ 2,400
- Site License$ 3,120
- Global License$ 3,795

Leadership Perspectives from Industry Events
Search
Thought Leadership and Analyst Meet


Our Clients
6WResearch In News
- Doha a strategic location for EV manufacturing hub: IPA Qatar
- Demand for luxury TVs surging in the GCC, says Samsung
- Empowering Growth: The Thriving Journey of Bangladesh’s Cable Industry
- Demand for luxury TVs surging in the GCC, says Samsung
- Video call with a traditional healer? Once unthinkable, it’s now common in South Africa
- Intelligent Buildings To Smooth GCC’s Path To Net Zero
Latest Reports
- New Zealand Aseptic Manufacturing Market (2026-2032)
- Netherlands Aseptic Manufacturing Market (2026-2032)
- Nauru Aseptic Manufacturing Market (2026-2032)
- Namibia Aseptic Manufacturing Market (2026-2032)
- Mozambique Aseptic Manufacturing Market (2026-2032)
- Montenegro Aseptic Manufacturing Market (2026-2032)
- Mongolia Aseptic Manufacturing Market (2026-2032)
- Monaco Aseptic Manufacturing Market (2026-2032)
- Micronesia Aseptic Manufacturing Market (2026-2032)
- Mauritius Aseptic Manufacturing Market (2026-2032)
Industry Events and Analyst Meet

HIMTEX 2026

India Refining Summit 2026

India EV Show 2026

EV tech India Expo 2026

Auto Tech Asia 2026
Whitepaper
- Middle East & Africa Commercial Security Market Click here to view more.
- Middle East & Africa Fire Safety Systems & Equipment Market Click here to view more.
- GCC Drone Market Click here to view more.
- Middle East Lighting Fixture Market Click here to view more.
- GCC Physical & Perimeter Security Market Click here to view more.