Belgium Indoor Farming Market (2026-2032) | Value, Industry, Forecast, Segmentation, Share, Analysis, Outlook, Competitive Landscape, Companies, Growth, Size & Revenue, Trends
Market Forecast By Facility Type (Greenhouse, Indoor Vertical Farms, Container Farms, Indoor Deep Water Culture, Others), By Crop Type (Fruits, Vegetables and Herbs, Flowers and Ornamentals, Others), By Component (Hardware, Software), By Growing System (Aeroponics, Hydroponics, Aquaponics, Soil-based, Hybrid) And Competitive Landscape
| Product Code: ETC6355746 | Publication Date: Sep 2024 | Updated Date: Apr 2026 | Product Type: Market Research Report | |
| Publisher: 6Wresearch | Author: Vasudha | No. of Pages: 75 | No. of Figures: 35 | No. of Tables: 20 |
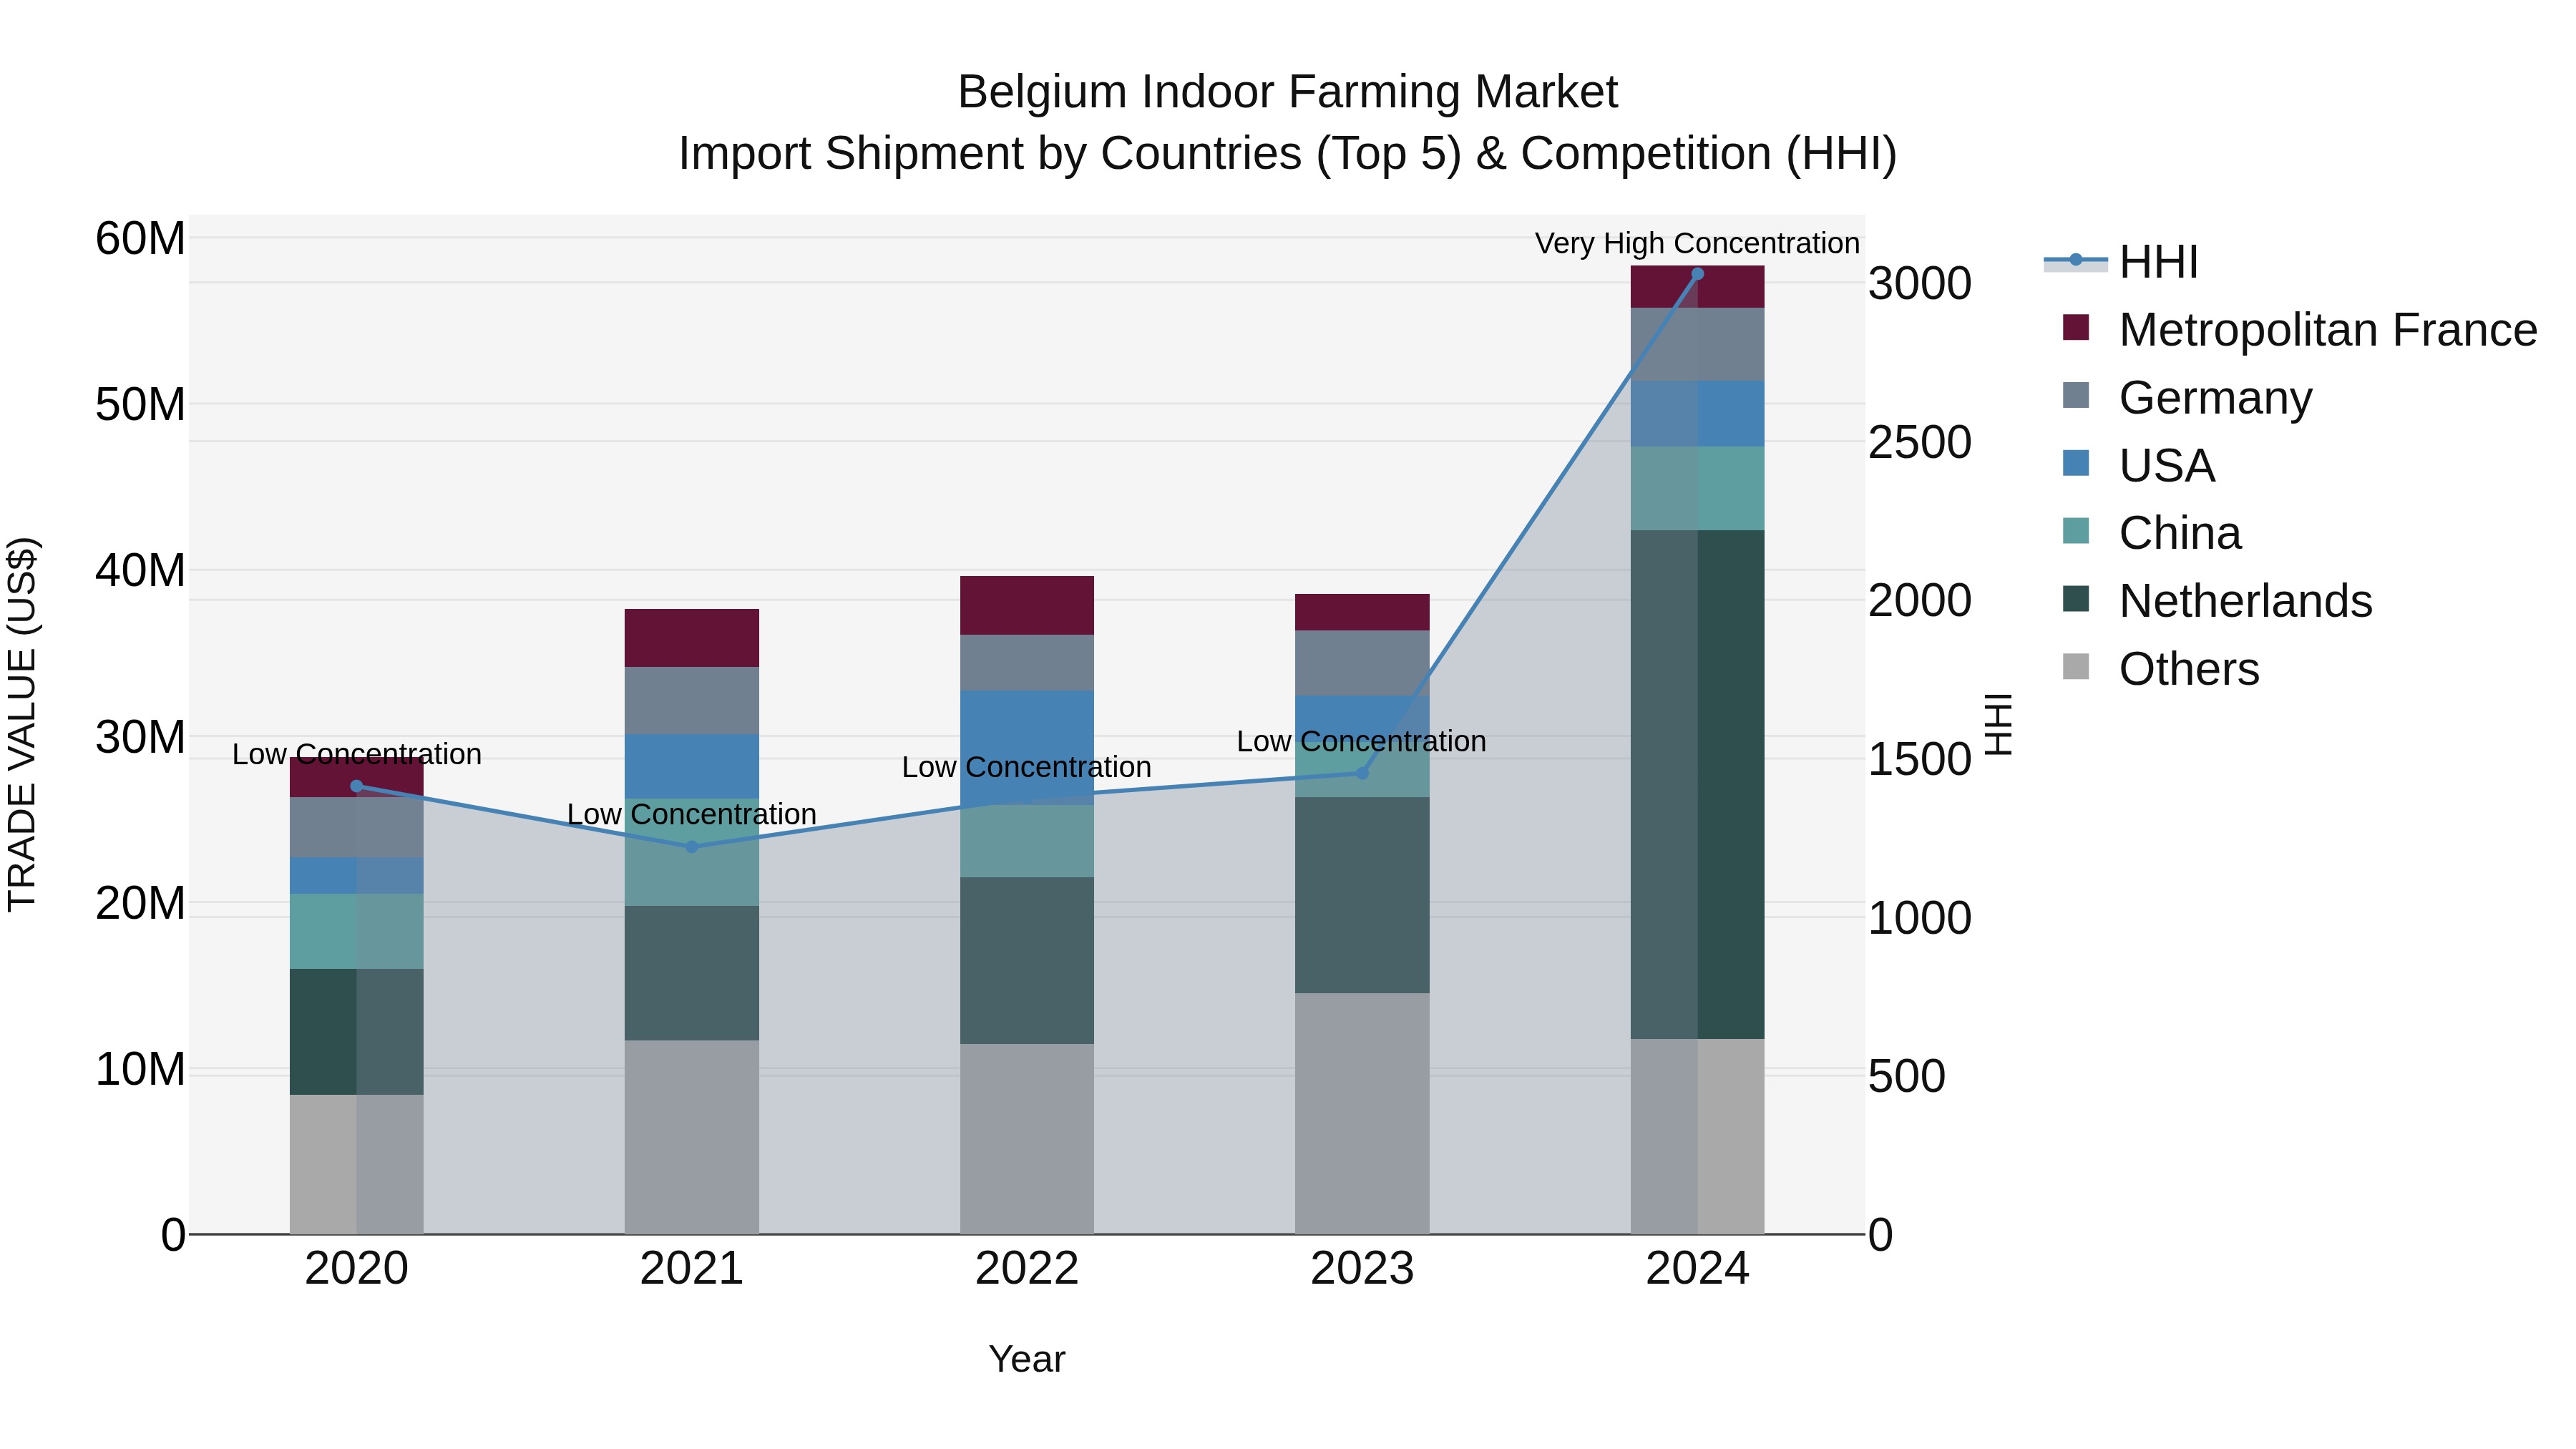
Belgium Indoor Farming Market Top 5 Importing Countries and Market Competition (HHI) Analysis
The indoor farming import market in Belgium experienced significant growth in 2024, with the top exporting countries being the Netherlands, China, Germany, USA, and Finland. The market concentration, as measured by the HHI, increased significantly from 2023 to 2024, indicating a more concentrated market landscape. The impressive compound annual growth rate (CAGR) of 19.35% from 2020 to 2024, coupled with a remarkable growth rate of 51.23% from 2023 to 2024, underscores the strong demand and potential profitability in the indoor farming sector in Belgium.
Key Highlights of the Report:
- Belgium Indoor Farming Market Outlook
- Market Size of Belgium Indoor Farming Market, 2025
- Forecast of Belgium Indoor Farming Market, 2032
- Historical Data and Forecast of Belgium Indoor Farming Revenues & Volume for the Period 2022 - 2032
- Belgium Indoor Farming Market Trend Evolution
- Belgium Indoor Farming Market Drivers and Challenges
- Belgium Indoor Farming Price Trends
- Belgium Indoor Farming Porter's Five Forces
- Belgium Indoor Farming Industry Life Cycle
- Historical Data and Forecast of Belgium Indoor Farming Market Revenues & Volume By Facility Type for the Period 2022 - 2032
- Historical Data and Forecast of Belgium Indoor Farming Market Revenues & Volume By Greenhouse for the Period 2022 - 2032
- Historical Data and Forecast of Belgium Indoor Farming Market Revenues & Volume By Indoor Vertical Farms for the Period 2022 - 2032
- Historical Data and Forecast of Belgium Indoor Farming Market Revenues & Volume By Container Farms for the Period 2022 - 2032
- Historical Data and Forecast of Belgium Indoor Farming Market Revenues & Volume By Indoor Deep Water Culture for the Period 2022 - 2032
- Historical Data and Forecast of Belgium Indoor Farming Market Revenues & Volume By Others for the Period 2022 - 2032
- Historical Data and Forecast of Belgium Indoor Farming Market Revenues & Volume By Crop Type for the Period 2022 - 2032
- Historical Data and Forecast of Belgium Indoor Farming Market Revenues & Volume By Fruits for the Period 2022 - 2032
- Historical Data and Forecast of Belgium Indoor Farming Market Revenues & Volume By Vegetables and Herbs for the Period 2022 - 2032
- Historical Data and Forecast of Belgium Indoor Farming Market Revenues & Volume By Flowers and Ornamentals for the Period 2022 - 2032
- Historical Data and Forecast of Belgium Indoor Farming Market Revenues & Volume By Others for the Period 2022 - 2032
- Historical Data and Forecast of Belgium Indoor Farming Market Revenues & Volume By Component for the Period 2022 - 2032
- Historical Data and Forecast of Belgium Indoor Farming Market Revenues & Volume By Hardware for the Period 2022 - 2032
- Historical Data and Forecast of Belgium Indoor Farming Market Revenues & Volume By Software for the Period 2022 - 2032
- Historical Data and Forecast of Belgium Indoor Farming Market Revenues & Volume By Growing System for the Period 2022 - 2032
- Historical Data and Forecast of Belgium Indoor Farming Market Revenues & Volume By Aeroponics for the Period 2022 - 2032
- Historical Data and Forecast of Belgium Indoor Farming Market Revenues & Volume By Hydroponics for the Period 2022 - 2032
- Historical Data and Forecast of Belgium Indoor Farming Market Revenues & Volume By Aquaponics for the Period 2022 - 2032
- Historical Data and Forecast of Belgium Indoor Farming Market Revenues & Volume By Soil-based for the Period 2022 - 2032
- Historical Data and Forecast of Belgium Indoor Farming Market Revenues & Volume By Hybrid for the Period 2022 - 2032
- Belgium Indoor Farming Import Export Trade Statistics
- Market Opportunity Assessment By Facility Type
- Market Opportunity Assessment By Crop Type
- Market Opportunity Assessment By Component
- Market Opportunity Assessment By Growing System
- Belgium Indoor Farming Top Companies Market Share
- Belgium Indoor Farming Competitive Benchmarking By Technical and Operational Parameters
- Belgium Indoor Farming Company Profiles
- Belgium Indoor Farming Key Strategic Recommendations
Frequently Asked Questions About the Market Study (FAQs):
6Wresearch actively monitors the Belgium Indoor Farming Market and publishes its comprehensive annual report, highlighting emerging trends, growth drivers, revenue analysis, and forecast outlook. Our insights help businesses to make data-backed strategic decisions with ongoing market dynamics. Our analysts track relevent industries related to the Belgium Indoor Farming Market, allowing our clients with actionable intelligence and reliable forecasts tailored to emerging regional needs.
Yes, we provide customisation as per your requirements. To learn more, feel free to contact us on sales@6wresearch.com
1 Executive Summary |
2 Introduction |
2.1 Key Highlights of the Report |
2.2 Report Description |
2.3 Market Scope & Segmentation |
2.4 Research Methodology |
2.5 Assumptions |
3 Belgium Indoor Farming Market Overview |
3.1 Belgium Country Macro Economic Indicators |
3.2 Belgium Indoor Farming Market Revenues & Volume, 2022 & 2032F |
3.3 Belgium Indoor Farming Market - Industry Life Cycle |
3.4 Belgium Indoor Farming Market - Porter's Five Forces |
3.5 Belgium Indoor Farming Market Revenues & Volume Share, By Facility Type, 2022 & 2032F |
3.6 Belgium Indoor Farming Market Revenues & Volume Share, By Crop Type, 2022 & 2032F |
3.7 Belgium Indoor Farming Market Revenues & Volume Share, By Component, 2022 & 2032F |
3.8 Belgium Indoor Farming Market Revenues & Volume Share, By Growing System, 2022 & 2032F |
4 Belgium Indoor Farming Market Dynamics |
4.1 Impact Analysis |
4.2 Market Drivers |
4.2.1 Increasing consumer demand for locally grown produce due to rising awareness about food safety and sustainability. |
4.2.2 Government support and initiatives promoting indoor farming practices to enhance food security and reduce environmental impact. |
4.2.3 Technological advancements in indoor farming techniques leading to higher yields and lower production costs. |
4.3 Market Restraints |
4.3.1 High initial investment costs for setting up indoor farming facilities and purchasing equipment. |
4.3.2 Limited availability of suitable land for expanding indoor farming operations. |
4.3.3 Energy consumption and operational costs associated with maintaining indoor farming environments. |
5 Belgium Indoor Farming Market Trends |
6 Belgium Indoor Farming Market, By Types |
6.1 Belgium Indoor Farming Market, By Facility Type |
6.1.1 Overview and Analysis |
6.1.2 Belgium Indoor Farming Market Revenues & Volume, By Facility Type, 2022 - 2032F |
6.1.3 Belgium Indoor Farming Market Revenues & Volume, By Greenhouse, 2022 - 2032F |
6.1.4 Belgium Indoor Farming Market Revenues & Volume, By Indoor Vertical Farms, 2022 - 2032F |
6.1.5 Belgium Indoor Farming Market Revenues & Volume, By Container Farms, 2022 - 2032F |
6.1.6 Belgium Indoor Farming Market Revenues & Volume, By Indoor Deep Water Culture, 2022 - 2032F |
6.1.7 Belgium Indoor Farming Market Revenues & Volume, By Others, 2022 - 2032F |
6.2 Belgium Indoor Farming Market, By Crop Type |
6.2.1 Overview and Analysis |
6.2.2 Belgium Indoor Farming Market Revenues & Volume, By Fruits, 2022 - 2032F |
6.2.3 Belgium Indoor Farming Market Revenues & Volume, By Vegetables and Herbs, 2022 - 2032F |
6.2.4 Belgium Indoor Farming Market Revenues & Volume, By Flowers and Ornamentals, 2022 - 2032F |
6.2.5 Belgium Indoor Farming Market Revenues & Volume, By Others, 2022 - 2032F |
6.3 Belgium Indoor Farming Market, By Component |
6.3.1 Overview and Analysis |
6.3.2 Belgium Indoor Farming Market Revenues & Volume, By Hardware, 2022 - 2032F |
6.3.3 Belgium Indoor Farming Market Revenues & Volume, By Software, 2022 - 2032F |
6.4 Belgium Indoor Farming Market, By Growing System |
6.4.1 Overview and Analysis |
6.4.2 Belgium Indoor Farming Market Revenues & Volume, By Aeroponics, 2022 - 2032F |
6.4.3 Belgium Indoor Farming Market Revenues & Volume, By Hydroponics, 2022 - 2032F |
6.4.4 Belgium Indoor Farming Market Revenues & Volume, By Aquaponics, 2022 - 2032F |
6.4.5 Belgium Indoor Farming Market Revenues & Volume, By Soil-based, 2022 - 2032F |
6.4.6 Belgium Indoor Farming Market Revenues & Volume, By Hybrid, 2022 - 2032F |
7 Belgium Indoor Farming Market Import-Export Trade Statistics |
7.1 Belgium Indoor Farming Market Export to Major Countries |
7.2 Belgium Indoor Farming Market Imports from Major Countries |
8 Belgium Indoor Farming Market Key Performance Indicators |
8.1 Crop yield per square meter over time, indicating the efficiency and productivity of indoor farming operations. |
8.2 Percentage reduction in water usage compared to traditional farming methods, demonstrating sustainability and resource efficiency. |
8.3 Employee training hours on new technologies and techniques, reflecting the adaptation and skill development within the indoor farming industry. |
8.4 Percentage of revenue invested in research and development for innovative indoor farming solutions, showcasing commitment to continuous improvement and growth. |
8.5 Number of partnerships and collaborations with academic institutions or research organizations for knowledge sharing and advancement in indoor farming practices. |
9 Belgium Indoor Farming Market - Opportunity Assessment |
9.1 Belgium Indoor Farming Market Opportunity Assessment, By Facility Type, 2022 & 2032F |
9.2 Belgium Indoor Farming Market Opportunity Assessment, By Crop Type, 2022 & 2032F |
9.3 Belgium Indoor Farming Market Opportunity Assessment, By Component, 2022 & 2032F |
9.4 Belgium Indoor Farming Market Opportunity Assessment, By Growing System, 2022 & 2032F |
10 Belgium Indoor Farming Market - Competitive Landscape |
10.1 Belgium Indoor Farming Market Revenue Share, By Companies, 2025 |
10.2 Belgium Indoor Farming Market Competitive Benchmarking, By Operating and Technical Parameters |
11 Company Profiles |
12 Recommendations |
13 Disclaimer |
Global Go To Market Strategy - 2030
Export potential enables firms to identify high-growth global markets with greater confidence by combining advanced trade intelligence with a structured quantitative methodology. The framework analyzes emerging demand trends and country-level import patterns while integrating macroeconomic and trade datasets such as GDP and population forecasts, bilateral import–export flows, tariff structures, elasticity differentials between developed and developing economies, geographic distance, and import demand projections. Using weighted trade values from 2020–2024 as the base period to project country-to-country export potential for 2030, these inputs are operationalized through calculated drivers such as gravity model parameters, tariff impact factors, and projected GDP per-capita growth. Through an analysis of hidden potentials, demand hotspots, and market conditions that are most favorable to success, this method enables firms to focus on target countries, maximize returns, and global expansion with data, backed by accuracy.
By factoring in the projected importer demand gap that is currently unmet and could be potential opportunity, it identifies the potential for the Exporter (Country) among 190 countries, against the general trade analysis, which identifies the biggest importer or exporter.
To discover high-growth global markets and optimize your business strategy:
Click Here
Pricing
- Single User License$ 1,995
- Department License$ 2,400
- Site License$ 3,120
- Global License$ 3,795

Leadership Perspectives from Industry Events
Search
Thought Leadership and Analyst Meet


Our Clients
6WResearch In News
- India Export Attractiveness Tracker 2026
- India Air Conditioner Market Set for Strong Rebound in 2026 After Weather-Led Correction and GST-Driven Recovery: 6Wresearch
- ADAS in India: How Automatic Emergency Braking, Blind Spot Detection & Driver Monitoring are Transforming Road Safety
- Doha a strategic location for EV manufacturing hub: IPA Qatar
- Demand for luxury TVs surging in the GCC, says Samsung
- Empowering Growth: The Thriving Journey of Bangladesh’s Cable Industry
Latest Reports
- Nicaragua RPG Gaming Market (2026-2032)
- New Zealand RPG Gaming Market (2026-2032)
- Netherlands RPG Gaming Market (2026-2032)
- Nauru RPG Gaming Market (2026-2032)
- Namibia RPG Gaming Market (2026-2032)
- Mozambique RPG Gaming Market (2026-2032)
- Montenegro RPG Gaming Market (2026-2032)
- Mongolia RPG Gaming Market (2026-2032)
- Monaco RPG Gaming Market (2026-2032)
- Micronesia RPG Gaming Market (2026-2032)
Industry Events and Analyst Meet

EV India Expo 2026

HIMTEX 2026

India Refining Summit 2026

India EV Show 2026

EV tech India Expo 2026
Whitepaper
- Middle East & Africa Commercial Security Market Click here to view more.
- Middle East & Africa Fire Safety Systems & Equipment Market Click here to view more.
- GCC Drone Market Click here to view more.
- Middle East Lighting Fixture Market Click here to view more.
- GCC Physical & Perimeter Security Market Click here to view more.