Belgium Power Drills Market (2026-2032) | Size, Opportunities, Industry, Outlook, Strategy, Demand, Share, Analysis, Challenges, Value, Growth, Competition, Segmentation, Investment Trends, Pricing Analysis, Consumer Insights, Competitive, Drivers, Supply, Forecast, Strategic Insights, Revenue, Restraints, Trends, Companies, Segments
Market Forecast By Type (Corded, Cordless, Hammer Drill, Impact Drill), By Power Source (Electric, Battery, Pneumatic, Hydraulic), By Application (Woodworking, Metalworking, Concrete Drilling, DIY), By End Use (Industrial, Construction, Automotive, Manufacturing) And Competitive Landscape
| Product Code: ETC10157314 | Publication Date: Apr 2025 | Updated Date: Apr 2026 | Product Type: Market Research Report | |
| Publisher: 6Wresearch | Author: Bhawna Singh | No. of Pages: 65 | No. of Figures: 34 | No. of Tables: 19 |
Belgium Power Drills Market Size (2020-2030)
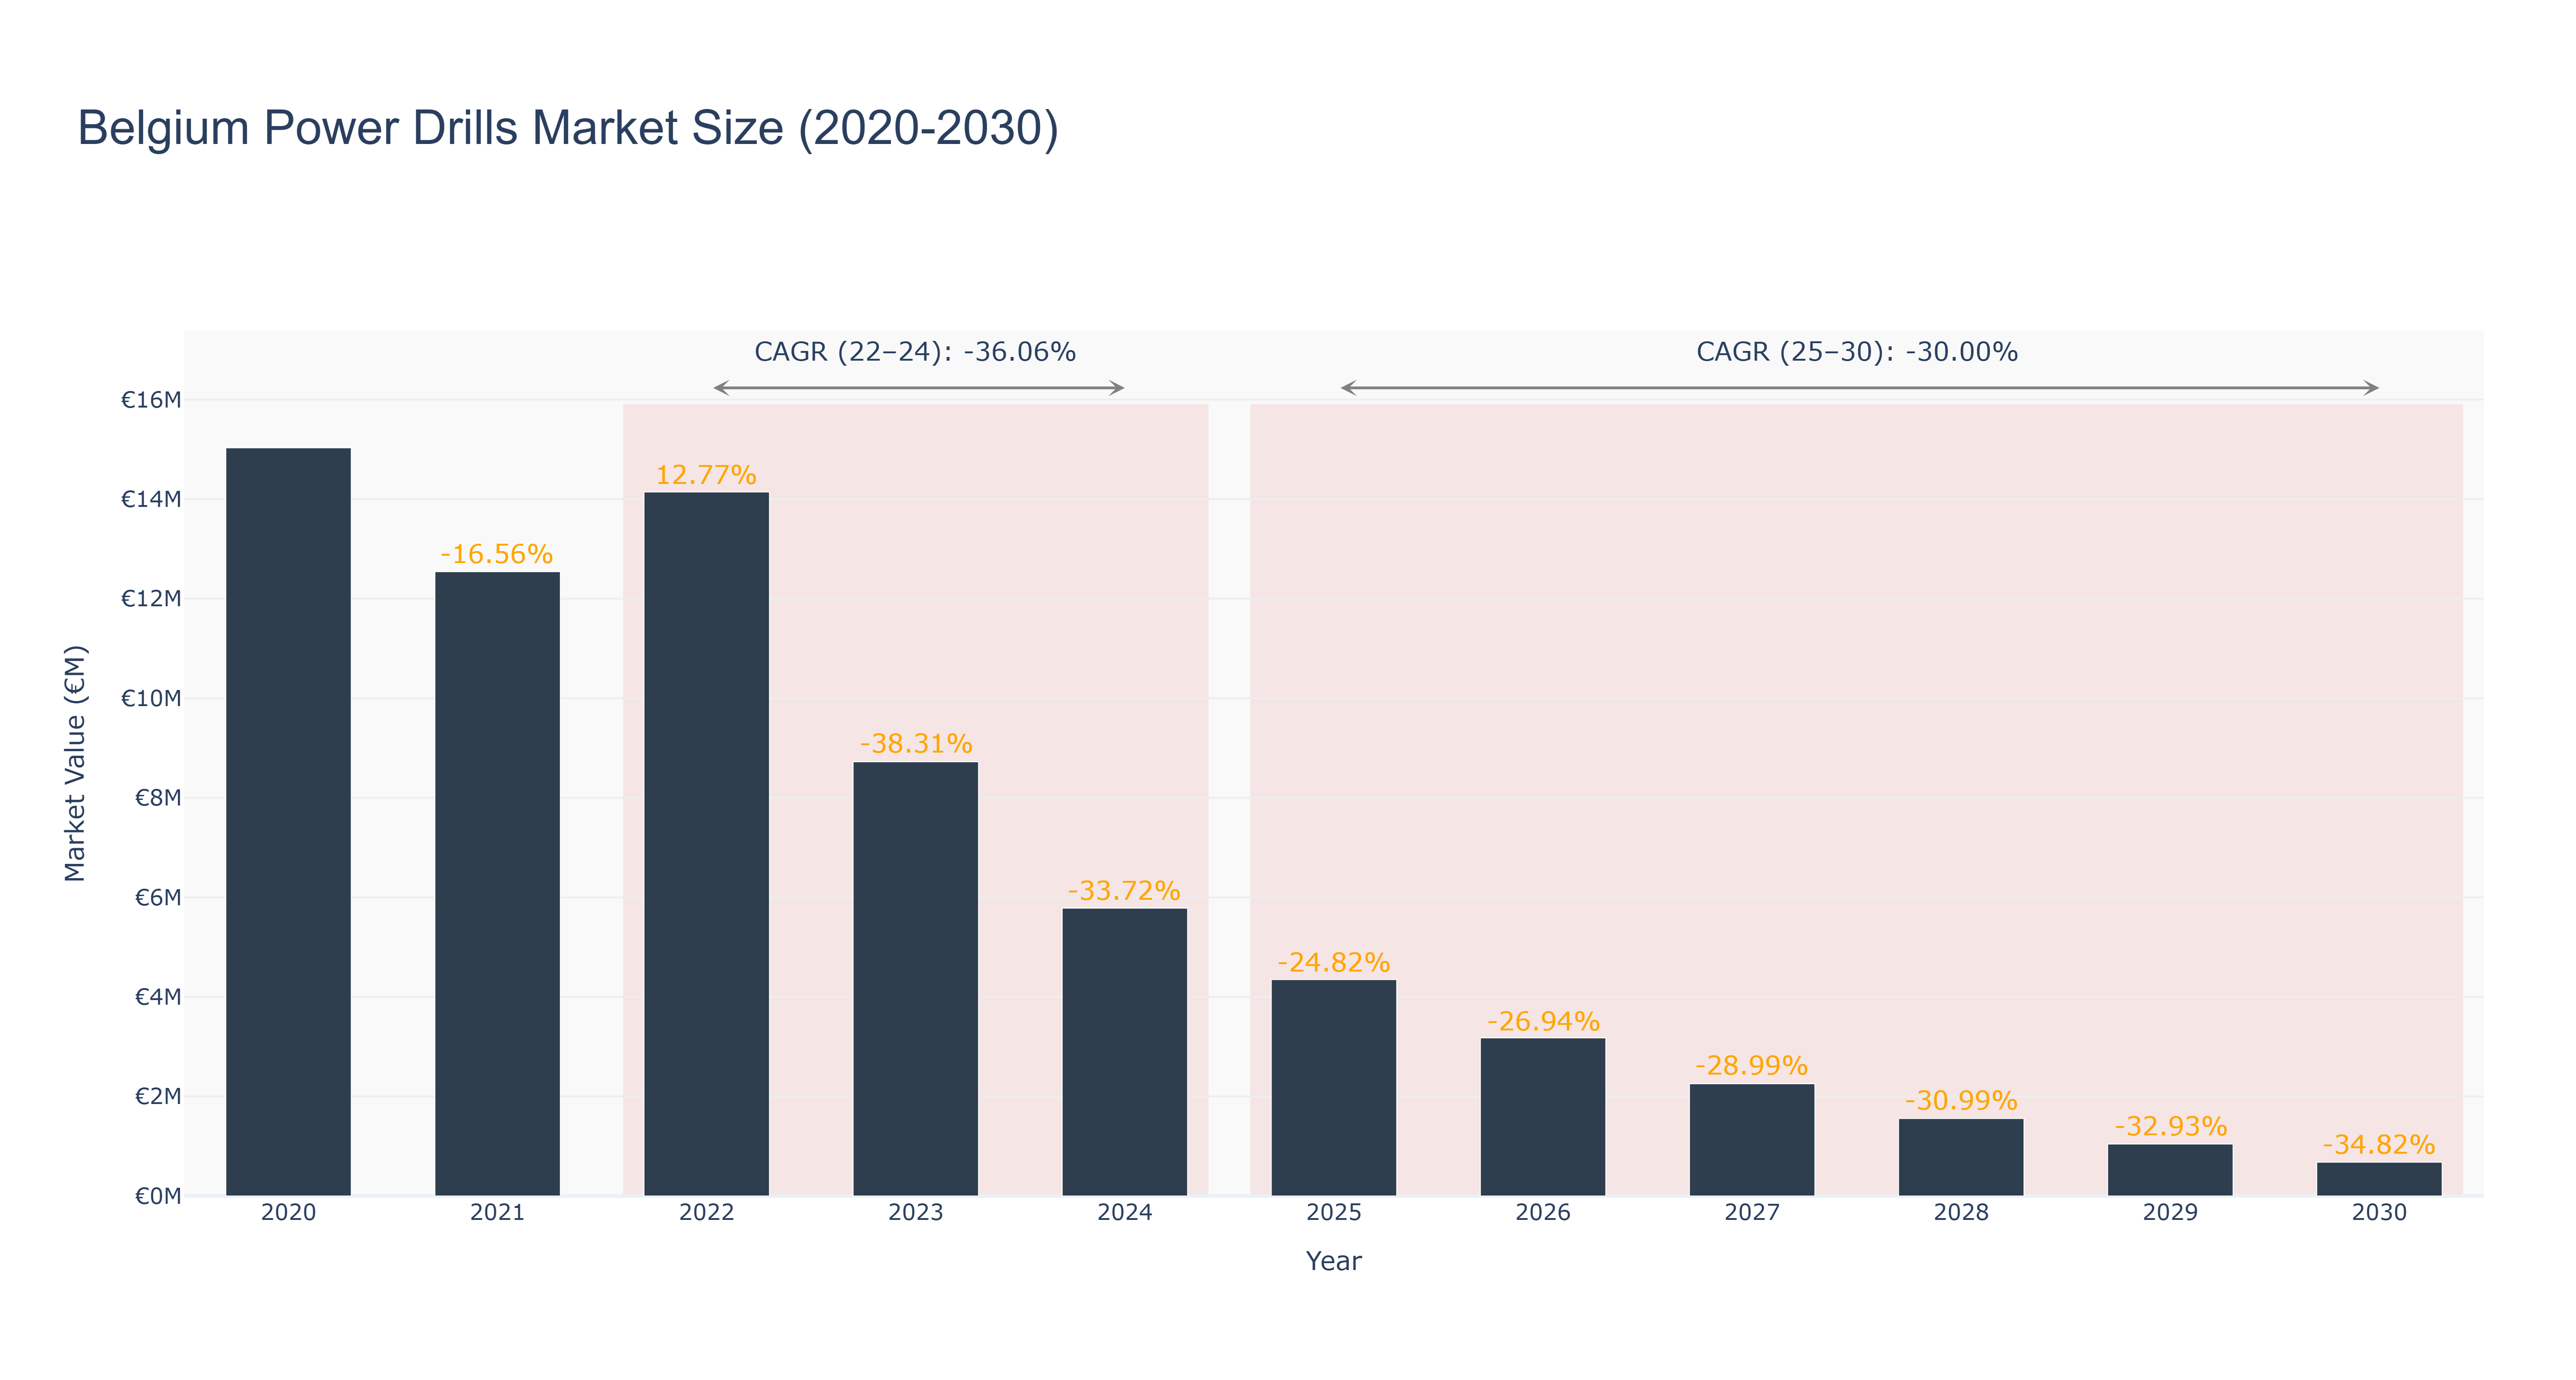
Belgium Power Drills Market has seen a decline in market size from €15.03 million in 2020 to €5.78 million in 2024, with a negative growth trend continuing till 2030. The market is forecasted to further decrease to €0.68 million by 2030, with a CAGR of -30.0% from 2025 to 2030. The peak market size was in 2020 at €15.03 million. The market's downfall can be attributed to factors such as economic downturn, reduced construction activities, and technological advancements leading to more durable products. Despite the current challenges, upcoming investments in renewable energy projects in Belgium are expected to drive the demand for power drills in the near future. Industry drivers include increasing DIY culture, infrastructure development, and government initiatives promoting sustainable construction practices. Moving forward, the market is likely to witness a shift towards more energy-efficient and environmentally friendly power drill solutions.
Belgium Power Drills Market: Production & Trade Performance (2019-2025)
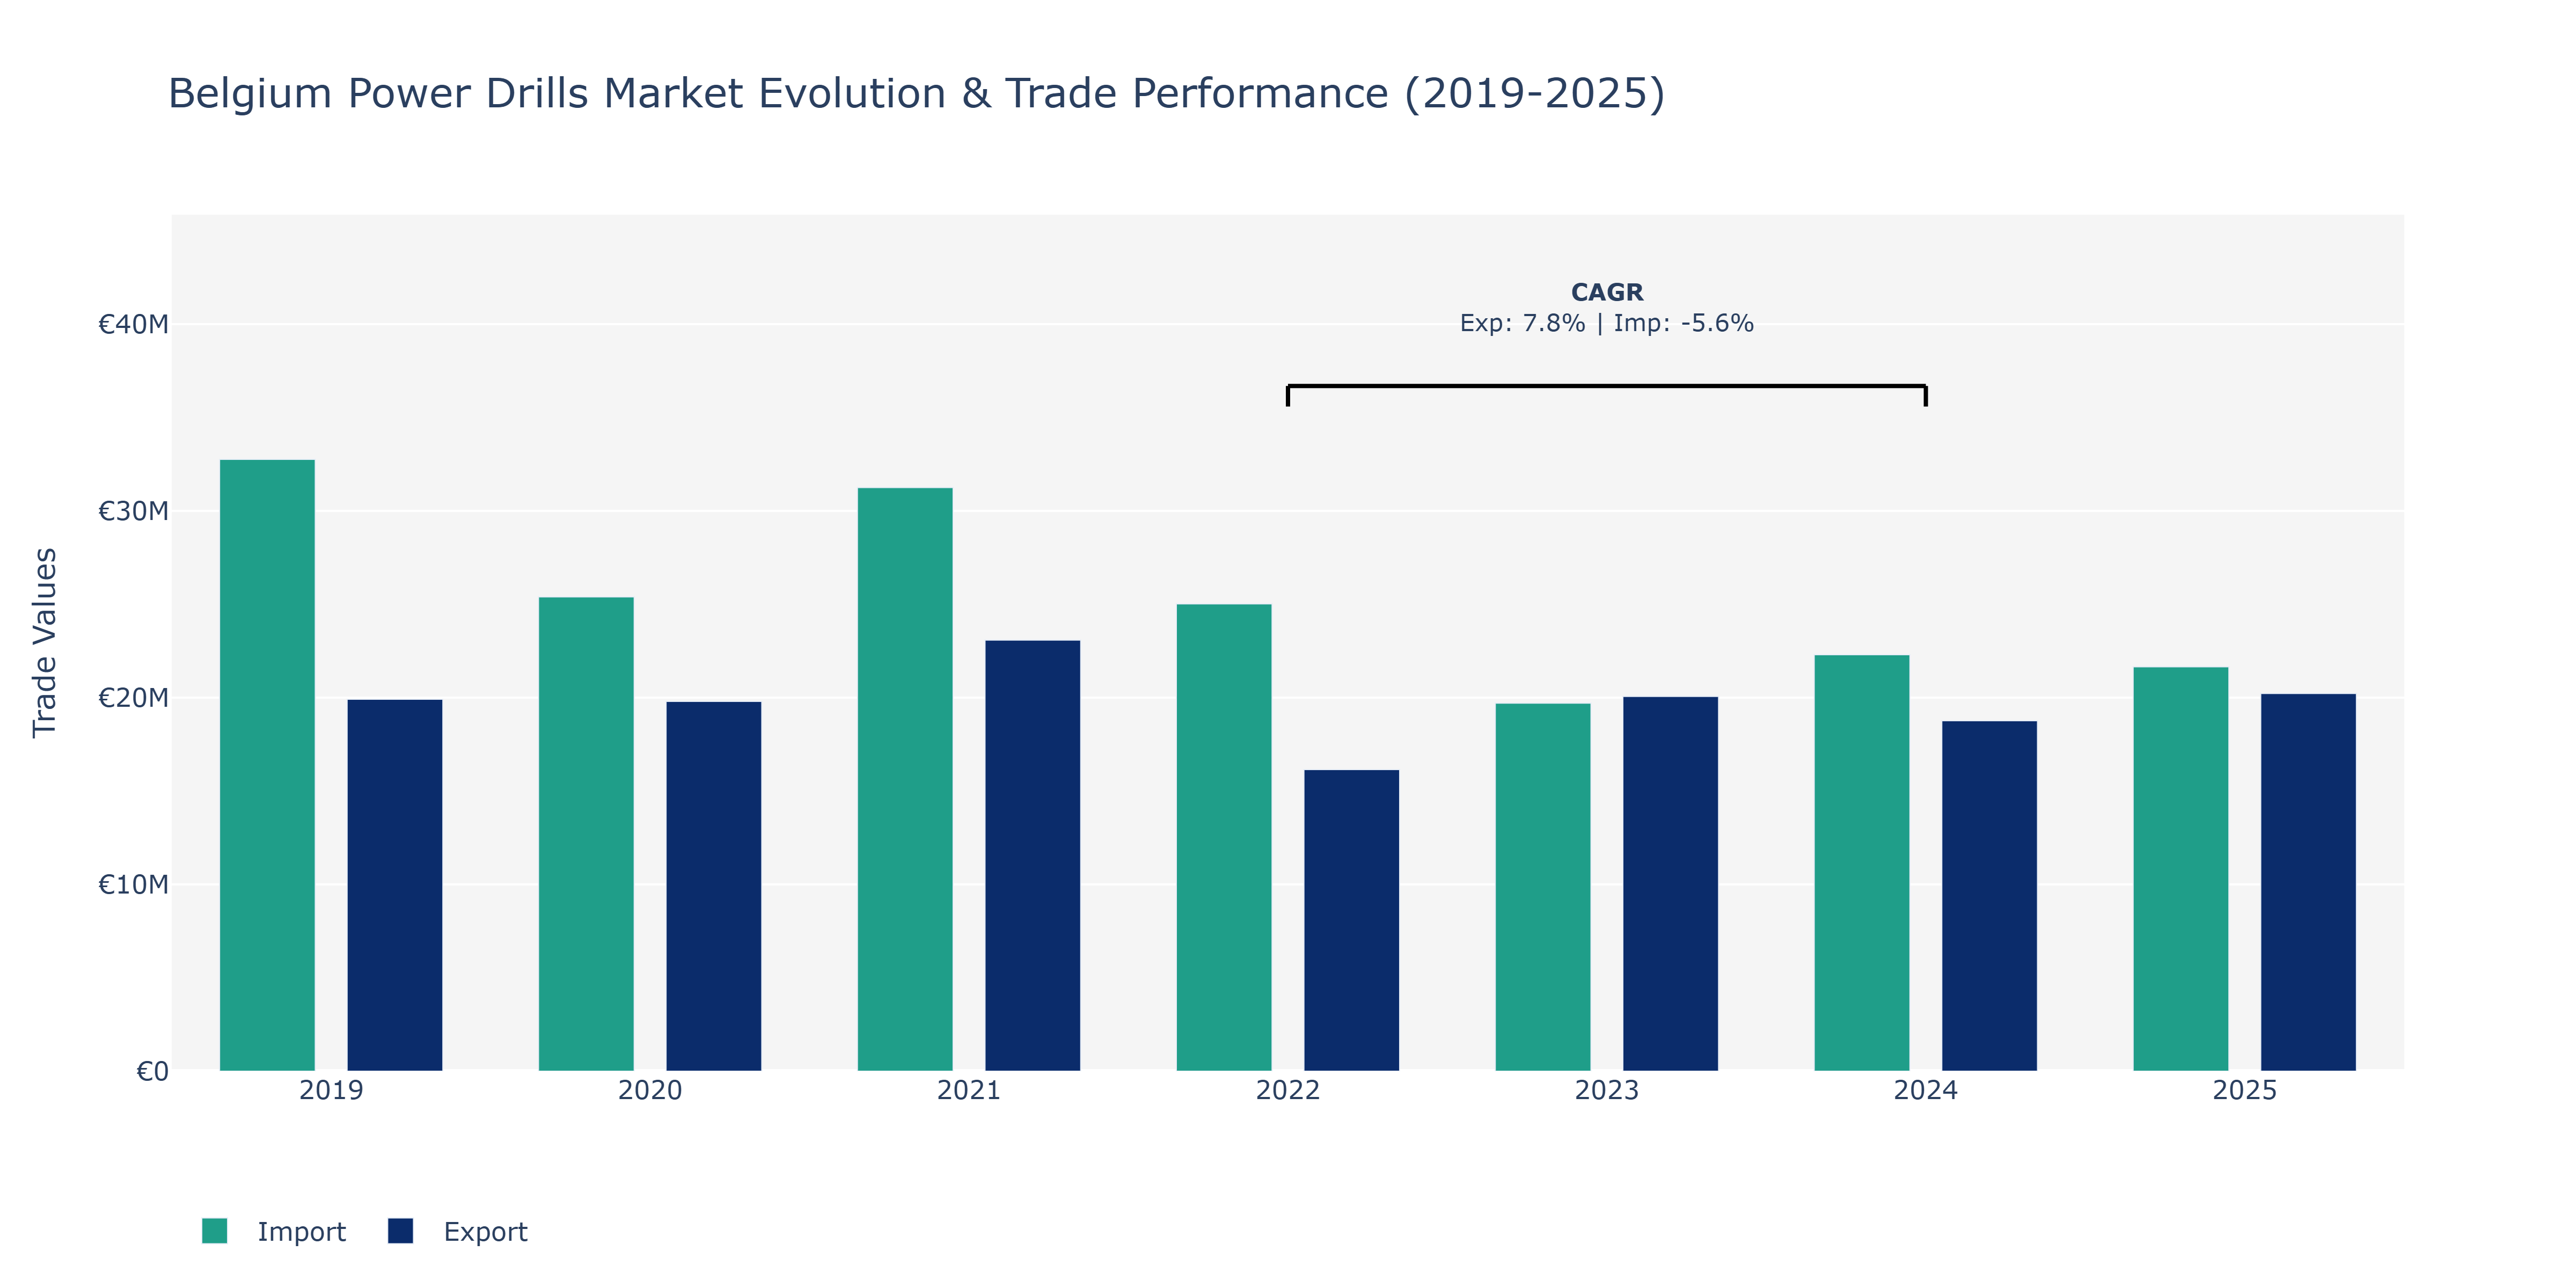
The Belgium Power Drills Market witnessed fluctuations in both Exports and Imports over the analyzed period. In 2019, Imports recorded the highest value at €32.76 million, while Exports peaked in 2021 at €23.08 million. The following years showed varying levels of performance, with 2022 marking a notable decline in both Exports and Imports compared to the previous year. The decrease in Exports in 2022 could be attributed to factors such as changing consumer preferences, global economic conditions, or competitive pressures affecting trade dynamics. Conversely, the decline in Imports during the same year might be linked to regulatory changes, supply chain disruptions, or technological advancements impacting demand for imported power drills. The market exhibited signs of recovery in 2023 and 2024, showing resilience despite challenges. The subsequent years demonstrated a steady performance with slight fluctuations, indicating a stabilized market influenced by factors like technological innovation, market competition, and evolving consumer needs.
Key Highlights of the Report:
- Belgium Power Drills Market Outlook
- Market Size of Belgium Power Drills Market, 2025
- Forecast of Belgium Power Drills Market, 2032
- Historical Data and Forecast of Belgium Power Drills Revenues & Volume for the Period 2022 - 2032F
- Belgium Power Drills Market Trend Evolution
- Belgium Power Drills Market Drivers and Challenges
- Belgium Power Drills Price Trends
- Belgium Power Drills Porter's Five Forces
- Belgium Power Drills Industry Life Cycle
- Historical Data and Forecast of Belgium Power Drills Market Revenues & Volume By Type for the Period 2022 - 2032F
- Historical Data and Forecast of Belgium Power Drills Market Revenues & Volume By Corded for the Period 2022 - 2032F
- Historical Data and Forecast of Belgium Power Drills Market Revenues & Volume By Cordless for the Period 2022 - 2032F
- Historical Data and Forecast of Belgium Power Drills Market Revenues & Volume By Hammer Drill for the Period 2022 - 2032F
- Historical Data and Forecast of Belgium Power Drills Market Revenues & Volume By Impact Drill for the Period 2022 - 2032F
- Historical Data and Forecast of Belgium Power Drills Market Revenues & Volume By Power Source for the Period 2022 - 2032F
- Historical Data and Forecast of Belgium Power Drills Market Revenues & Volume By Electric for the Period 2022 - 2032F
- Historical Data and Forecast of Belgium Power Drills Market Revenues & Volume By Battery for the Period 2022 - 2032F
- Historical Data and Forecast of Belgium Power Drills Market Revenues & Volume By Pneumatic for the Period 2022 - 2032F
- Historical Data and Forecast of Belgium Power Drills Market Revenues & Volume By Hydraulic for the Period 2022 - 2032F
- Historical Data and Forecast of Belgium Power Drills Market Revenues & Volume By Application for the Period 2022 - 2032F
- Historical Data and Forecast of Belgium Power Drills Market Revenues & Volume By Woodworking for the Period 2022 - 2032F
- Historical Data and Forecast of Belgium Power Drills Market Revenues & Volume By Metalworking for the Period 2022 - 2032F
- Historical Data and Forecast of Belgium Power Drills Market Revenues & Volume By Concrete Drilling for the Period 2022 - 2032F
- Historical Data and Forecast of Belgium Power Drills Market Revenues & Volume By DIY for the Period 2022 - 2032F
- Historical Data and Forecast of Belgium Power Drills Market Revenues & Volume By End Use for the Period 2022 - 2032F
- Historical Data and Forecast of Belgium Power Drills Market Revenues & Volume By Industrial for the Period 2022 - 2032F
- Historical Data and Forecast of Belgium Power Drills Market Revenues & Volume By Construction for the Period 2022 - 2032F
- Historical Data and Forecast of Belgium Power Drills Market Revenues & Volume By Automotive for the Period 2022 - 2032F
- Historical Data and Forecast of Belgium Power Drills Market Revenues & Volume By Manufacturing for the Period 2022 - 2032F
- Belgium Power Drills Import Export Trade Statistics
- Market Opportunity Assessment By Type
- Market Opportunity Assessment By Power Source
- Market Opportunity Assessment By Application
- Market Opportunity Assessment By End Use
- Belgium Power Drills Top Companies Market Share
- Belgium Power Drills Competitive Benchmarking By Technical and Operational Parameters
- Belgium Power Drills Company Profiles
- Belgium Power Drills Key Strategic Recommendations
Frequently Asked Questions About the Market Study (FAQs):
6Wresearch actively monitors the Belgium Power Drills Market and publishes its comprehensive annual report, highlighting emerging trends, growth drivers, revenue analysis, and forecast outlook. Our insights help businesses to make data-backed strategic decisions with ongoing market dynamics. Our analysts track relevent industries related to the Belgium Power Drills Market, allowing our clients with actionable intelligence and reliable forecasts tailored to emerging regional needs.
Yes, we provide customisation as per your requirements. To learn more, feel free to contact us on sales@6wresearch.com
1 Executive Summary |
2 Introduction |
2.1 Key Highlights of the Report |
2.2 Report Description |
2.3 Market Scope & Segmentation |
2.4 Research Methodology |
2.5 Assumptions |
3 Belgium Power Drills Market Overview |
3.1 Belgium Country Macro Economic Indicators |
3.2 Belgium Power Drills Market Revenues & Volume, 2022 & 2032F |
3.3 Belgium Power Drills Market - Industry Life Cycle |
3.4 Belgium Power Drills Market - Porter's Five Forces |
3.5 Belgium Power Drills Market Revenues & Volume Share, By Type, 2022 & 2032F |
3.6 Belgium Power Drills Market Revenues & Volume Share, By Power Source, 2022 & 2032F |
3.7 Belgium Power Drills Market Revenues & Volume Share, By Application, 2022 & 2032F |
3.8 Belgium Power Drills Market Revenues & Volume Share, By End Use, 2022 & 2032F |
4 Belgium Power Drills Market Dynamics |
4.1 Impact Analysis |
4.2 Market Drivers |
4.3 Market Restraints |
5 Belgium Power Drills Market Trends |
6 Belgium Power Drills Market, By Types |
6.1 Belgium Power Drills Market, By Type |
6.1.1 Overview and Analysis |
6.1.2 Belgium Power Drills Market Revenues & Volume, By Type, 2022 - 2032F |
6.1.3 Belgium Power Drills Market Revenues & Volume, By Corded, 2022 - 2032F |
6.1.4 Belgium Power Drills Market Revenues & Volume, By Cordless, 2022 - 2032F |
6.1.5 Belgium Power Drills Market Revenues & Volume, By Hammer Drill, 2022 - 2032F |
6.1.6 Belgium Power Drills Market Revenues & Volume, By Impact Drill, 2022 - 2032F |
6.2 Belgium Power Drills Market, By Power Source |
6.2.1 Overview and Analysis |
6.2.2 Belgium Power Drills Market Revenues & Volume, By Electric, 2022 - 2032F |
6.2.3 Belgium Power Drills Market Revenues & Volume, By Battery, 2022 - 2032F |
6.2.4 Belgium Power Drills Market Revenues & Volume, By Pneumatic, 2022 - 2032F |
6.2.5 Belgium Power Drills Market Revenues & Volume, By Hydraulic, 2022 - 2032F |
6.3 Belgium Power Drills Market, By Application |
6.3.1 Overview and Analysis |
6.3.2 Belgium Power Drills Market Revenues & Volume, By Woodworking, 2022 - 2032F |
6.3.3 Belgium Power Drills Market Revenues & Volume, By Metalworking, 2022 - 2032F |
6.3.4 Belgium Power Drills Market Revenues & Volume, By Concrete Drilling, 2022 - 2032F |
6.3.5 Belgium Power Drills Market Revenues & Volume, By DIY, 2022 - 2032F |
6.4 Belgium Power Drills Market, By End Use |
6.4.1 Overview and Analysis |
6.4.2 Belgium Power Drills Market Revenues & Volume, By Industrial, 2022 - 2032F |
6.4.3 Belgium Power Drills Market Revenues & Volume, By Construction, 2022 - 2032F |
6.4.4 Belgium Power Drills Market Revenues & Volume, By Automotive, 2022 - 2032F |
6.4.5 Belgium Power Drills Market Revenues & Volume, By Manufacturing, 2022 - 2032F |
7 Belgium Power Drills Market Import-Export Trade Statistics |
7.1 Belgium Power Drills Market Export to Major Countries |
7.2 Belgium Power Drills Market Imports from Major Countries |
8 Belgium Power Drills Market Key Performance Indicators |
9 Belgium Power Drills Market - Opportunity Assessment |
9.1 Belgium Power Drills Market Opportunity Assessment, By Type, 2022 & 2032F |
9.2 Belgium Power Drills Market Opportunity Assessment, By Power Source, 2022 & 2032F |
9.3 Belgium Power Drills Market Opportunity Assessment, By Application, 2022 & 2032F |
9.4 Belgium Power Drills Market Opportunity Assessment, By End Use, 2022 & 2032F |
10 Belgium Power Drills Market - Competitive Landscape |
10.1 Belgium Power Drills Market Revenue Share, By Companies, 2025 |
10.2 Belgium Power Drills Market Competitive Benchmarking, By Operating and Technical Parameters |
11 Company Profiles |
12 Recommendations |
13 Disclaimer |
Export potential assessment - trade Analytics for 2030
Export potential enables firms to identify high-growth global markets with greater confidence by combining advanced trade intelligence with a structured quantitative methodology. The framework analyzes emerging demand trends and country-level import patterns while integrating macroeconomic and trade datasets such as GDP and population forecasts, bilateral import–export flows, tariff structures, elasticity differentials between developed and developing economies, geographic distance, and import demand projections. Using weighted trade values from 2020–2024 as the base period to project country-to-country export potential for 2030, these inputs are operationalized through calculated drivers such as gravity model parameters, tariff impact factors, and projected GDP per-capita growth. Through an analysis of hidden potentials, demand hotspots, and market conditions that are most favorable to success, this method enables firms to focus on target countries, maximize returns, and global expansion with data, backed by accuracy.
By factoring in the projected importer demand gap that is currently unmet and could be potential opportunity, it identifies the potential for the Exporter (Country) among 190 countries, against the general trade analysis, which identifies the biggest importer or exporter.
To discover high-growth global markets and optimize your business strategy:
Click Here
Pricing
- Single User License$ 1,995
- Department License$ 2,400
- Site License$ 3,120
- Global License$ 3,795

Search
Thought Leadership and Analyst Meet


Our Clients
Latest Reports
- Canada Cloud CFD Market (2026-2032) | Size & Revenue, Industry, Growth, Competitive Landscape, Forecast, Segmentation, Value, Outlook, Trends, Share, Analysis, Companies
- Taiwan Food Delivery Platform Market (2026-2032) | Companies, Outlook, Analysis, Trends, Value, Revenue, Segmentation, Share, Forecast, Competitive Landscape, Growth, Size & Forecast
- United Kingdom (UK) Long-term Care Insurance Market (2026-2032) | Growth, Share, Consumer Insights, Drivers, Opportunities, Competition, Pricing Analysis, Segments, Restraints, Companies, Competitive, Value, Outlook, Size, Demand, Analysis, Challenges, Strategic Insights, Investment Trends, Revenue, Trends, Supply, Forecast
- United Kingdom (UK) Long Term Care Market (2026-2032) | Companies, Outlook, Analysis, Trends, Value, Revenue, Segmentation, Share, Forecast, Competitive Landscape, Growth, Size & Forecast
- Iraq Insulation and Waterproofing Market (2026-2032) | Outlook, Drivers, Growth, Size, Share, Industry, Revenue, Trends, Demand, Competitive, Strategic Insights, Opportunities, Segments, Companies, Challenges, Strategy, Consumer Insights, Analysis, Investment Trends, Value, Segmentation, Forecast, Restraints
- India Switchgear Market Outlook (2026-2032) | Size, Share, Trends, Growth, Revenue, Forecast, Analysis, Value, Outlook
- Pakistan Contraceptive Implants Market (2025-2031) | Demand, Growth, Size, Share, Industry, Pricing Analysis, Competitive, Strategic Insights, Strategy, Consumer Insights, Analysis, Investment Trends, Opportunities, Revenue, Segments, Value, Segmentation, Supply, Forecast, Restraints, Outlook, Competition, Drivers, Trends, Companies, Challenges
- Sri Lanka Packaging Market (2026-2032) | Outlook, Competition, Drivers, Trends, Demand, Pricing Analysis, Competitive, Strategic Insights, Companies, Challenges, Strategy, Consumer Insights, Analysis, Investment Trends, Opportunities, Growth, Size, Share, Industry, Revenue, Segments, Value, Segmentation, Supply, Forecast, Restraints
- India Kids Watches Market (2026-2032) | Strategy, Consumer Insights, Analysis, Investment Trends, Opportunities, Growth, Size, Share, Industry, Revenue, Segments, Value, Segmentation, Supply, Forecast, Restraints, Outlook, Competition, Drivers, Trends, Demand, Pricing Analysis, Competitive, Strategic Insights, Companies, Challenges
- Saudi Arabia Core Assurance Service Market (2025-2031) | Strategy, Consumer Insights, Analysis, Investment Trends, Opportunities, Growth, Size, Share, Industry, Revenue, Segments, Value, Segmentation, Supply, Forecast, Restraints, Outlook, Competition, Drivers, Trends, Demand, Pricing Analysis, Competitive, Strategic Insights, Companies, Challenges
Industry Events and Analyst Meet

India EV Show 2026

EV tech India Expo 2026

Auto Tech Asia 2026

Battery Tech India 2026

Smart Production Solutions Guangzhou 2026
Whitepaper
- Middle East & Africa Commercial Security Market Click here to view more.
- Middle East & Africa Fire Safety Systems & Equipment Market Click here to view more.
- GCC Drone Market Click here to view more.
- Middle East Lighting Fixture Market Click here to view more.
- GCC Physical & Perimeter Security Market Click here to view more.
6WResearch In News
- Doha a strategic location for EV manufacturing hub: IPA Qatar
- Demand for luxury TVs surging in the GCC, says Samsung
- Empowering Growth: The Thriving Journey of Bangladesh’s Cable Industry
- Demand for luxury TVs surging in the GCC, says Samsung
- Video call with a traditional healer? Once unthinkable, it’s now common in South Africa
- Intelligent Buildings To Smooth GCC’s Path To Net Zero