Belgium Rubber Stamps Market (2026-2032) | Trends, Size, Revenue, Companies, Value, Outlook, Analysis, Forecast, Industry, Growth, Share & Segmentation
Market Forecast By Product (Custom Rubber Stamps, Common Rubber Stamps), By Application (Household, Commercial, Others) And Competitive Landscape
| Product Code: ETC5103878 | Publication Date: Nov 2023 | Updated Date: Apr 2026 | Product Type: Market Research Report | |
| Publisher: 6Wresearch | Author: Shubham Padhi | No. of Pages: 60 | No. of Figures: 30 | No. of Tables: 5 |
Belgium Rubber Stamps Market Size (2020-2030)
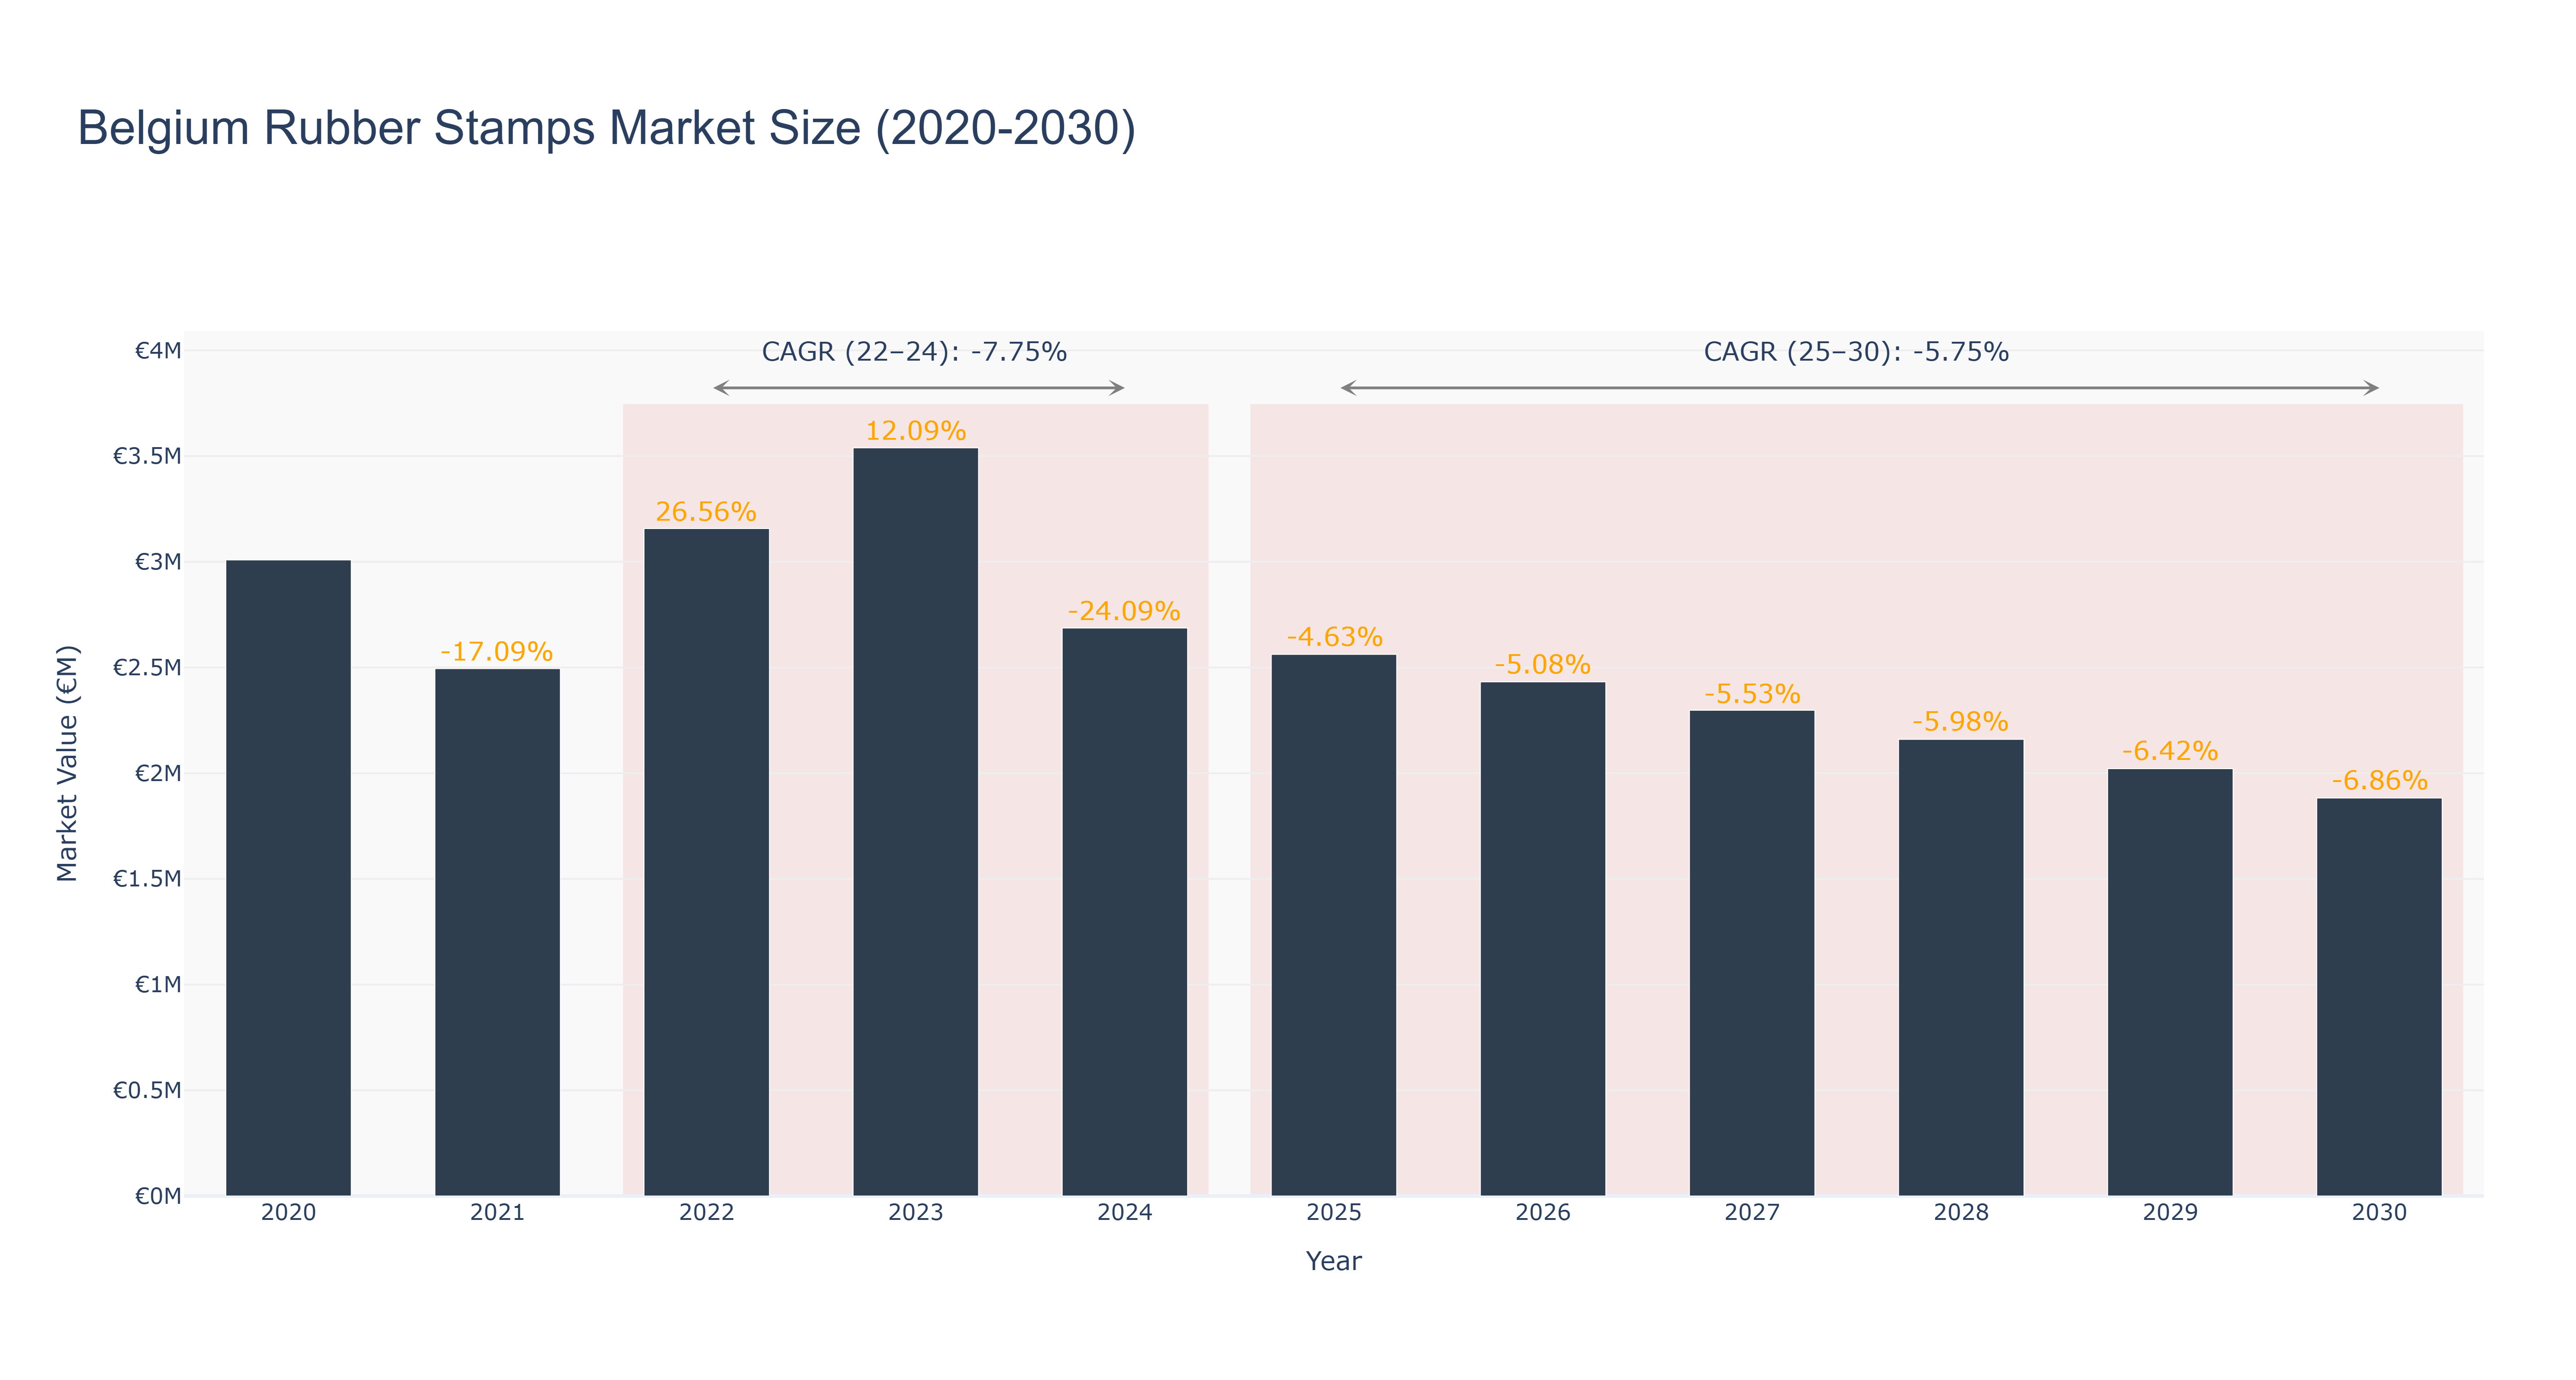
Belgium Rubber Stamps Market has seen fluctuations in market size over the years. The peak market size of €3.54 million was reached in 2023, followed by a decline to €2.69 million in 2024. Forecasted market size shows a downward trend from €2.56 million in 2025 to €1.88 million in 2030. The CAGR for the period 2022-24 stands at -7.75%, while for 2025-30 it is -5.75%. The market's decline can be attributed to factors such as economic uncertainties affecting consumer spending and technological advancements leading to digital alternatives. Moving forward, the Belgium Rubber Stamps Market is expected to focus on diversifying product offerings and enhancing online presence to cater to changing consumer preferences. Additionally, upcoming collaborations with local artists for exclusive stamp designs are anticipated to drive market growth in the near future.
Belgium Rubber Stamps Market: Production & Trade Performance (2019-2025)
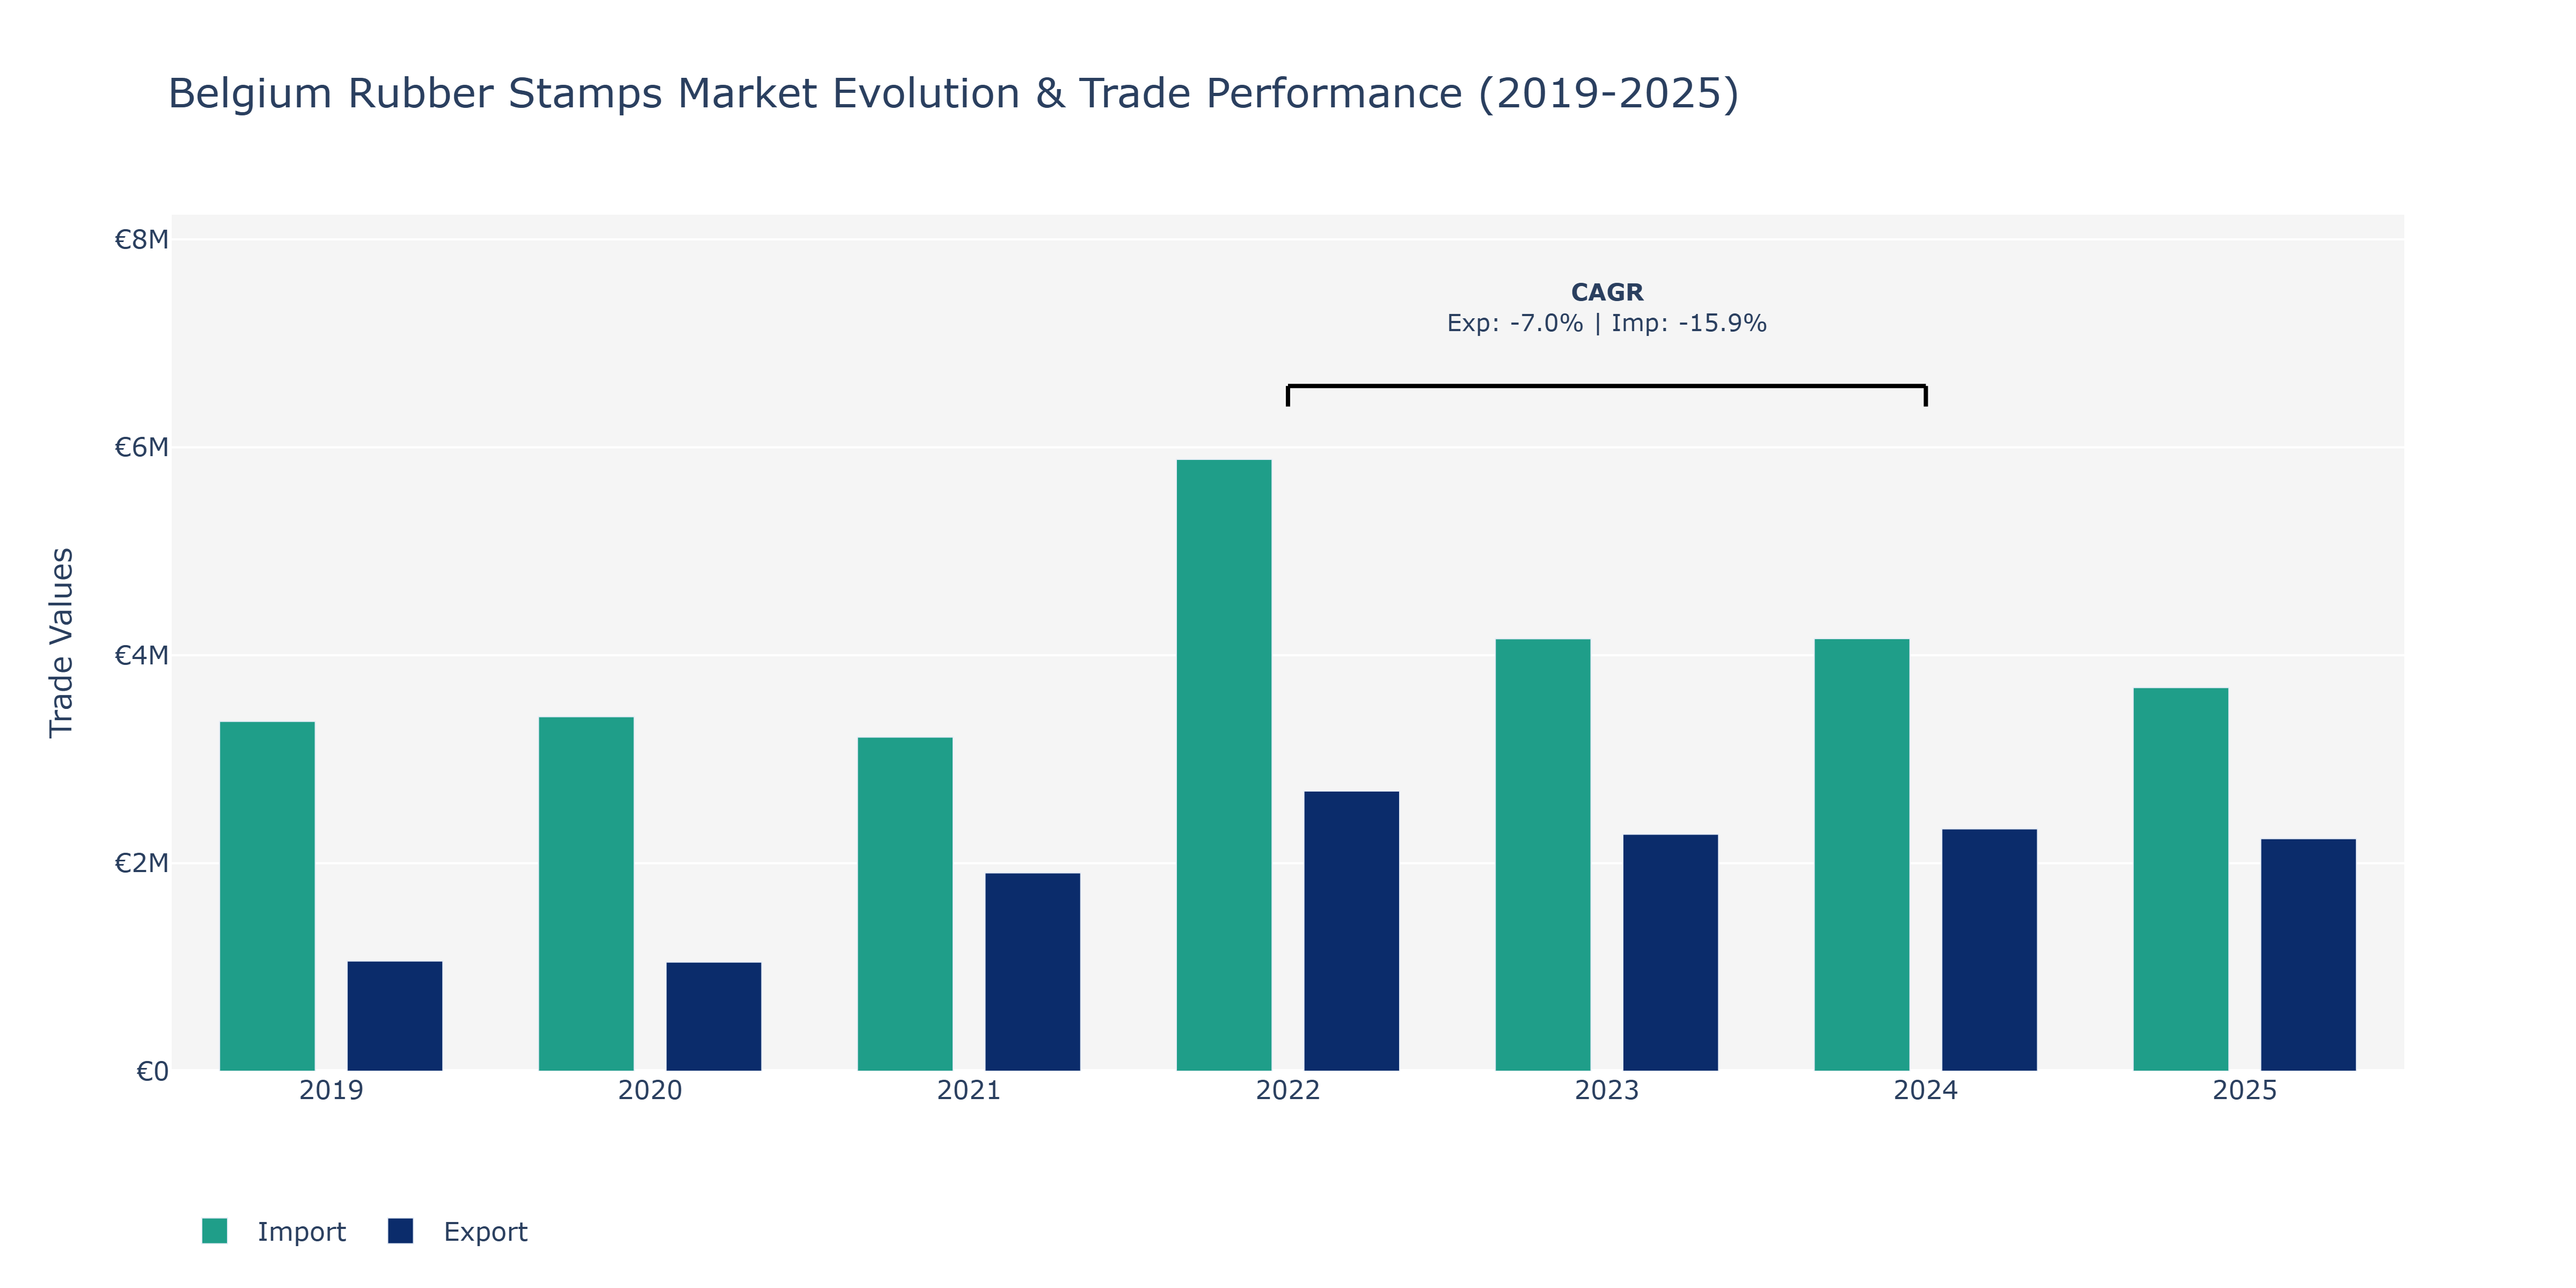
In the Belgium Rubber Stamps Market, from 2019 to 2025, both exports and imports exhibited fluctuations. In 2021, exports surged to €1.91 million, marking a noticeable increase from the previous year. However, by 2025, exports had decreased to around €2.24 million. Imports, on the other hand, experienced a peak in 2022 at €5.88 million, followed by a slight decline in the subsequent years. The decline in imports from 2022 to 2025 could be attributed to various factors such as changing consumer preferences, fluctuations in raw material prices, or shifts in global trade dynamics impacting the rubber stamps industry. Despite the fluctuations, the market maintained a relatively stable performance, showcasing resilience in the face of changing market conditions. This trend aligns with broader industry reports indicating a dynamic market adapting to evolving consumer demands and economic landscapes.
Key Highlights of the Report:
- Belgium Rubber Stamps Market Outlook
- Market Size of Belgium Rubber Stamps Market, 2025
- Forecast of Belgium Rubber Stamps Market, 2032
- Historical Data and Forecast of Belgium Rubber Stamps Revenues & Volume for the Period 2022 - 2032F
- Belgium Rubber Stamps Market Trend Evolution
- Belgium Rubber Stamps Market Drivers and Challenges
- Belgium Rubber Stamps Price Trends
- Belgium Rubber Stamps Porter`s Five Forces
- Belgium Rubber Stamps Industry Life Cycle
- Historical Data and Forecast of Belgium Rubber Stamps Market Revenues & Volume By Product for the Period 2022 - 2032F
- Historical Data and Forecast of Belgium Rubber Stamps Market Revenues & Volume By Custom Rubber Stamps for the Period 2022 - 2032F
- Historical Data and Forecast of Belgium Rubber Stamps Market Revenues & Volume By Common Rubber Stamps for the Period 2022 - 2032F
- Historical Data and Forecast of Belgium Rubber Stamps Market Revenues & Volume By Application for the Period 2022 - 2032F
- Historical Data and Forecast of Belgium Rubber Stamps Market Revenues & Volume By Household for the Period 2022 - 2032F
- Historical Data and Forecast of Belgium Rubber Stamps Market Revenues & Volume By Commercial for the Period 2022 - 2032F
- Historical Data and Forecast of Belgium Rubber Stamps Market Revenues & Volume By Others for the Period 2022 - 2032F
- Belgium Rubber Stamps Import Export Trade Statistics
- Market Opportunity Assessment By Product
- Market Opportunity Assessment By Application
- Belgium Rubber Stamps Top Companies Market Share
- Belgium Rubber Stamps Competitive Benchmarking By Technical and Operational Parameters
- Belgium Rubber Stamps Company Profiles
- Belgium Rubber Stamps Key Strategic Recommendations
Frequently Asked Questions About the Market Study (FAQs):
6Wresearch actively monitors the Belgium Rubber Stamps Market and publishes its comprehensive annual report, highlighting emerging trends, growth drivers, revenue analysis, and forecast outlook. Our insights help businesses to make data-backed strategic decisions with ongoing market dynamics. Our analysts track relevent industries related to the Belgium Rubber Stamps Market, allowing our clients with actionable intelligence and reliable forecasts tailored to emerging regional needs.
Yes, we provide customisation as per your requirements. To learn more, feel free to contact us on sales@6wresearch.com
1 Executive Summary |
2 Introduction |
2.1 Key Highlights of the Report |
2.2 Report Description |
2.3 Market Scope & Segmentation |
2.4 Research Methodology |
2.5 Assumptions |
3 Belgium Rubber Stamps Market Overview |
3.1 Belgium Country Macro Economic Indicators |
3.2 Belgium Rubber Stamps Market Revenues & Volume, 2022 & 2032F |
3.3 Belgium Rubber Stamps Market - Industry Life Cycle |
3.4 Belgium Rubber Stamps Market - Porter's Five Forces |
3.5 Belgium Rubber Stamps Market Revenues & Volume Share, By Product, 2022 & 2032F |
3.6 Belgium Rubber Stamps Market Revenues & Volume Share, By Application, 2022 & 2032F |
4 Belgium Rubber Stamps Market Dynamics |
4.1 Impact Analysis |
4.2 Market Drivers |
4.2.1 Increasing demand for personalized and customized products |
4.2.2 Growing trend of DIY and crafting activities |
4.2.3 Adoption of rubber stamps in various industries for branding and marketing purposes |
4.3 Market Restraints |
4.3.1 Presence of digital alternatives affecting traditional rubber stamp usage |
4.3.2 Fluctuating raw material prices impacting production costs |
4.3.3 Intense competition from online and offline sellers |
5 Belgium Rubber Stamps Market Trends |
6 Belgium Rubber Stamps Market Segmentations |
6.1 Belgium Rubber Stamps Market, By Product |
6.1.1 Overview and Analysis |
6.1.2 Belgium Rubber Stamps Market Revenues & Volume, By Custom Rubber Stamps, 2022 - 2032F |
6.1.3 Belgium Rubber Stamps Market Revenues & Volume, By Common Rubber Stamps, 2022 - 2032F |
6.2 Belgium Rubber Stamps Market, By Application |
6.2.1 Overview and Analysis |
6.2.2 Belgium Rubber Stamps Market Revenues & Volume, By Household, 2022 - 2032F |
6.2.3 Belgium Rubber Stamps Market Revenues & Volume, By Commercial, 2022 - 2032F |
6.2.4 Belgium Rubber Stamps Market Revenues & Volume, By Others, 2022 - 2032F |
7 Belgium Rubber Stamps Market Import-Export Trade Statistics |
7.1 Belgium Rubber Stamps Market Export to Major Countries |
7.2 Belgium Rubber Stamps Market Imports from Major Countries |
8 Belgium Rubber Stamps Market Key Performance Indicators |
8.1 Average order value per customer |
8.2 Website traffic and engagement metrics |
8.3 Customer retention rate |
8.4 Number of new product launches |
8.5 Percentage of repeat customers |
9 Belgium Rubber Stamps Market - Opportunity Assessment |
9.1 Belgium Rubber Stamps Market Opportunity Assessment, By Product, 2022 & 2032F |
9.2 Belgium Rubber Stamps Market Opportunity Assessment, By Application, 2022 & 2032F |
10 Belgium Rubber Stamps Market - Competitive Landscape |
10.1 Belgium Rubber Stamps Market Revenue Share, By Companies, 2025 |
10.2 Belgium Rubber Stamps Market Competitive Benchmarking, By Operating and Technical Parameters |
11 Company Profiles |
12 Recommendations | 13 Disclaimer |
Export potential assessment - trade Analytics for 2030
Export potential enables firms to identify high-growth global markets with greater confidence by combining advanced trade intelligence with a structured quantitative methodology. The framework analyzes emerging demand trends and country-level import patterns while integrating macroeconomic and trade datasets such as GDP and population forecasts, bilateral import–export flows, tariff structures, elasticity differentials between developed and developing economies, geographic distance, and import demand projections. Using weighted trade values from 2020–2024 as the base period to project country-to-country export potential for 2030, these inputs are operationalized through calculated drivers such as gravity model parameters, tariff impact factors, and projected GDP per-capita growth. Through an analysis of hidden potentials, demand hotspots, and market conditions that are most favorable to success, this method enables firms to focus on target countries, maximize returns, and global expansion with data, backed by accuracy.
By factoring in the projected importer demand gap that is currently unmet and could be potential opportunity, it identifies the potential for the Exporter (Country) among 190 countries, against the general trade analysis, which identifies the biggest importer or exporter.
To discover high-growth global markets and optimize your business strategy:
Click Here
Pricing
- Single User License$ 1,995
- Department License$ 2,400
- Site License$ 3,120
- Global License$ 3,795

Search
Thought Leadership and Analyst Meet


Our Clients
Latest Reports
- India Ultrasonic Smart Water Meter Market (2026-2032) | Outlook, Competition, Drivers, Trends, Demand, Competitive, Strategic Insights, Companies, Challenges, Strategy, Consumer Insights, Analysis, Opportunities, Growth, Size, Share, Industry, Revenue, Segments, Value, Segmentation, Supply, Forecast, Restraints,
- India Electromagnetic Bulk Flow Meter Market (2026-2032) | Analysis, Challenges, Strategic Insights, Supply, Forecast, Growth, Share, Consumer Insights, Competitive, Value, Outlook, Size & Demand,
- India Battery Powered Bulk Flow Meter Market (2026-2032) | Outlook, Analysis, Competitive Landscape, Growth, Size, Trends, Value, Revenue, Companies, Segmentation, Share & Forecast
- Bosnia and Herzegovina Fuel-Efficient Winglets Market (2026-2032) | Growth, Competition, Strategy, Restraints, Trends, Challenges, segmentation, Value, Outlook, Investment Opportunities, Analysis, Revenue, Companies, Insights, Pricing, Size, Drivers, Demand, Share, Forecast
- Canada Cloud CFD Market (2026-2032) | Size & Revenue, Industry, Growth, Competitive Landscape, Forecast, Segmentation, Value, Outlook, Trends, Share, Analysis, Companies
- Taiwan Food Delivery Platform Market (2026-2032) | Companies, Outlook, Analysis, Trends, Value, Revenue, Segmentation, Share, Forecast, Competitive Landscape, Growth, Size & Forecast
- United Kingdom (UK) Long-term Care Insurance Market (2026-2032) | Growth, Share, Consumer Insights, Drivers, Opportunities, Competition, Pricing Analysis, Segments, Restraints, Companies, Competitive, Value, Outlook, Size, Demand, Analysis, Challenges, Strategic Insights, Investment Trends, Revenue, Trends, Supply, Forecast
- United Kingdom (UK) Long Term Care Market (2026-2032) | Companies, Outlook, Analysis, Trends, Value, Revenue, Segmentation, Share, Forecast, Competitive Landscape, Growth, Size & Forecast
- Iraq Insulation and Waterproofing Market (2026-2032) | Outlook, Drivers, Growth, Size, Share, Industry, Revenue, Trends, Demand, Competitive, Strategic Insights, Opportunities, Segments, Companies, Challenges, Strategy, Consumer Insights, Analysis, Investment Trends, Value, Segmentation, Forecast, Restraints
- India Switchgear Market Outlook (2026-2032) | Size, Share, Trends, Growth, Revenue, Forecast, Analysis, Value, Outlook
Industry Events and Analyst Meet

India EV Show 2026

EV tech India Expo 2026

Auto Tech Asia 2026

Battery Tech India 2026

Smart Production Solutions Guangzhou 2026
Whitepaper
- Middle East & Africa Commercial Security Market Click here to view more.
- Middle East & Africa Fire Safety Systems & Equipment Market Click here to view more.
- GCC Drone Market Click here to view more.
- Middle East Lighting Fixture Market Click here to view more.
- GCC Physical & Perimeter Security Market Click here to view more.
6WResearch In News
- Doha a strategic location for EV manufacturing hub: IPA Qatar
- Demand for luxury TVs surging in the GCC, says Samsung
- Empowering Growth: The Thriving Journey of Bangladesh’s Cable Industry
- Demand for luxury TVs surging in the GCC, says Samsung
- Video call with a traditional healer? Once unthinkable, it’s now common in South Africa
- Intelligent Buildings To Smooth GCC’s Path To Net Zero