Botswana Copper Scrap Market (2026-2032) | Analysis, Size, Outlook, Trends, Revenue, Segmentation, Share, Companies, Forecast, Industry, Growth & Value
Market Forecast By Application (Wire Rod Mills, Brass Mills, Ingot Makers, Foundries and Other Industries) And Competitive Landscape
| Product Code: ETC5145380 | Publication Date: Nov 2023 | Updated Date: Mar 2026 | Product Type: Market Research Report | |
| Publisher: 6Wresearch | Author: Bhawna Singh | No. of Pages: 60 | No. of Figures: 30 | No. of Tables: 5 |
Botswana Copper Scrap Market Competition 2023
Botswana Copper Scrap market currently, in 2023, has witnessed an HHI of 9977, Which has increased slightly as compared to the HHI of 9760 in 2017. The market is moving towards Highly concentrated. Herfindahl index measures the competitiveness of exporting countries. The range lies from 0 to 10000, where a lower index number represents a larger number of players or exporting countries in the market while a large index number means fewer numbers of players or countries exporting in the market.
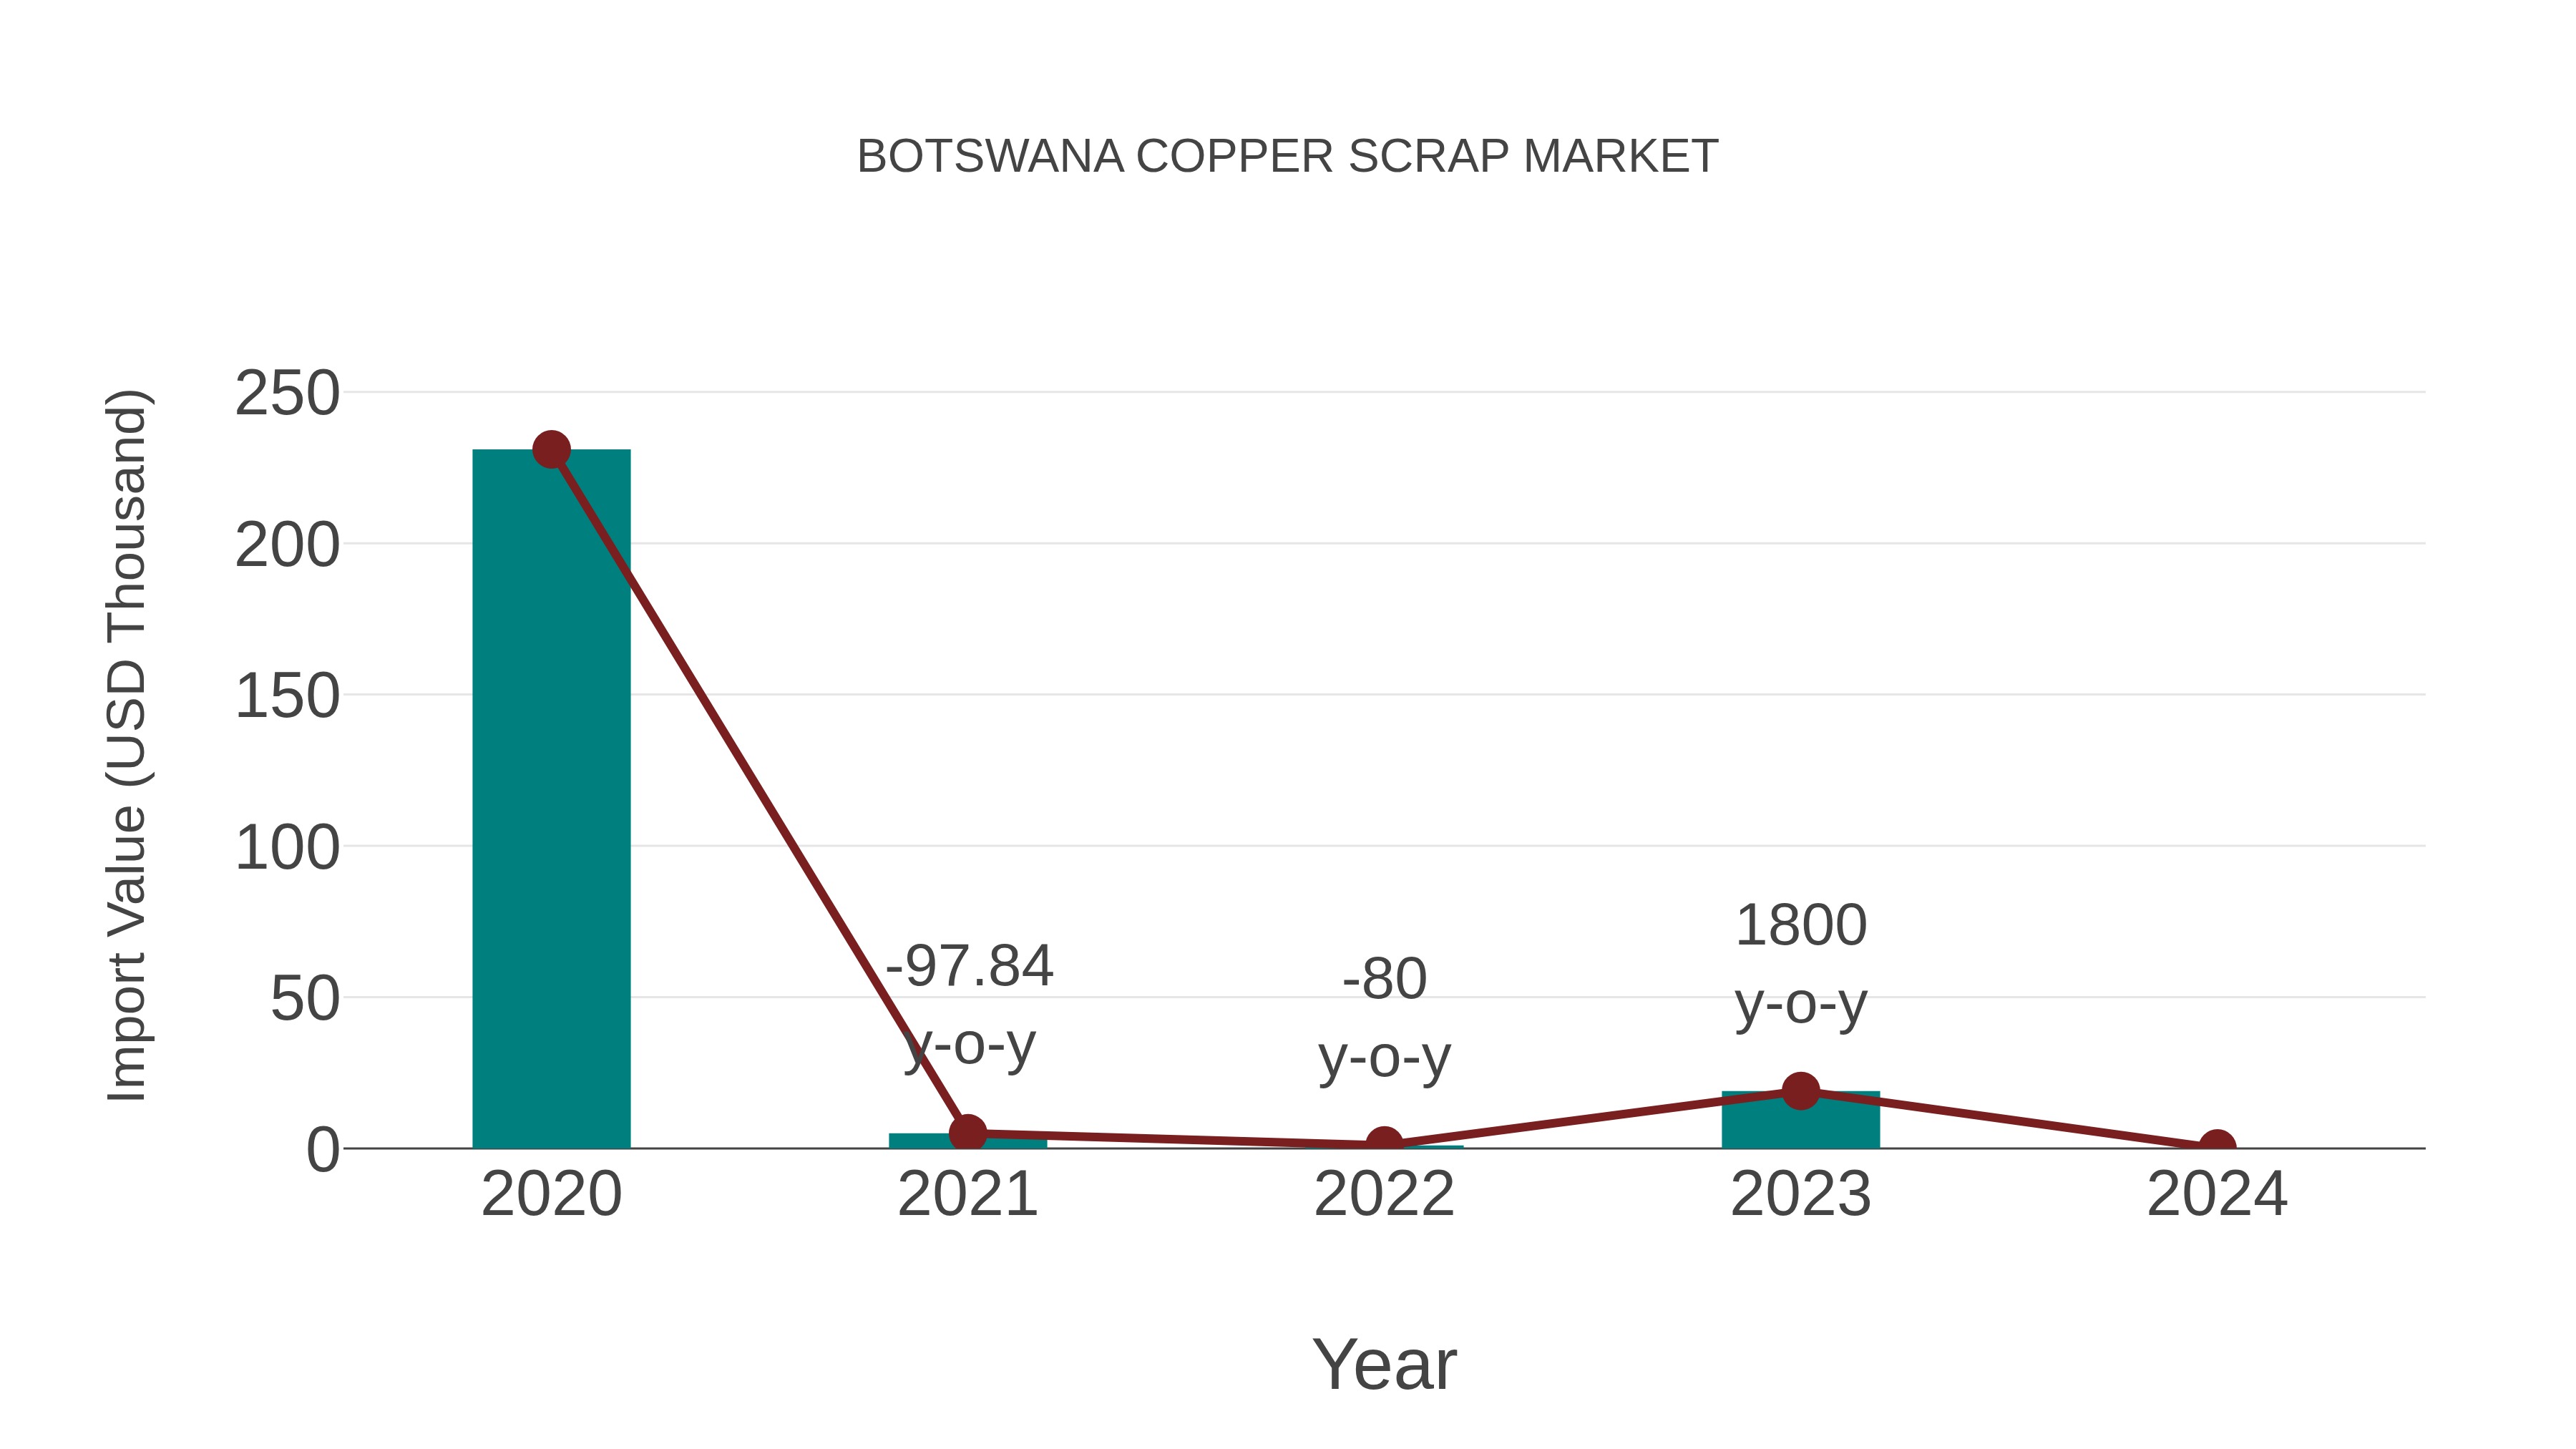
Botswana Export Potential Assessment For Copper Scrap Market (Values in USD Thousand)
Botswana Copper Scrap Market Overview
Botswanas copper scrap market is expanding as the demand for recycled copper materials increases. Copper scrap is collected from various sources, such as electrical cables and industrial equipment, and processed for reuse in manufacturing. Market growth is driven by the need for sustainable material sourcing and rising environmental awareness. Innovations in recycling technologies and processes are supporting the development of this market.
Drivers of the market
The copper scrap market in Botswana is expanding as the recycling of copper scrap provides an essential supply of raw material for various industries. Copper scrap is valued for its economic and environmental benefits, as recycling reduces the need for virgin copper mining and lowers production costs. The market growth is driven by the increasing emphasis on recycling and sustainability, fluctuations in copper prices, and the expansion of the construction and electronics sectors. Innovations in recycling technologies and the rise of circular economy practices support the growth of the copper scrap market.
Challenges of the market
Botswana`s copper scrap market encounters challenges related to high import costs and limited local recycling infrastructure. The market is constrained by limited demand from the local recycling and manufacturing sectors and competition from alternative scrap materials. Additionally, slower adoption rates and fluctuations in global copper prices impact market growth. The lack of local recycling facilities and distribution networks further affects market development.
Government Policy of the market
Government policies in Botswana encourage the recycling of copper scrap to promote environmental sustainability and resource efficiency. Regulations mandating proper scrap collection and processing, coupled with incentives for recycling businesses, influence the market landscape.
Key Highlights of the Report:
- Botswana Copper Scrap Market Outlook
- Market Size of Botswana Copper Scrap Market, 2025
- Forecast of Botswana Copper Scrap Market, 2032
- Historical Data and Forecast of Botswana Copper Scrap Revenues & Volume for the Period 2022-2032F
- Botswana Copper Scrap Market Trend Evolution
- Botswana Copper Scrap Market Drivers and Challenges
- Botswana Copper Scrap Price Trends
- Botswana Copper Scrap Porter`s Five Forces
- Botswana Copper Scrap Industry Life Cycle
- Historical Data and Forecast of Botswana Copper Scrap Market Revenues & Volume By Application for the Period 2022-2032F
- Historical Data and Forecast of Botswana Copper Scrap Market Revenues & Volume By Wire Rod Mills for the Period 2022-2032F
- Historical Data and Forecast of Botswana Copper Scrap Market Revenues & Volume By Brass Mills for the Period 2022-2032F
- Historical Data and Forecast of Botswana Copper Scrap Market Revenues & Volume By Ingot Makers for the Period 2022-2032F
- Historical Data and Forecast of Botswana Copper Scrap Market Revenues & Volume By Foundries and Other Industries for the Period 2022-2032F
- Botswana Copper Scrap Import Export Trade Statistics
- Market Opportunity Assessment By Application
- Botswana Copper Scrap Top Companies Market Share
- Botswana Copper Scrap Competitive Benchmarking By Technical and Operational Parameters
- Botswana Copper Scrap Company Profiles
- Botswana Copper Scrap Key Strategic Recommendations
Botswana Copper Scrap Market (2026-2032): FAQs
6Wresearch actively monitors the Botswana Copper Scrap Market and publishes its comprehensive annual report, highlighting emerging trends, growth drivers, revenue analysis, and forecast outlook. Our insights help businesses to make data-backed strategic decisions with ongoing market dynamics. Our analysts track relevent industries related to the Botswana Copper Scrap Market, allowing our clients with actionable intelligence and reliable forecasts tailored to emerging regional needs.
Yes, we provide customisation as per your requirements. To learn more, feel free to contact us on sales@6wresearch.com
1 Executive Summary |
2 Introduction |
2.1 Key Highlights of the Report |
2.2 Report Description |
2.3 Market Scope & Segmentation |
2.4 Research Methodology |
2.5 Assumptions |
3 Botswana Copper Scrap Market Overview |
3.1 Botswana Country Macro Economic Indicators |
3.2 Botswana Copper Scrap Market Revenues & Volume, 2022 & 2032F |
3.3 Botswana Copper Scrap Market - Industry Life Cycle |
3.4 Botswana Copper Scrap Market - Porter's Five Forces |
3.5 Botswana Copper Scrap Market Revenues & Volume Share, By Application, 2022 & 2032F |
4 Botswana Copper Scrap Market Dynamics |
4.1 Impact Analysis |
4.2 Market Drivers |
4.2.1 Increasing demand for copper in various industries such as construction, electronics, and automotive. |
4.2.2 Rise in recycling initiatives and environmental regulations promoting the use of copper scrap. |
4.2.3 Growing investments in infrastructure projects driving the demand for copper scrap. |
4.3 Market Restraints |
4.3.1 Fluctuating global copper prices impacting the profitability of copper scrap market in Botswana. |
4.3.2 Challenges in collection and sorting of copper scrap leading to supply chain disruptions. |
4.3.3 Competition from other materials such as aluminum and steel affecting the market share of copper scrap. |
5 Botswana Copper Scrap Market Trends |
6 Botswana Copper Scrap Market Segmentations |
6.1 Botswana Copper Scrap Market, By Application |
6.1.1 Overview and Analysis |
6.1.2 Botswana Copper Scrap Market Revenues & Volume, By Wire Rod Mills, 2022-2032F |
6.1.3 Botswana Copper Scrap Market Revenues & Volume, By Brass Mills, 2022-2032F |
6.1.4 Botswana Copper Scrap Market Revenues & Volume, By Ingot Makers, 2022-2032F |
6.1.5 Botswana Copper Scrap Market Revenues & Volume, By Foundries and Other Industries, 2022-2032F |
7 Botswana Copper Scrap Market Import-Export Trade Statistics |
7.1 Botswana Copper Scrap Market Export to Major Countries |
7.2 Botswana Copper Scrap Market Imports from Major Countries |
8 Botswana Copper Scrap Market Key Performance Indicators |
8.1 Average selling price of copper scrap in the Botswana market. |
8.2 Volume of copper scrap collected and recycled annually. |
8.3 Percentage of copper scrap reused in domestic manufacturing processes. |
8.4 Number of new entrants or players in the Botswana copper scrap market. |
8.5 Rate of adoption of advanced technologies for processing copper scrap. |
9 Botswana Copper Scrap Market - Opportunity Assessment |
9.1 Botswana Copper Scrap Market Opportunity Assessment, By Application, 2022 & 2032F |
10 Botswana Copper Scrap Market - Competitive Landscape |
10.1 Botswana Copper Scrap Market Revenue Share, By Companies, 2025 |
10.2 Botswana Copper Scrap Market Competitive Benchmarking, By Operating and Technical Parameters |
11 Company Profiles |
12 Recommendations | 13 Disclaimer |
Global Go To Market Strategy - 2030
Export potential enables firms to identify high-growth global markets with greater confidence by combining advanced trade intelligence with a structured quantitative methodology. The framework analyzes emerging demand trends and country-level import patterns while integrating macroeconomic and trade datasets such as GDP and population forecasts, bilateral import–export flows, tariff structures, elasticity differentials between developed and developing economies, geographic distance, and import demand projections. Using weighted trade values from 2020–2024 as the base period to project country-to-country export potential for 2030, these inputs are operationalized through calculated drivers such as gravity model parameters, tariff impact factors, and projected GDP per-capita growth. Through an analysis of hidden potentials, demand hotspots, and market conditions that are most favorable to success, this method enables firms to focus on target countries, maximize returns, and global expansion with data, backed by accuracy.
By factoring in the projected importer demand gap that is currently unmet and could be potential opportunity, it identifies the potential for the Exporter (Country) among 190 countries, against the general trade analysis, which identifies the biggest importer or exporter.
To discover high-growth global markets and optimize your business strategy:
Click Here
Pricing
- Single User License$ 1,995
- Department License$ 2,400
- Site License$ 3,120
- Global License$ 3,795

Leadership Perspectives from Industry Events
Search
Thought Leadership and Analyst Meet


Our Clients
6WResearch In News
- Doha a strategic location for EV manufacturing hub: IPA Qatar
- Demand for luxury TVs surging in the GCC, says Samsung
- Empowering Growth: The Thriving Journey of Bangladesh’s Cable Industry
- Demand for luxury TVs surging in the GCC, says Samsung
- Video call with a traditional healer? Once unthinkable, it’s now common in South Africa
- Intelligent Buildings To Smooth GCC’s Path To Net Zero
Latest Reports
- Taiwan Airport Wireless Infrastructure Market (2026-2032)
- Vietnam Airport Wireless Infrastructure Market (2026-2032)
- Thailand Airport Wireless Infrastructure Market (2026-2032)
- South Korea Airport Wireless Infrastructure Market (2026-2032)
- Romania Airport Wireless Infrastructure Market (2026-2032)
- Qatar Airport Wireless Infrastructure Market (2026-2032)
- Philippines Airport Wireless Infrastructure Market (2026-2032)
- Japan Airport Wireless Infrastructure Market (2026-2032)
- Taiwan Airport Winter Services Market (2026-2032)
- Vietnam Airport Winter Services Market (2026-2032)
Industry Events and Analyst Meet

HIMTEX 2026

India Refining Summit 2026

India EV Show 2026

EV tech India Expo 2026

Auto Tech Asia 2026
Whitepaper
- Middle East & Africa Commercial Security Market Click here to view more.
- Middle East & Africa Fire Safety Systems & Equipment Market Click here to view more.
- GCC Drone Market Click here to view more.
- Middle East Lighting Fixture Market Click here to view more.
- GCC Physical & Perimeter Security Market Click here to view more.