Botswana Interactive Kiosk Market (2026-2032) | Companies, Industry, Value, Share, Analysis, Outlook, Growth, Trends, Size, Forecast, Revenue & Segmentation
Market Forecast By Offering (Hardware , Software & Services), By Type (Bank Kiosks, Self-services Kiosks, Information Kiosks, Ticketing Kiosks, Photo Kiosks, Patient Interactive Kiosk, Check-in Kiosk, Employment Kiosk), By Location (Indoor , Outdoor), By Panel Size (17‚
| Product Code: ETC5573754 | Publication Date: Nov 2023 | Updated Date: Mar 2026 | Product Type: Market Research Report | |
| Publisher: 6Wresearch | Author: Vasudha | No. of Pages: 60 | No. of Figures: 30 | No. of Tables: 5 |
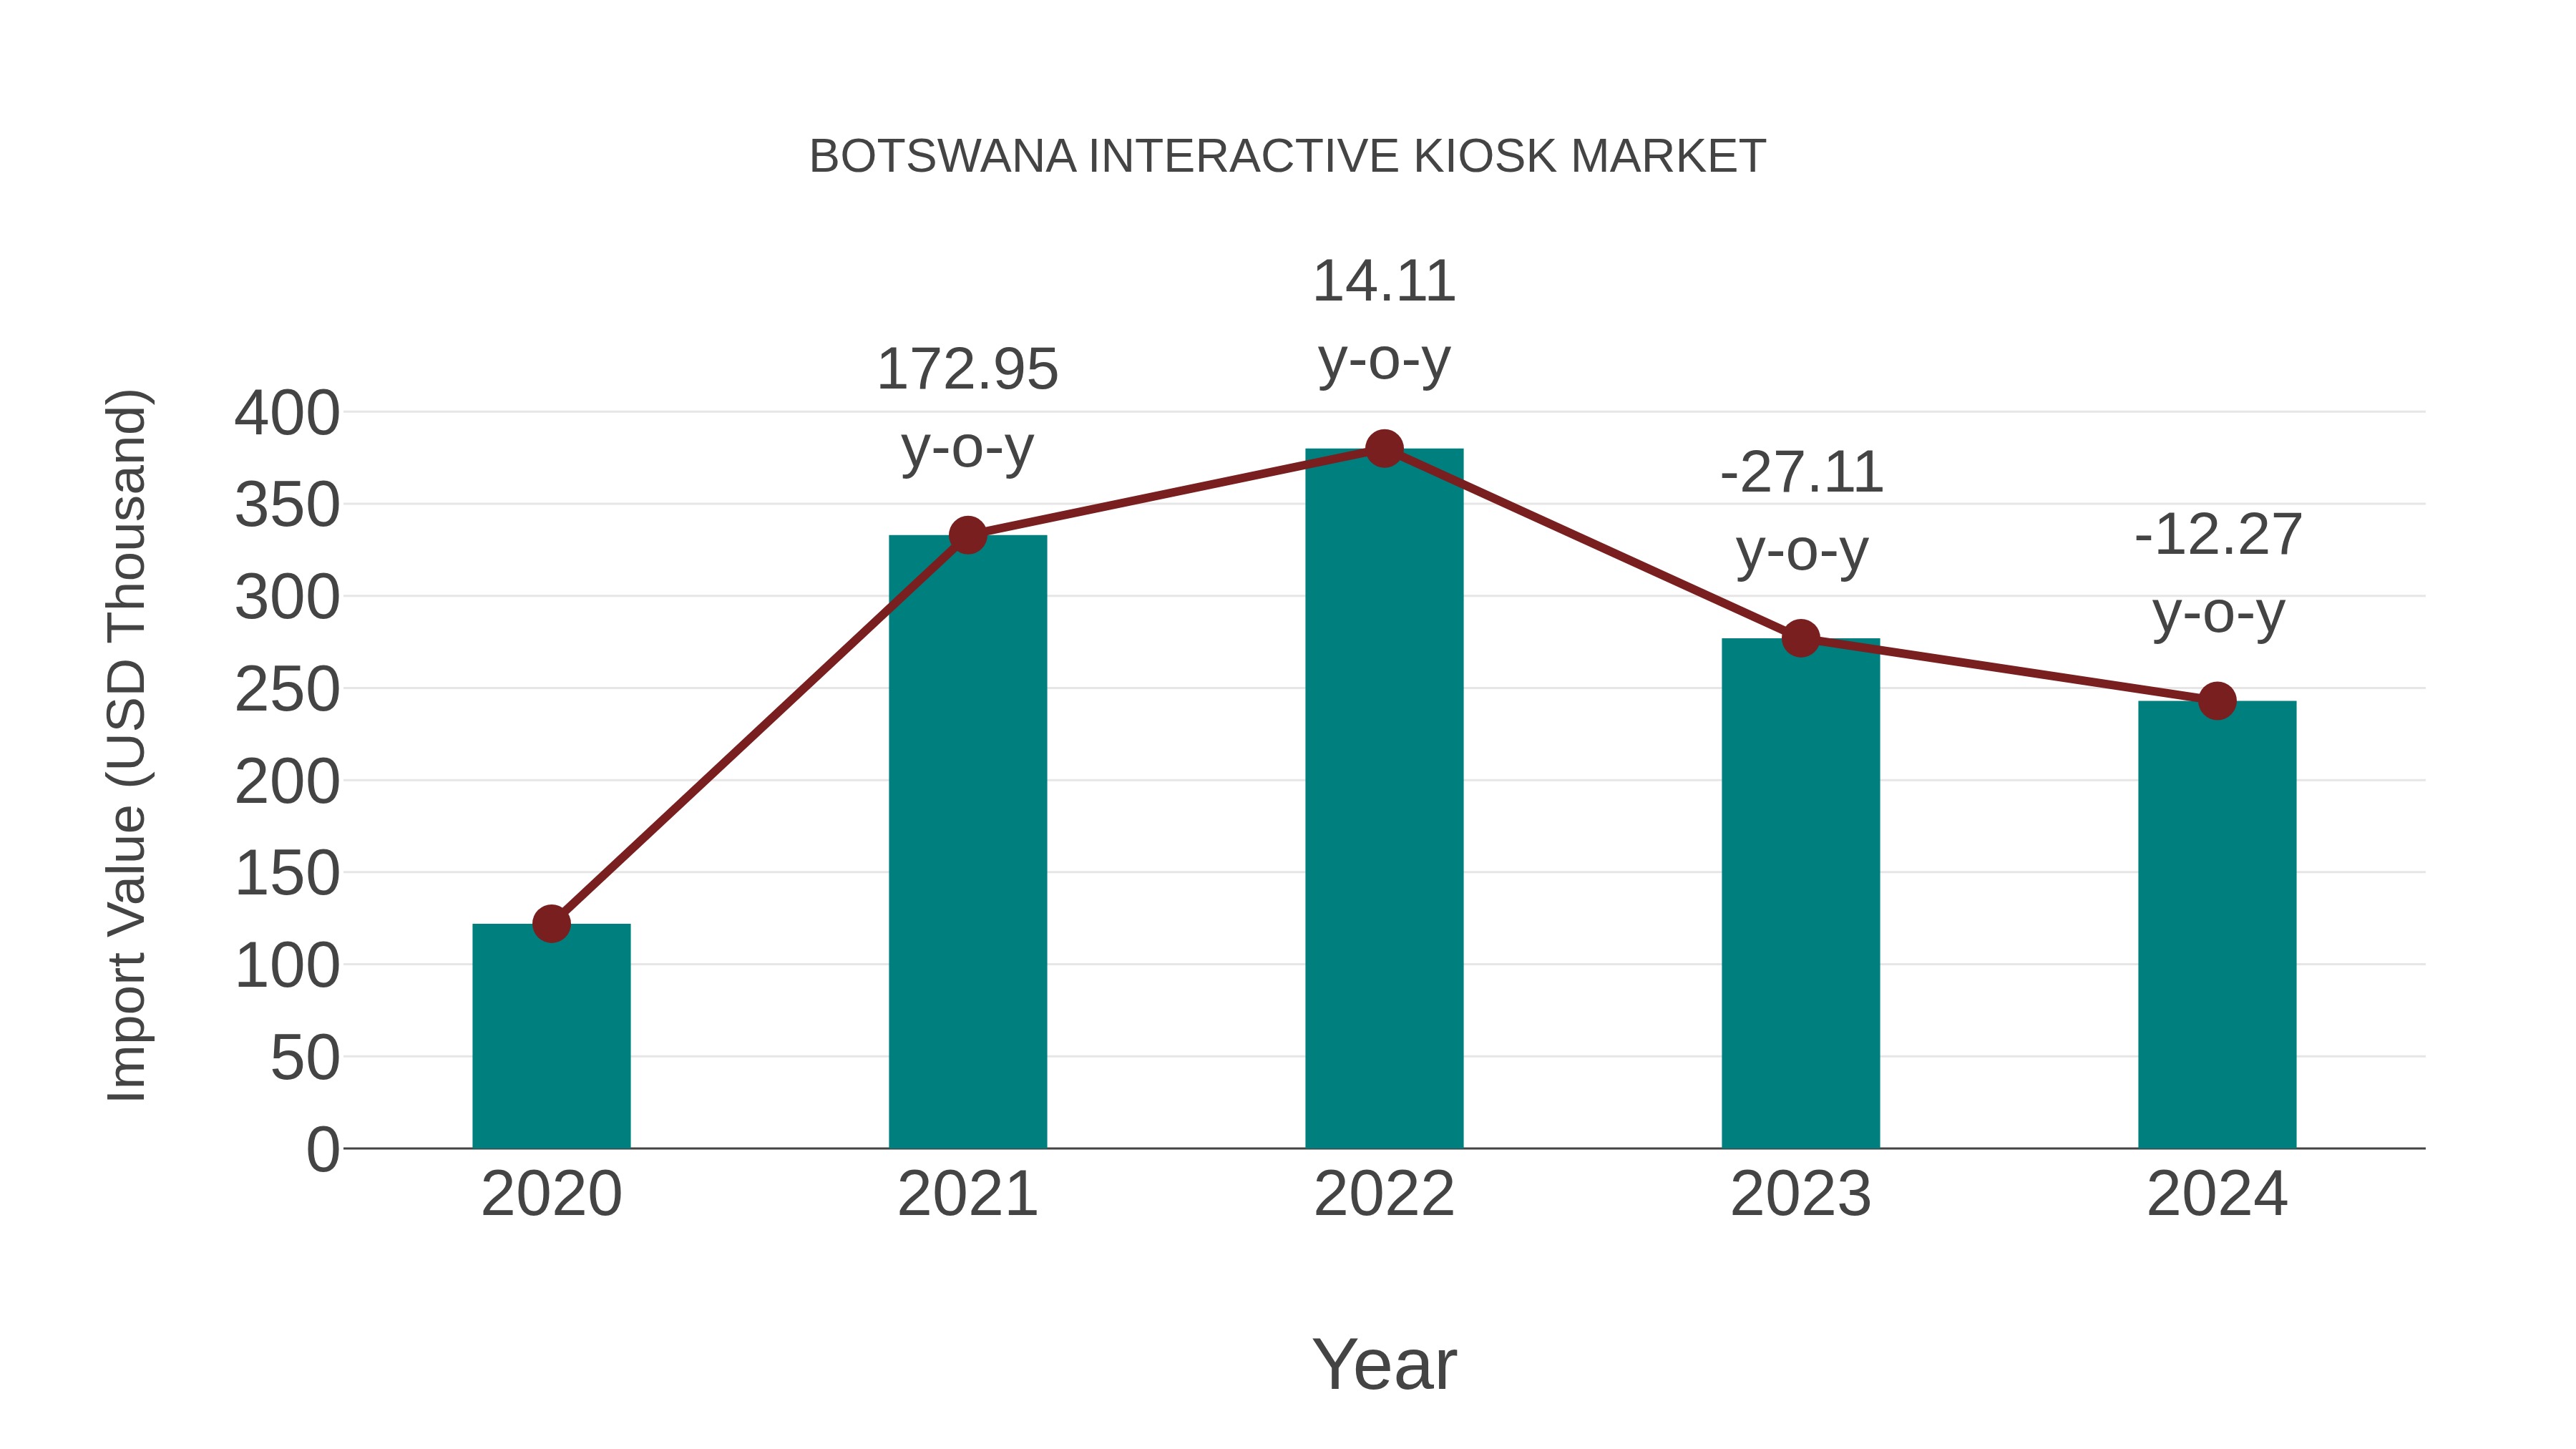
Botswana Interactive Kiosk Market: Import Trend Analysis
The Botswana interactive kiosk market witnessed a significant increase in imports from 2020 to 2024, with a Compound Annual Growth Rate (CAGR) of 18.80%. Despite a slight decline in the year-on-year growth rate of -12.27% in 2023-2024, the overall trend indicated a positive trajectory in import volumes during the period.
Botswana Interactive Kiosk Market Overview
The interactive kiosk market in Botswana is growing as businesses and institutions adopt kiosks for self-service and information dissemination. Interactive kiosks are used in various settings, including retail, hospitality, and public services, to provide users with interactive information and services. The market is driven by the need for user-friendly kiosks that enhance customer engagement and streamline operations.
Drivers of the market
The growing adoption of self-service technologies in retail, healthcare, and hospitality sectors is driving the interactive kiosk market in Botswana. The need for enhanced customer engagement and convenience also supports market growth.
Challenges of the market
The Interactive Kiosk market in Botswana struggles with high costs of advanced kiosk technologies and limited local demand. There is also competition from alternative interactive solutions and a need for effective distribution and technical support services.
Government Policy of the market
Botswana`s policy on interactive kiosks focuses on supporting the development and deployment of self-service kiosks that offer interactive features. The government may offer regulations and incentives to promote the adoption of interactive kiosk technologies.
Key Highlights of the Report:
- Botswana Interactive Kiosk Market Outlook
- Market Size of Botswana Interactive Kiosk Market, 2025
- Forecast of Botswana Interactive Kiosk Market, 2032
- Historical Data and Forecast of Botswana Interactive Kiosk Revenues & Volume for the Period 2022-2032F
- Botswana Interactive Kiosk Market Trend Evolution
- Botswana Interactive Kiosk Market Drivers and Challenges
- Botswana Interactive Kiosk Price Trends
- Botswana Interactive Kiosk Porter`s Five Forces
- Botswana Interactive Kiosk Industry Life Cycle
- Historical Data and Forecast of Botswana Interactive Kiosk Market Revenues & Volume By Offering for the Period 2022-2032F
- Historical Data and Forecast of Botswana Interactive Kiosk Market Revenues & Volume By Hardware for the Period 2022-2032F
- Historical Data and Forecast of Botswana Interactive Kiosk Market Revenues & Volume By Software & Services for the Period 2022-2032F
- Historical Data and Forecast of Botswana Interactive Kiosk Market Revenues & Volume By Type for the Period 2022-2032F
- Historical Data and Forecast of Botswana Interactive Kiosk Market Revenues & Volume By Bank Kiosks for the Period 2022-2032F
- Historical Data and Forecast of Botswana Interactive Kiosk Market Revenues & Volume By Self-services Kiosks for the Period 2022-2032F
- Historical Data and Forecast of Botswana Interactive Kiosk Market Revenues & Volume By Information Kiosks for the Period 2022-2032F
- Historical Data and Forecast of Botswana Interactive Kiosk Market Revenues & Volume By Ticketing Kiosks for the Period 2022-2032F
- Historical Data and Forecast of Botswana Interactive Kiosk Market Revenues & Volume By Photo Kiosks for the Period 2022-2032F
- Historical Data and Forecast of Botswana Interactive Kiosk Market Revenues & Volume By Patient Interactive Kiosk for the Period 2022-2032F
- Historical Data and Forecast of Botswana Interactive Kiosk Market Revenues & Volume By Check-in Kiosk for the Period 2022-2032F
- Historical Data and Forecast of Botswana Interactive Kiosk Market Revenues & Volume By Employment Kiosk for the Period 2022-2032F
- Historical Data and Forecast of Botswana Interactive Kiosk Market Revenues & Volume By Location for the Period 2022-2032F
- Historical Data and Forecast of Botswana Interactive Kiosk Market Revenues & Volume By Indoor for the Period 2022-2032F
- Historical Data and Forecast of Botswana Interactive Kiosk Market Revenues & Volume By Outdoor for the Period 2022-2032F
- Historical Data and Forecast of Botswana Interactive Kiosk Market Revenues & Volume By Panel Size for the Period 2022-2032F
- Historical Data and Forecast of Botswana Interactive Kiosk Market Revenues & Volume By 17?
- Historical Data and Forecast of Botswana Interactive Kiosk Market Revenues & Volume By Above 32?
- Historical Data and Forecast of Botswana Interactive Kiosk Market Revenues & Volume By Vertical for the Period 2022-2032F
- Historical Data and Forecast of Botswana Interactive Kiosk Market Revenues & Volume By Aerospace & Defence for the Period 2022-2032F
- Historical Data and Forecast of Botswana Interactive Kiosk Market Revenues & Volume By Automotive for the Period 2022-2032F
- Historical Data and Forecast of Botswana Interactive Kiosk Market Revenues & Volume By Architecture & Construction for the Period 2022-2032F
- Historical Data and Forecast of Botswana Interactive Kiosk Market Revenues & Volume By Medical for the Period 2022-2032F
- Historical Data and Forecast of Botswana Interactive Kiosk Market Revenues & Volume By Semiconductors & Electronics for the Period 2022-2032F
- Historical Data and Forecast of Botswana Interactive Kiosk Market Revenues & Volume By Energy & Power for the Period 2022-2032F
- Historical Data and Forecast of Botswana Interactive Kiosk Market Revenues & Volume By Heavy Machinery for the Period 2022-2032F
- Historical Data and Forecast of Botswana Interactive Kiosk Market Revenues & Volume By Mining for the Period 2022-2032F
- Botswana Interactive Kiosk Import Export Trade Statistics
- Market Opportunity Assessment By Offering
- Market Opportunity Assessment By Type
- Market Opportunity Assessment By Location
- Market Opportunity Assessment By Panel Size
- Market Opportunity Assessment By Vertical
- Botswana Interactive Kiosk Top Companies Market Share
- Botswana Interactive Kiosk Competitive Benchmarking By Technical and Operational Parameters
- Botswana Interactive Kiosk Company Profiles
- Botswana Interactive Kiosk Key Strategic Recommendations
Botswana Interactive Kiosk Market (2026-2032): FAQs
6Wresearch actively monitors the Botswana Interactive Kiosk Market and publishes its comprehensive annual report, highlighting emerging trends, growth drivers, revenue analysis, and forecast outlook. Our insights help businesses to make data-backed strategic decisions with ongoing market dynamics. Our analysts track relevent industries related to the Botswana Interactive Kiosk Market, allowing our clients with actionable intelligence and reliable forecasts tailored to emerging regional needs.
Yes, we provide customisation as per your requirements. To learn more, feel free to contact us on sales@6wresearch.com
1 Executive Summary |
2 Introduction |
2.1 Key Highlights of the Report |
2.2 Report Description |
2.3 Market Scope & Segmentation |
2.4 Research Methodology |
2.5 Assumptions |
3 Botswana Interactive Kiosk Market Overview |
3.1 Botswana Country Macro Economic Indicators |
3.2 Botswana Interactive Kiosk Market Revenues & Volume, 2022 & 2032F |
3.3 Botswana Interactive Kiosk Market - Industry Life Cycle |
3.4 Botswana Interactive Kiosk Market - Porter's Five Forces |
3.5 Botswana Interactive Kiosk Market Revenues & Volume Share, By Offering , 2022 & 2032F |
3.6 Botswana Interactive Kiosk Market Revenues & Volume Share, By Type , 2022 & 2032F |
3.7 Botswana Interactive Kiosk Market Revenues & Volume Share, By Location , 2022 & 2032F |
3.8 Botswana Interactive Kiosk Market Revenues & Volume Share, By Panel Size, 2022 & 2032F |
3.9 Botswana Interactive Kiosk Market Revenues & Volume Share, By Vertical, 2022 & 2032F |
4 Botswana Interactive Kiosk Market Dynamics |
4.1 Impact Analysis |
4.2 Market Drivers |
4.2.1 Increasing demand for self-service solutions in Botswana |
4.2.2 Growing emphasis on enhancing customer experience and convenience |
4.2.3 Adoption of interactive kiosks by various industries for efficient operations |
4.3 Market Restraints |
4.3.1 High initial investment required for setting up interactive kiosks |
4.3.2 Limited awareness and understanding of interactive kiosk technology in Botswana |
4.3.3 Potential cybersecurity threats and data privacy concerns associated with interactive kiosks |
5 Botswana Interactive Kiosk Market Trends |
6 Botswana Interactive Kiosk Market Segmentations |
6.1 Botswana Interactive Kiosk Market, By Offering |
6.1.1 Overview and Analysis |
6.1.2 Botswana Interactive Kiosk Market Revenues & Volume, By Hardware , 2022-2032F |
6.1.3 Botswana Interactive Kiosk Market Revenues & Volume, By Software & Services, 2022-2032F |
6.2 Botswana Interactive Kiosk Market, By Type |
6.2.1 Overview and Analysis |
6.2.2 Botswana Interactive Kiosk Market Revenues & Volume, By Bank Kiosks, 2022-2032F |
6.2.3 Botswana Interactive Kiosk Market Revenues & Volume, By Self-services Kiosks, 2022-2032F |
6.2.4 Botswana Interactive Kiosk Market Revenues & Volume, By Information Kiosks, 2022-2032F |
6.2.5 Botswana Interactive Kiosk Market Revenues & Volume, By Ticketing Kiosks, 2022-2032F |
6.2.6 Botswana Interactive Kiosk Market Revenues & Volume, By Photo Kiosks, 2022-2032F |
6.2.7 Botswana Interactive Kiosk Market Revenues & Volume, By Patient Interactive Kiosk, 2022-2032F |
6.2.8 Botswana Interactive Kiosk Market Revenues & Volume, By Employment Kiosk, 2022-2032F |
6.2.9 Botswana Interactive Kiosk Market Revenues & Volume, By Employment Kiosk, 2022-2032F |
6.3 Botswana Interactive Kiosk Market, By Location |
6.3.1 Overview and Analysis |
6.3.2 Botswana Interactive Kiosk Market Revenues & Volume, By Indoor , 2022-2032F |
6.3.3 Botswana Interactive Kiosk Market Revenues & Volume, By Outdoor, 2022-2032F |
6.4 Botswana Interactive Kiosk Market, By Panel Size |
6.4.1 Overview and Analysis |
6.4.2 Botswana Interactive Kiosk Market Revenues & Volume, By 17? |
6.4.3 Botswana Interactive Kiosk Market Revenues & Volume, By Above 32? |
6.5 Botswana Interactive Kiosk Market, By Vertical |
6.5.1 Overview and Analysis |
6.5.2 Botswana Interactive Kiosk Market Revenues & Volume, By Aerospace & Defence, 2022-2032F |
6.5.3 Botswana Interactive Kiosk Market Revenues & Volume, By Automotive, 2022-2032F |
6.5.4 Botswana Interactive Kiosk Market Revenues & Volume, By Architecture & Construction, 2022-2032F |
6.5.5 Botswana Interactive Kiosk Market Revenues & Volume, By Medical, 2022-2032F |
6.5.6 Botswana Interactive Kiosk Market Revenues & Volume, By Semiconductors & Electronics, 2022-2032F |
6.5.7 Botswana Interactive Kiosk Market Revenues & Volume, By Energy & Power, 2022-2032F |
6.5.8 Botswana Interactive Kiosk Market Revenues & Volume, By Mining, 2022-2032F |
6.5.9 Botswana Interactive Kiosk Market Revenues & Volume, By Mining, 2022-2032F |
7 Botswana Interactive Kiosk Market Import-Export Trade Statistics |
7.1 Botswana Interactive Kiosk Market Export to Major Countries |
7.2 Botswana Interactive Kiosk Market Imports from Major Countries |
8 Botswana Interactive Kiosk Market Key Performance Indicators |
8.1 Average daily usage per interactive kiosk |
8.2 Percentage increase in foot traffic in locations with interactive kiosks |
8.3 Rate of adoption of interactive kiosks by new industries or sectors |
8.4 Average customer satisfaction score related to interactive kiosk usage |
8.5 Number of successful transactions completed through interactive kiosks |
9 Botswana Interactive Kiosk Market - Opportunity Assessment |
9.1 Botswana Interactive Kiosk Market Opportunity Assessment, By Offering , 2022 & 2032F |
9.2 Botswana Interactive Kiosk Market Opportunity Assessment, By Type , 2022 & 2032F |
9.3 Botswana Interactive Kiosk Market Opportunity Assessment, By Location , 2022 & 2032F |
9.4 Botswana Interactive Kiosk Market Opportunity Assessment, By Panel Size, 2022 & 2032F |
9.5 Botswana Interactive Kiosk Market Opportunity Assessment, By Vertical, 2022 & 2032F |
10 Botswana Interactive Kiosk Market - Competitive Landscape |
10.1 Botswana Interactive Kiosk Market Revenue Share, By Companies, 2025 |
10.2 Botswana Interactive Kiosk Market Competitive Benchmarking, By Operating and Technical Parameters |
11 Company Profiles |
12 Recommendations | 13 Disclaimer |
Global Go To Market Strategy - 2030
Export potential enables firms to identify high-growth global markets with greater confidence by combining advanced trade intelligence with a structured quantitative methodology. The framework analyzes emerging demand trends and country-level import patterns while integrating macroeconomic and trade datasets such as GDP and population forecasts, bilateral import–export flows, tariff structures, elasticity differentials between developed and developing economies, geographic distance, and import demand projections. Using weighted trade values from 2020–2024 as the base period to project country-to-country export potential for 2030, these inputs are operationalized through calculated drivers such as gravity model parameters, tariff impact factors, and projected GDP per-capita growth. Through an analysis of hidden potentials, demand hotspots, and market conditions that are most favorable to success, this method enables firms to focus on target countries, maximize returns, and global expansion with data, backed by accuracy.
By factoring in the projected importer demand gap that is currently unmet and could be potential opportunity, it identifies the potential for the Exporter (Country) among 190 countries, against the general trade analysis, which identifies the biggest importer or exporter.
To discover high-growth global markets and optimize your business strategy:
Click Here
Pricing
- Single User License$ 1,995
- Department License$ 2,400
- Site License$ 3,120
- Global License$ 3,795

Leadership Perspectives from Industry Events
Search
Thought Leadership and Analyst Meet


Our Clients
6WResearch In News
- Doha a strategic location for EV manufacturing hub: IPA Qatar
- Demand for luxury TVs surging in the GCC, says Samsung
- Empowering Growth: The Thriving Journey of Bangladesh’s Cable Industry
- Demand for luxury TVs surging in the GCC, says Samsung
- Video call with a traditional healer? Once unthinkable, it’s now common in South Africa
- Intelligent Buildings To Smooth GCC’s Path To Net Zero
Latest Reports
- Taiwan Airport Wireless Infrastructure Market (2026-2032)
- Vietnam Airport Wireless Infrastructure Market (2026-2032)
- Thailand Airport Wireless Infrastructure Market (2026-2032)
- South Korea Airport Wireless Infrastructure Market (2026-2032)
- Romania Airport Wireless Infrastructure Market (2026-2032)
- Qatar Airport Wireless Infrastructure Market (2026-2032)
- Philippines Airport Wireless Infrastructure Market (2026-2032)
- Japan Airport Wireless Infrastructure Market (2026-2032)
- Taiwan Airport Winter Services Market (2026-2032)
- Vietnam Airport Winter Services Market (2026-2032)
Industry Events and Analyst Meet

HIMTEX 2026

India Refining Summit 2026

India EV Show 2026

EV tech India Expo 2026

Auto Tech Asia 2026
Whitepaper
- Middle East & Africa Commercial Security Market Click here to view more.
- Middle East & Africa Fire Safety Systems & Equipment Market Click here to view more.
- GCC Drone Market Click here to view more.
- Middle East Lighting Fixture Market Click here to view more.
- GCC Physical & Perimeter Security Market Click here to view more.