Botswana Rail Composites Market (2026-2032) | Revenue, Companies, Growth, Size, Segmentation, Share, Outlook, Industry, Analysis, Value, Trends & Forecast
Market Forecast By Fiber Type (Glass fiber, Carbon fiber , others), By Applications (Interior, Exterior), By Resin Type (Epoxy, Polyester, Phenolic, Vinyl Ester, Other Resin Types) And Competitive Landscape
| Product Code: ETC5716064 | Publication Date: Nov 2023 | Updated Date: Mar 2026 | Product Type: Market Research Report | |
| Publisher: 6Wresearch | Author: Sumit Sagar | No. of Pages: 60 | No. of Figures: 30 | No. of Tables: 5 |
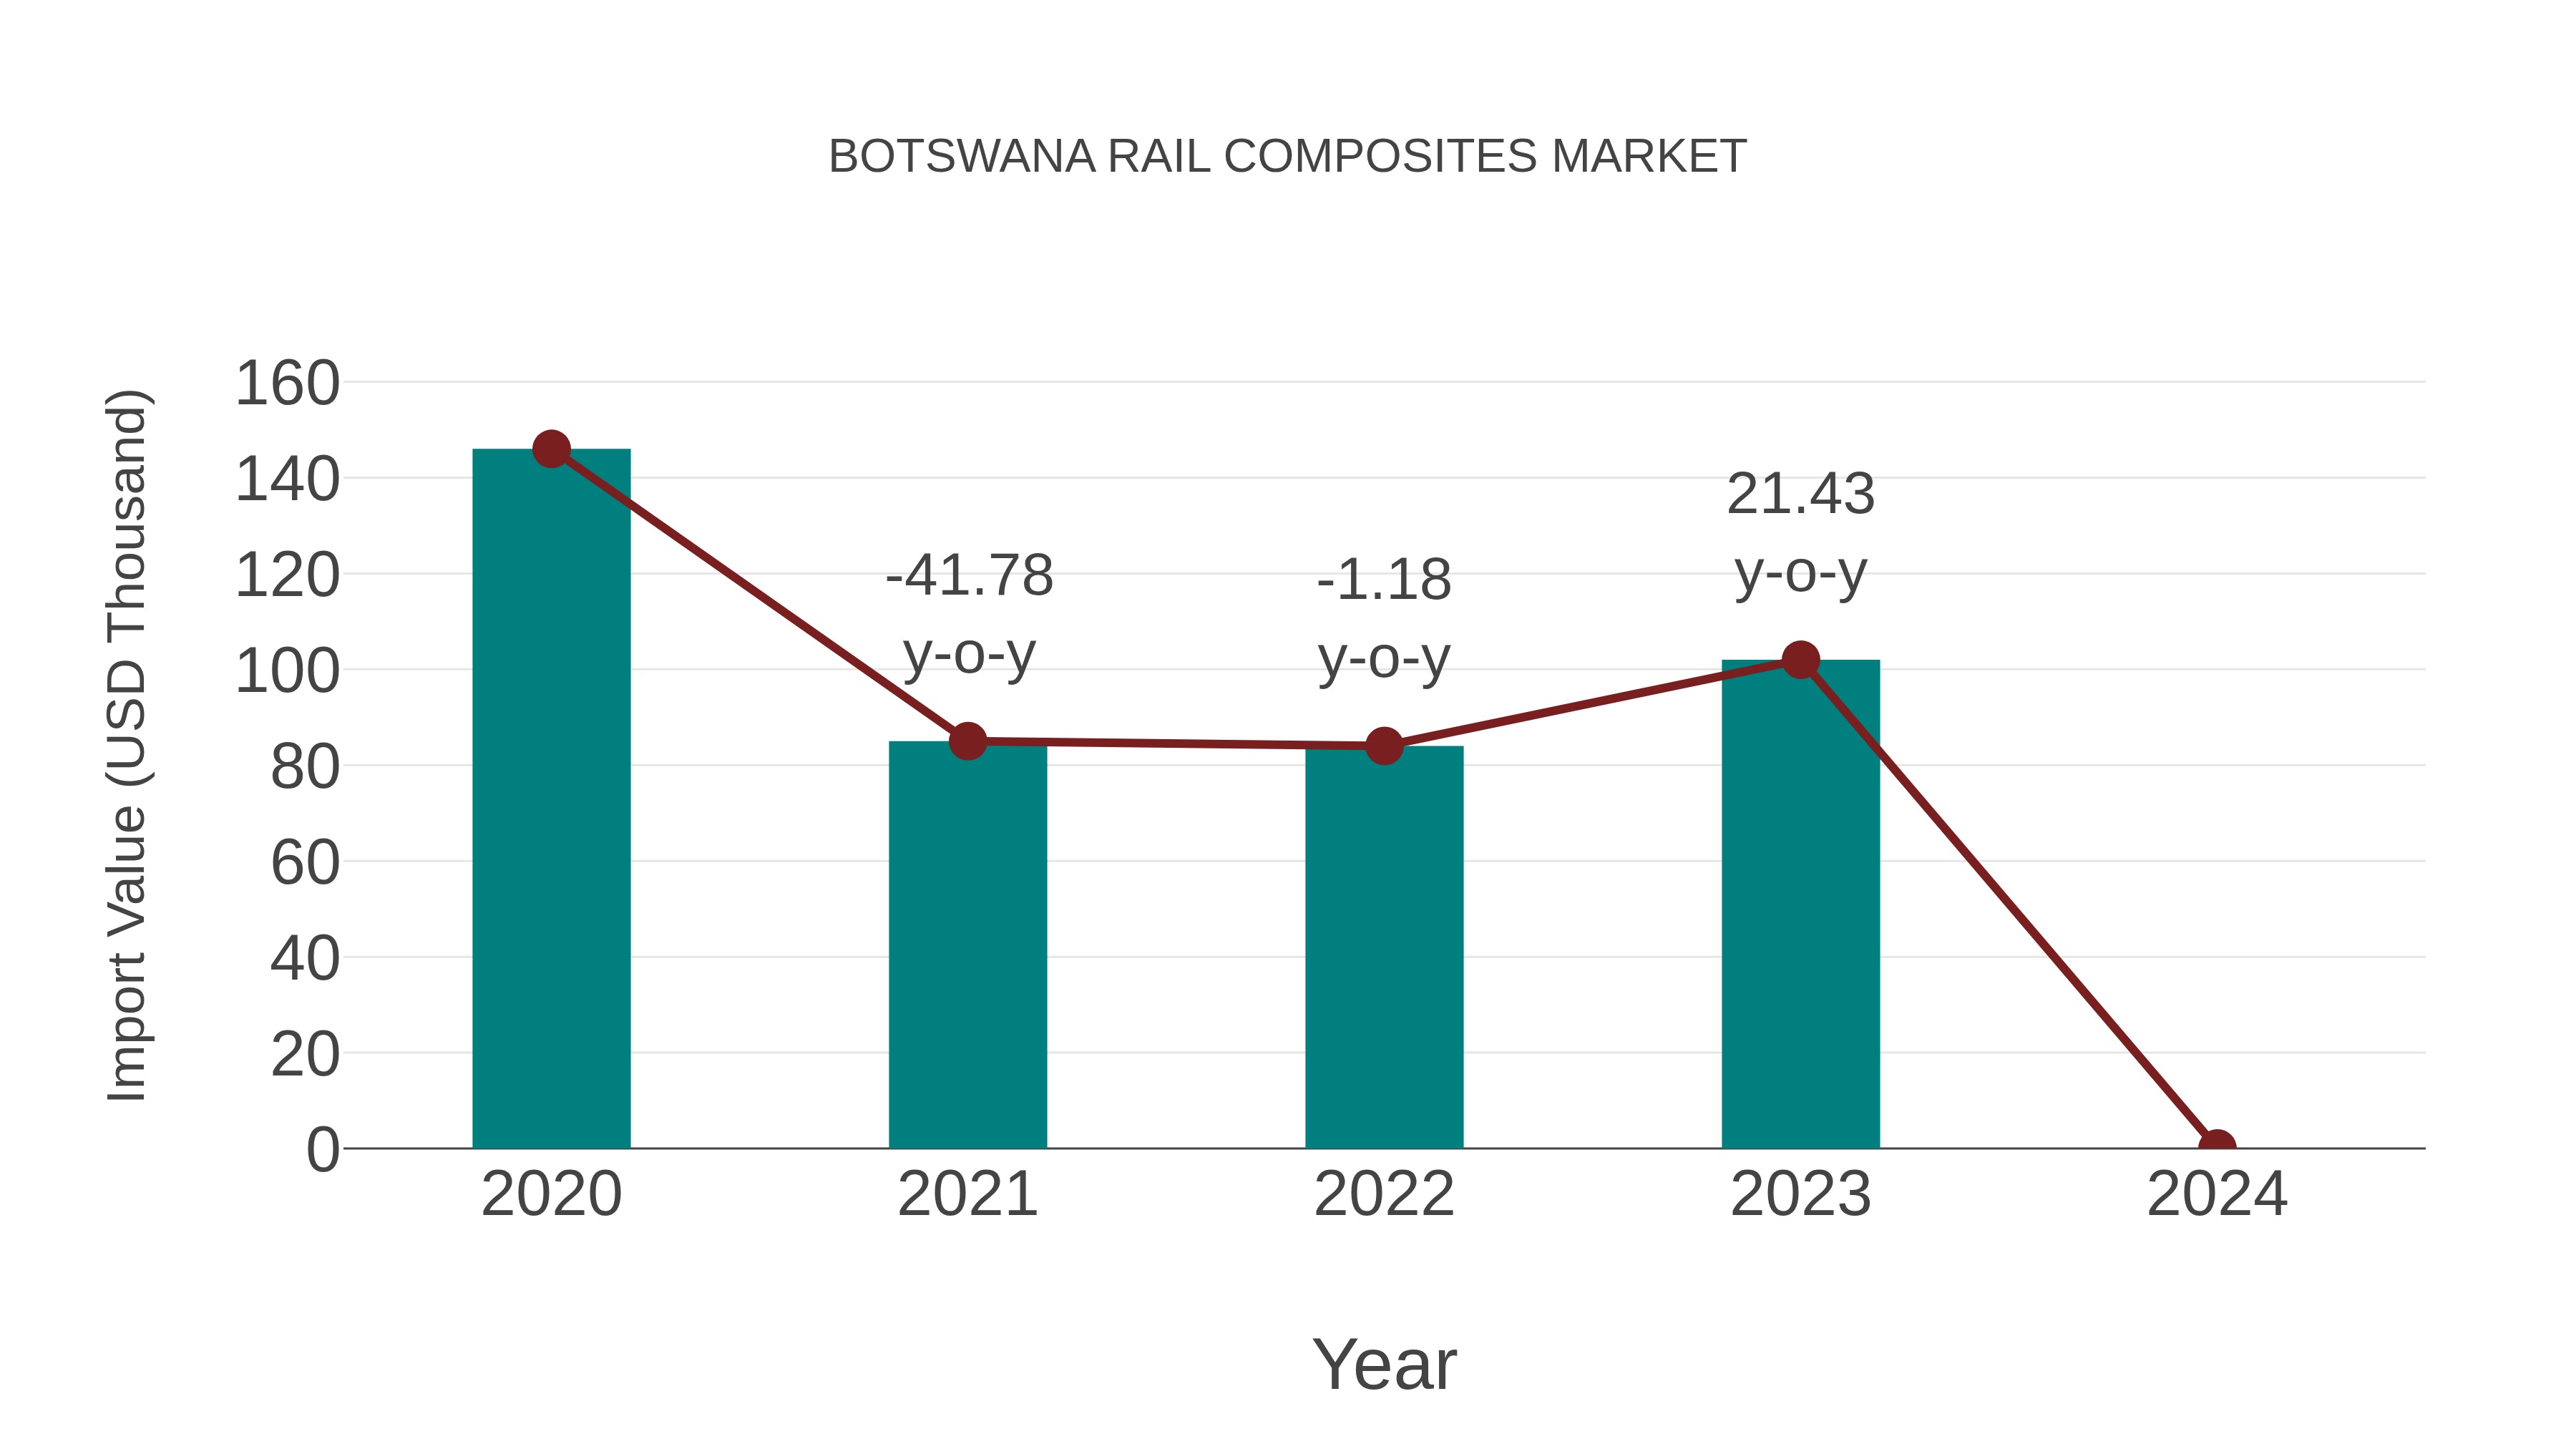
Botswana Rail Composites Market: Import Trend Analysis
The Botswana rail composites market experienced a decline in imports during 2020-2024, with a Compound Annual Growth Rate (CAGR) of -11.27%. The year-on-year growth rate for 2023-2024 was zero, contributing to the overall negative trend in import volumes during the period.
Botswana Rail Composites Market Overview
Botswana`s rail composites market is growing as the railway industry looks for materials that offer high strength, durability, and corrosion resistance. Composites are increasingly used in rail infrastructure and rolling stock to enhance performance and reduce maintenance costs. The market is driven by ongoing railway projects, government investment in transportation infrastructure, and the need for sustainable materials.
Drivers of the market
The Botswana rail composites market is driven by the need for lightweight and durable materials in railway construction to improve fuel efficiency and reduce maintenance costs. The adoption of composites in rail infrastructure is also supported by their corrosion resistance and ability to extend the lifespan of railway components. Additionally, government investments in expanding and modernizing the railway network are further fueling demand for rail composites.
Challenges of the market
The rail composites market in Botswana is challenged by limited domestic manufacturing capabilities, resulting in dependence on imports. High costs of composite materials and the need for specialized knowledge in their application also hinder market growth. Moreover, the small size of the national rail network limits market demand.
Government Policy of the market
Botswana`s government policies in the rail composites market are aligned with the country`s infrastructure development goals. The government supports the use of composite materials in railway construction to enhance durability and reduce maintenance costs. Policies also encourage innovation and the adoption of sustainable materials in the railway sector to improve efficiency and reduce environmental impact.
Key Highlights of the Report:
- Botswana Rail Composites Market Outlook
- Market Size of Botswana Rail Composites Market, 2025
- Forecast of Botswana Rail Composites Market, 2032
- Historical Data and Forecast of Botswana Rail Composites Revenues & Volume for the Period 2022-2032F
- Botswana Rail Composites Market Trend Evolution
- Botswana Rail Composites Market Drivers and Challenges
- Botswana Rail Composites Price Trends
- Botswana Rail Composites Porter`s Five Forces
- Botswana Rail Composites Industry Life Cycle
- Historical Data and Forecast of Botswana Rail Composites Market Revenues & Volume By Fiber Type for the Period 2022-2032F
- Historical Data and Forecast of Botswana Rail Composites Market Revenues & Volume By Glass fiber for the Period 2022-2032F
- Historical Data and Forecast of Botswana Rail Composites Market Revenues & Volume By Carbon fiber for the Period 2022-2032F
- Historical Data and Forecast of Botswana Rail Composites Market Revenues & Volume By others for the Period 2022-2032F
- Historical Data and Forecast of Botswana Rail Composites Market Revenues & Volume By Applications for the Period 2022-2032F
- Historical Data and Forecast of Botswana Rail Composites Market Revenues & Volume By Interior for the Period 2022-2032F
- Historical Data and Forecast of Botswana Rail Composites Market Revenues & Volume By Exterior for the Period 2022-2032F
- Historical Data and Forecast of Botswana Rail Composites Market Revenues & Volume By Resin Type for the Period 2022-2032F
- Historical Data and Forecast of Botswana Rail Composites Market Revenues & Volume By Epoxy for the Period 2022-2032F
- Historical Data and Forecast of Botswana Rail Composites Market Revenues & Volume By Polyester for the Period 2022-2032F
- Historical Data and Forecast of Botswana Rail Composites Market Revenues & Volume By Phenolic for the Period 2022-2032F
- Historical Data and Forecast of Botswana Rail Composites Market Revenues & Volume By Vinyl Ester for the Period 2022-2032F
- Historical Data and Forecast of Botswana Rail Composites Market Revenues & Volume By Other Resin Types for the Period 2022-2032F
- Botswana Rail Composites Import Export Trade Statistics
- Market Opportunity Assessment By Fiber Type
- Market Opportunity Assessment By Applications
- Market Opportunity Assessment By Resin Type
- Botswana Rail Composites Top Companies Market Share
- Botswana Rail Composites Competitive Benchmarking By Technical and Operational Parameters
- Botswana Rail Composites Company Profiles
- Botswana Rail Composites Key Strategic Recommendations
Botswana Rail Composites Market (2026-2032): FAQs
6Wresearch actively monitors the Botswana Rail Composites Market and publishes its comprehensive annual report, highlighting emerging trends, growth drivers, revenue analysis, and forecast outlook. Our insights help businesses to make data-backed strategic decisions with ongoing market dynamics. Our analysts track relevent industries related to the Botswana Rail Composites Market, allowing our clients with actionable intelligence and reliable forecasts tailored to emerging regional needs.
Yes, we provide customisation as per your requirements. To learn more, feel free to contact us on sales@6wresearch.com
1 Executive Summary |
2 Introduction |
2.1 Key Highlights of the Report |
2.2 Report Description |
2.3 Market Scope & Segmentation |
2.4 Research Methodology |
2.5 Assumptions |
3 Botswana Rail Composites Market Overview |
3.1 Botswana Country Macro Economic Indicators |
3.2 Botswana Rail Composites Market Revenues & Volume, 2022 & 2032F |
3.3 Botswana Rail Composites Market - Industry Life Cycle |
3.4 Botswana Rail Composites Market - Porter's Five Forces |
3.5 Botswana Rail Composites Market Revenues & Volume Share, By Fiber Type, 2022 & 2032F |
3.6 Botswana Rail Composites Market Revenues & Volume Share, By Applications, 2022 & 2032F |
3.7 Botswana Rail Composites Market Revenues & Volume Share, By Resin Type, 2022 & 2032F |
4 Botswana Rail Composites Market Dynamics |
4.1 Impact Analysis |
4.2 Market Drivers |
4.2.1 Growth in the transportation industry in Botswana |
4.2.2 Government initiatives to modernize rail infrastructure |
4.2.3 Increasing demand for lightweight and durable materials in the rail sector |
4.3 Market Restraints |
4.3.1 High initial investment costs for implementing composite materials in rail infrastructure |
4.3.2 Limited awareness and expertise in working with rail composites in Botswana |
5 Botswana Rail Composites Market Trends |
6 Botswana Rail Composites Market Segmentations |
6.1 Botswana Rail Composites Market, By Fiber Type |
6.1.1 Overview and Analysis |
6.1.2 Botswana Rail Composites Market Revenues & Volume, By Glass fiber, 2022-2032F |
6.1.3 Botswana Rail Composites Market Revenues & Volume, By Carbon fiber , 2022-2032F |
6.1.4 Botswana Rail Composites Market Revenues & Volume, By others, 2022-2032F |
6.2 Botswana Rail Composites Market, By Applications |
6.2.1 Overview and Analysis |
6.2.2 Botswana Rail Composites Market Revenues & Volume, By Interior, 2022-2032F |
6.2.3 Botswana Rail Composites Market Revenues & Volume, By Exterior, 2022-2032F |
6.3 Botswana Rail Composites Market, By Resin Type |
6.3.1 Overview and Analysis |
6.3.2 Botswana Rail Composites Market Revenues & Volume, By Epoxy, 2022-2032F |
6.3.3 Botswana Rail Composites Market Revenues & Volume, By Polyester, 2022-2032F |
6.3.4 Botswana Rail Composites Market Revenues & Volume, By Phenolic, 2022-2032F |
6.3.5 Botswana Rail Composites Market Revenues & Volume, By Vinyl Ester, 2022-2032F |
6.3.6 Botswana Rail Composites Market Revenues & Volume, By Other Resin Types, 2022-2032F |
7 Botswana Rail Composites Market Import-Export Trade Statistics |
7.1 Botswana Rail Composites Market Export to Major Countries |
7.2 Botswana Rail Composites Market Imports from Major Countries |
8 Botswana Rail Composites Market Key Performance Indicators |
8.1 Percentage increase in the adoption rate of rail composites in Botswana |
8.2 Number of government projects incorporating rail composite materials |
8.3 Average cost savings achieved through the use of rail composites compared to traditional materials |
9 Botswana Rail Composites Market - Opportunity Assessment |
9.1 Botswana Rail Composites Market Opportunity Assessment, By Fiber Type, 2022 & 2032F |
9.2 Botswana Rail Composites Market Opportunity Assessment, By Applications, 2022 & 2032F |
9.3 Botswana Rail Composites Market Opportunity Assessment, By Resin Type, 2022 & 2032F |
10 Botswana Rail Composites Market - Competitive Landscape |
10.1 Botswana Rail Composites Market Revenue Share, By Companies, 2025 |
10.2 Botswana Rail Composites Market Competitive Benchmarking, By Operating and Technical Parameters |
11 Company Profiles |
12 Recommendations | 13 Disclaimer |
Global Go To Market Strategy - 2030
Export potential enables firms to identify high-growth global markets with greater confidence by combining advanced trade intelligence with a structured quantitative methodology. The framework analyzes emerging demand trends and country-level import patterns while integrating macroeconomic and trade datasets such as GDP and population forecasts, bilateral import–export flows, tariff structures, elasticity differentials between developed and developing economies, geographic distance, and import demand projections. Using weighted trade values from 2020–2024 as the base period to project country-to-country export potential for 2030, these inputs are operationalized through calculated drivers such as gravity model parameters, tariff impact factors, and projected GDP per-capita growth. Through an analysis of hidden potentials, demand hotspots, and market conditions that are most favorable to success, this method enables firms to focus on target countries, maximize returns, and global expansion with data, backed by accuracy.
By factoring in the projected importer demand gap that is currently unmet and could be potential opportunity, it identifies the potential for the Exporter (Country) among 190 countries, against the general trade analysis, which identifies the biggest importer or exporter.
To discover high-growth global markets and optimize your business strategy:
Click Here
Pricing
- Single User License$ 1,995
- Department License$ 2,400
- Site License$ 3,120
- Global License$ 3,795

Leadership Perspectives from Industry Events
Search
Thought Leadership and Analyst Meet


Our Clients
6WResearch In News
- Doha a strategic location for EV manufacturing hub: IPA Qatar
- Demand for luxury TVs surging in the GCC, says Samsung
- Empowering Growth: The Thriving Journey of Bangladesh’s Cable Industry
- Demand for luxury TVs surging in the GCC, says Samsung
- Video call with a traditional healer? Once unthinkable, it’s now common in South Africa
- Intelligent Buildings To Smooth GCC’s Path To Net Zero
Latest Reports
- New Zealand Aseptic Manufacturing Market (2026-2032)
- Netherlands Aseptic Manufacturing Market (2026-2032)
- Nauru Aseptic Manufacturing Market (2026-2032)
- Namibia Aseptic Manufacturing Market (2026-2032)
- Mozambique Aseptic Manufacturing Market (2026-2032)
- Montenegro Aseptic Manufacturing Market (2026-2032)
- Mongolia Aseptic Manufacturing Market (2026-2032)
- Monaco Aseptic Manufacturing Market (2026-2032)
- Micronesia Aseptic Manufacturing Market (2026-2032)
- Mauritius Aseptic Manufacturing Market (2026-2032)
Industry Events and Analyst Meet

HIMTEX 2026

India Refining Summit 2026

India EV Show 2026

EV tech India Expo 2026

Auto Tech Asia 2026
Whitepaper
- Middle East & Africa Commercial Security Market Click here to view more.
- Middle East & Africa Fire Safety Systems & Equipment Market Click here to view more.
- GCC Drone Market Click here to view more.
- Middle East Lighting Fixture Market Click here to view more.
- GCC Physical & Perimeter Security Market Click here to view more.