Brazil Automotive Stampings Market (2026-2032) | Trends, Industry, Size, Growth, Outlook, Value, Share, Revenue, Forecast, Companies & Analysis
Market Forecast By Forming Temperature (Hot Stamping, Cold Stamping), By Stamping Process (Mechanical Process, Hydraulic Process, Pneumatic Process), By Number of Station Required (Single Tool Station, Progressive Stations) And Competitive Landscape
| Product Code: ETC043602 | Publication Date: Jan 2021 | Updated Date: Jun 2026 | Product Type: Report | |
| Publisher: 6Wresearch | Author: Ravi Bhandari | No. of Pages: 70 | No. of Figures: 35 | No. of Tables: 5 |
Brazil Automotive Stampings Market Summary
The brazil automotive stampings market was estimated at USD 178 Million in 2025 and is projected to reach USD 211 Million by 2032, growing at a CAGR of 3.0% from 2026 to 2032.
Brazil Automotive Stampings Market Year-wise Growth Rate and Key Drivers
This graph highlights how the Brazil Automotive Stampings Market has steadily grown over the past five years, supported by major growth factors.
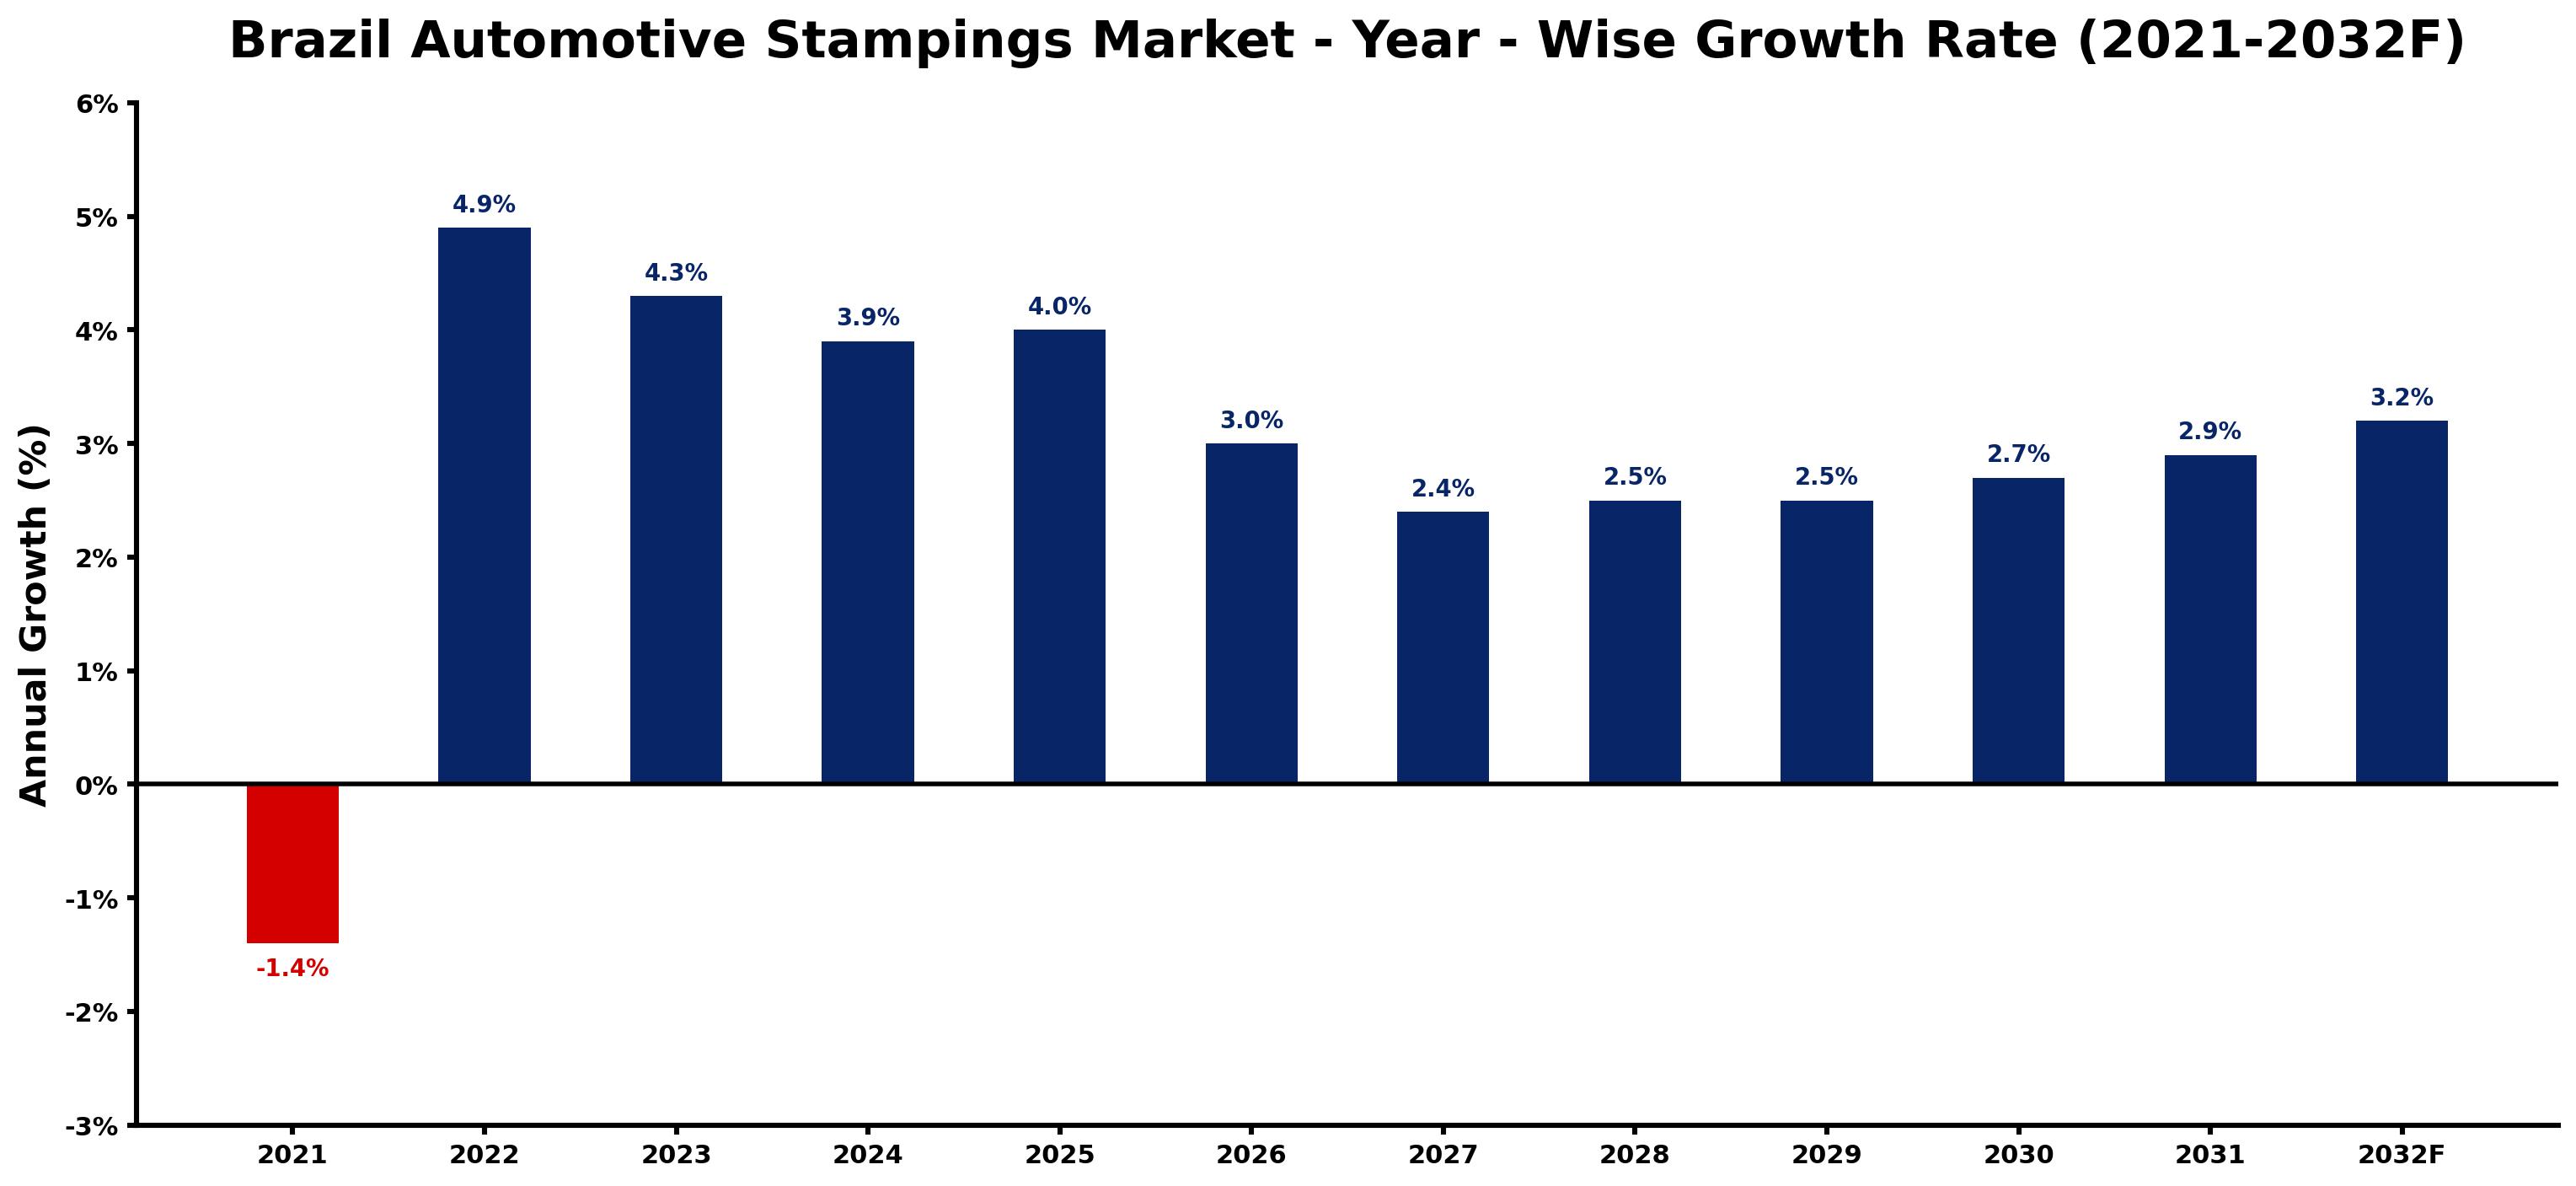
The table below presents the year wise growth rates along with the key drivers influencing the market
| Year | Growth Rate | Major Drivers |
| 2021 | -1.4% | Supply chain disruptions due to pandemicrelated restrictions hampered production and limited vehicle availability in 2021. |
| 2022 | 4.9% | Local manufacturers enhance their supply chain resilience amid global disruption challenges. |
| 2023 | 4.3% | Investment in electric vehicle production stimulates innovation in automotive stampings technology. |
| 2024 | 3.9% | Increased consumer preference for compact vehicles results in higher demand for lightweight materials. |
| 2025 | 4.0% | New trade agreements facilitate import of advanced stamping machinery into the Brazilian market. |
| 2026 | 3.0% | Emerging electric vehicle startups contribute to a shift in industry dynamics and opportunities. |
| 2027 | 2.4% | Collaborations between national firms and international players enhance technological capabilities significantly. |
| 2028 | 2.5% | Sustainability practices become essential as consumers demand greener automotive solutions from manufacturers. |
| 2029 | 2.5% | Digital transformation trends lead to improved efficiency and production processes within stamping facilities. |
| 2030 | 2.7% | As urbanization continues, mini and micro vehicles gain popularity, influencing design needs. |
| 2031 | 2.9% | Expansion of Brazil's infrastructure supports increased automotive production capabilities and market reach. |
| 2032 | 3.2% | Post-pandemic lifestyle changes drive innovations in vehicle designs, shaping future automotive trends. |
Note - Market size estimations and growth projections presented in this report are based on 6Wresearch's advanced forecasting approach, validated with industry datasets as of June 2026.
Brazil Automotive Stampings Market Synopsis
The Brazil Automotive Stampings Market is projected to reach 3.0% and witness significant growth during the forecast period (2026-2032). This growth trajectory is anticipated to be driven by the ongoing expansion of the automotive industry in Brazil, which is witnessing an increasing demand for advanced components that enhance vehicle performance and efficiency. Factors such as technological advancements in stamping processes and a shift towards lightweight materials are reshaping the landscape of the market.
Brazil Automotive Stampings Market Growth Drivers
The driving forces behind the Brazil Automotive Stampings Market include:
- A robust automotive industry, with a significant focus on modernizing manufacturing processes to meet consumer demands for fuel-efficient vehicles.
- Advancements in stamping technologies, such as high-strength material applications and precision stamping techniques, enabling manufacturers to produce better-quality components.
- Increasing regulatory pressure on automotive manufacturers to comply with stringent vehicle safety and emissions standards, leading to investments in high-quality stamping components.
- The rising popularity of electric vehicles, which necessitate unique stamping solutions and innovative design concepts to reduce weight and enhance performance.
- The trend toward automation in manufacturing processes, which reduces production costs and increases output efficiency, further propelling the market forward.
Brazil Automotive Stampings Market Challenges and Restraints
Despite the promising growth prospects, the Brazil Automotive Stampings Market faces several challenges:
- The automotive industry's transition towards lightweight materials and electric vehicles requires significant adaptations in traditional stamping methods, leading to potential disruptions in the supply chain.
- The need for substantial investments in technology and workforce training to keep pace with evolving manufacturing requirements can strain financial resources for many manufacturers.
- Global economic uncertainties and trade fluctuations pose risks that may affect the stability of the supply chain and pricing strategies in the stamping market.
- Competition from low-cost international suppliers may drive down profit margins, forcing local manufacturers to innovate continuously to maintain competitiveness.
- Potential regulatory changes focusing on sustainability and emissions may impose additional compliance costs, affecting investments and operational margins.
Brazil Automotive Stampings Market Government Investment and Initiatives
The Brazilian government plays a significant role in shaping the automotive stampings landscape through various policies and initiatives aimed at promoting industry growth:
- Investment in infrastructure development to facilitate smoother logistics and supply chain operations for automotive manufacturers across the country.
- Implementation of policies focused on enhancing vehicle safety standards, thereby increasing demand for high-quality stamping components that meet these regulations.
- Support for research and development initiatives, encouraging local manufacturers to innovate and adopt advanced stamping technologies and methodologies.
- Incentives for companies investing in environmentally friendly technologies and practices, supporting the transition toward more sustainable vehicle production.
- Collaboration with educational institutions to provide workforce training programs focused on the latest stamping technologies and manufacturing processes.
Brazil Automotive Stampings Market Latest Developments (May 2025 - June 2026)
In recent months, the Brazil Automotive Stampings Market has experienced notable developments, reflecting the evolving dynamics of the automotive industry. Manufacturers are increasingly adopting cutting-edge stamping technologies to enhance efficiency and product quality. There has been a marked emphasis on integrating automation into production lines, with several companies exploring partnerships to leverage advanced machinery and digital solutions. The shift towards electrically powered vehicles is prompting stakeholders to re-evaluate their manufacturing approaches and systems. Moreover, regulatory agencies have proposed updates to safety and environmental standards, urging manufacturers to comply with new benchmarks that support both innovation and sustainability.
Brazil Automotive Stampings Market - Key Attractiveness of the Report
- 10 Years of Market Numbers
- Historical Data Starting from 2022 to 2025
- Base Year: 2025
- Forecast Data until 2032
- Key Performance Indicators Impacting the Market
- Major Upcoming Developments and Projects
Key Highlights of the Report:
- Brazil Automotive Stampings Market Outlook
- Market Size of Brazil Automotive Stampings Market, 2025
- Forecast of Brazil Automotive Stampings Market, 2032
- Historical Data and Forecast of Brazil Automotive Stampings Revenues & Volume for the Period 2022-2032F
- Brazil Automotive Stampings Market Trend Evolution
- Brazil Automotive Stampings Market Drivers and Challenges
- Brazil Automotive Stampings Price Trends
- Brazil Automotive Stampings Porter's Five Forces
- Brazil Automotive Stampings Industry Life Cycle
- Historical Data and Forecast of Brazil Automotive Stampings Market Revenues & Volume By Forming Temperature for the Period 2022-2032F
- Historical Data and Forecast of Brazil Automotive Stampings Market Revenues & Volume By Hot Stamping for the Period 2022-2032F
- Historical Data and Forecast of Brazil Automotive Stampings Market Revenues & Volume By Cold Stamping for the Period 2022-2032F
- Historical Data and Forecast of Brazil Automotive Stampings Market Revenues & Volume By Stamping Process for the Period 2022-2032F
- Historical Data and Forecast of Brazil Automotive Stampings Market Revenues & Volume By Mechanical Process for the Period 2022-2032F
- Historical Data and Forecast of Brazil Automotive Stampings Market Revenues & Volume By Hydraulic Process for the Period 2022-2032F
- Historical Data and Forecast of Brazil Automotive Stampings Market Revenues & Volume By Pneumatic Process for the Period 2022-2032F
- Historical Data and Forecast of Brazil Automotive Stampings Market Revenues & Volume By Number of Station Required for the Period 2022-2032F
- Historical Data and Forecast of Brazil Automotive Stampings Market Revenues & Volume By Single Tool Station for the Period 2022-2032F
- Historical Data and Forecast of Brazil Automotive Stampings Market Revenues & Volume By Progressive Stations for the Period 2022-2032F
- Brazil Automotive Stampings Import Export Trade Statistics
- Market Opportunity Assessment By Forming Temperature
- Market Opportunity Assessment By Stamping Process
- Market Opportunity Assessment By Number of Station Required
- Brazil Automotive Stampings Top Companies Market Share
- Brazil Automotive Stampings Competitive Benchmarking By Technical and Operational Parameters
- Brazil Automotive Stampings Company Profiles
- Brazil Automotive Stampings Key Strategic Recommendations
Frequently Asked Questions About the Market Study (FAQs):
The Brazil Automotive Stampings Market is forecasted to grow significantly during the period from 2026 to 2032.
Key drivers include demand for lightweight vehicles, advancements in stamping technologies, and stringent regulatory requirements.
Challenges include adapting traditional stamping methods to modern materials, economic uncertainties, and competition from international suppliers.
Government initiatives focus on safety standards, infrastructure investment, and sustainability, which collectively shape market growth.
6Wresearch actively monitors the Brazil Automotive Stampings Market and publishes its comprehensive annual report, highlighting emerging trends, growth drivers, revenue analysis, and forecast outlook. Our insights help businesses to make data-backed strategic decisions with ongoing market dynamics. Our analysts track relevent industries related to the Brazil Automotive Stampings Market, allowing our clients with actionable intelligence and reliable forecasts tailored to emerging regional needs.
Yes, we provide customisation as per your requirements. To learn more, feel free to contact us on sales@6wresearch.com
1 Executive Summary |
2 Introduction |
2.1 Key Highlights of the Report |
2.2 Report Description |
2.3 Market Scope & Segmentation |
2.4 Research Methodology |
2.5 Assumptions |
3 Brazil Automotive Stampings Market Overview |
3.1 Brazil Country Macro Economic Indicators |
3.2 Brazil Automotive Stampings Market Revenues & Volume, 2022 & 2032F |
3.3 Brazil Automotive Stampings Market - Industry Life Cycle |
3.4 Brazil Automotive Stampings Market - Porter's Five Forces |
3.5 Brazil Automotive Stampings Market Revenues & Volume Share, By Forming Temperature, 2022 & 2032F |
3.6 Brazil Automotive Stampings Market Revenues & Volume Share, By Stamping Process, 2022 & 2032F |
3.7 Brazil Automotive Stampings Market Revenues & Volume Share, By Number of Station Required, 2022 & 2032F |
4 Brazil Automotive Stampings Market Dynamics |
4.1 Impact Analysis |
4.2 Market Drivers |
4.2.1 Increasing demand for lightweight vehicles to improve fuel efficiency |
4.2.2 Growing automotive industry in Brazil leading to higher demand for stampings |
4.2.3 Technological advancements in stamping processes improving efficiency and quality |
4.3 Market Restraints |
4.3.1 Fluctuating raw material prices impacting production costs |
4.3.2 Competition from substitute materials like plastics impacting demand for stampings |
4.3.3 Regulatory changes affecting manufacturing processes and costs |
5 Brazil Automotive Stampings Market Trends |
6 Brazil Automotive Stampings Market, By Types |
6.1 Brazil Automotive Stampings Market, By Forming Temperature |
6.1.1 Overview and Analysis |
6.1.2 Brazil Automotive Stampings Market Revenues & Volume, By Forming Temperature, 2022-2032F |
6.1.3 Brazil Automotive Stampings Market Revenues & Volume, By Hot Stamping, 2022-2032F |
6.1.4 Brazil Automotive Stampings Market Revenues & Volume, By Cold Stamping, 2022-2032F |
6.2 Brazil Automotive Stampings Market, By Stamping Process |
6.2.1 Overview and Analysis |
6.2.2 Brazil Automotive Stampings Market Revenues & Volume, By Mechanical Process, 2022-2032F |
6.2.3 Brazil Automotive Stampings Market Revenues & Volume, By Hydraulic Process, 2022-2032F |
6.2.4 Brazil Automotive Stampings Market Revenues & Volume, By Pneumatic Process, 2022-2032F |
6.3 Brazil Automotive Stampings Market, By Number of Station Required |
6.3.1 Overview and Analysis |
6.3.2 Brazil Automotive Stampings Market Revenues & Volume, By Single Tool Station, 2022-2032F |
6.3.3 Brazil Automotive Stampings Market Revenues & Volume, By Progressive Stations, 2022-2032F |
7 Brazil Automotive Stampings Market Import-Export Trade Statistics |
7.1 Brazil Automotive Stampings Market Export to Major Countries |
7.2 Brazil Automotive Stampings Market Imports from Major Countries |
8 Brazil Automotive Stampings Market Key Performance Indicators |
8.1 Scrap rate: Lower scrap rates indicate efficient stamping processes and reduced material wastage. |
8.2 Production cycle time: Decreasing cycle times indicate improved efficiency and capacity utilization. |
8.3 Supplier performance: Monitoring supplier performance in terms of quality and delivery can impact overall production efficiency. |
9 Brazil Automotive Stampings Market - Opportunity Assessment |
9.1 Brazil Automotive Stampings Market Opportunity Assessment, By Forming Temperature, 2022 & 2032F |
9.2 Brazil Automotive Stampings Market Opportunity Assessment, By Stamping Process, 2022 & 2032F |
9.3 Brazil Automotive Stampings Market Opportunity Assessment, By Number of Station Required, 2022 & 2032F |
10 Brazil Automotive Stampings Market - Competitive Landscape |
10.1 Brazil Automotive Stampings Market Revenue Share, By Companies, 2025 |
10.2 Brazil Automotive Stampings Market Competitive Benchmarking, By Operating and Technical Parameters |
11 Company Profiles |
12 Recommendations |
13 Disclaimer |
Global Go To Market Strategy - 2030
Export potential enables firms to identify high-growth global markets with greater confidence by combining advanced trade intelligence with a structured quantitative methodology. The framework analyzes emerging demand trends and country-level import patterns while integrating macroeconomic and trade datasets such as GDP and population forecasts, bilateral import–export flows, tariff structures, elasticity differentials between developed and developing economies, geographic distance, and import demand projections. Using weighted trade values from 2020–2024 as the base period to project country-to-country export potential for 2030, these inputs are operationalized through calculated drivers such as gravity model parameters, tariff impact factors, and projected GDP per-capita growth. Through an analysis of hidden potentials, demand hotspots, and market conditions that are most favorable to success, this method enables firms to focus on target countries, maximize returns, and global expansion with data, backed by accuracy.
By factoring in the projected importer demand gap that is currently unmet and could be potential opportunity, it identifies the potential for the Exporter (Country) among 190 countries, against the general trade analysis, which identifies the biggest importer or exporter.
To discover high-growth global markets and optimize your business strategy:
Click Here
Pricing
- Single User License$ 1,995
- Department License$ 2,400
- Site License$ 3,120
- Global License$ 3,795

Leadership Perspectives from Industry Events
Search
Thought Leadership and Analyst Meet


Our Clients
6WResearch In News
- India Air Conditioner Market Set for Strong Rebound in 2026 After Weather-Led Correction and GST-Driven Recovery: 6Wresearch
- ADAS in India: How Automatic Emergency Braking, Blind Spot Detection & Driver Monitoring are Transforming Road Safety
- Doha a strategic location for EV manufacturing hub: IPA Qatar
- Demand for luxury TVs surging in the GCC, says Samsung
- Empowering Growth: The Thriving Journey of Bangladesh’s Cable Industry
- Demand for luxury TVs surging in the GCC, says Samsung
Latest Reports
- Nicaragua RPG Gaming Market (2026-2032)
- New Zealand RPG Gaming Market (2026-2032)
- Netherlands RPG Gaming Market (2026-2032)
- Nauru RPG Gaming Market (2026-2032)
- Namibia RPG Gaming Market (2026-2032)
- Mozambique RPG Gaming Market (2026-2032)
- Montenegro RPG Gaming Market (2026-2032)
- Mongolia RPG Gaming Market (2026-2032)
- Monaco RPG Gaming Market (2026-2032)
- Micronesia RPG Gaming Market (2026-2032)
Industry Events and Analyst Meet

EV India Expo 2026

HIMTEX 2026

India Refining Summit 2026

India EV Show 2026

EV tech India Expo 2026
Whitepaper
- Middle East & Africa Commercial Security Market Click here to view more.
- Middle East & Africa Fire Safety Systems & Equipment Market Click here to view more.
- GCC Drone Market Click here to view more.
- Middle East Lighting Fixture Market Click here to view more.
- GCC Physical & Perimeter Security Market Click here to view more.