Brazil Chemical Packaging Market (2026-2032) | Value, Outlook, Growth, Share, Revenue, Size, Industry, Analysis, Forecast, Companies & Trends
Market Forecast By Product Types (Sacks, Drums, FIBC, Other), By Applications (Pharmaceutical Factory, Laboratory, Chemical Plant, Others) And Competitive Landscape
| Product Code: ETC006862 | Publication Date: Sep 2020 | Updated Date: Jun 2026 | Product Type: Report | |
| Publisher: 6Wresearch | Author: Ravi Bhandari | No. of Pages: 70 | No. of Figures: 35 | No. of Tables: 5 |
Brazil Chemical Packaging Market Summary
The brazil chemical packaging market was estimated at USD 155 Million in 2025 and is projected to reach USD 184 Million by 2032, growing at a CAGR of 2.5% from 2026 to 2032.
Brazil Chemical Packaging Market Growth Rate Analysis (2021-2032)
The Brazil chemical packaging market has shown a notable recovery after experiencing a decline of -1.6% in 2021, primarily due to pandemic-related disruptions. The resurgence continued into 2022 with a robust growth of 5.4%, fueled by increasing consumer demand and investments in sustainable packaging solutions. This upward trend has stabilized, with growth rates projected at 3.8% for both 2023 and 2024, supported by advancements in technology and infrastructure. As the market shifts towards eco-friendly alternatives, anticipated growth of 4.5% in 2025 reflects a strong response to energy transition efforts. However, growth is expected to moderate to around 2.5% by 2026, influenced by market maturation and evolving regulatory pressures.
Brazil Chemical Packaging Market Year-wise Growth Rate and Key Drivers
This graph highlights how the Brazil Chemical Packaging Market has steadily grown over the past five years, supported by major growth factors.
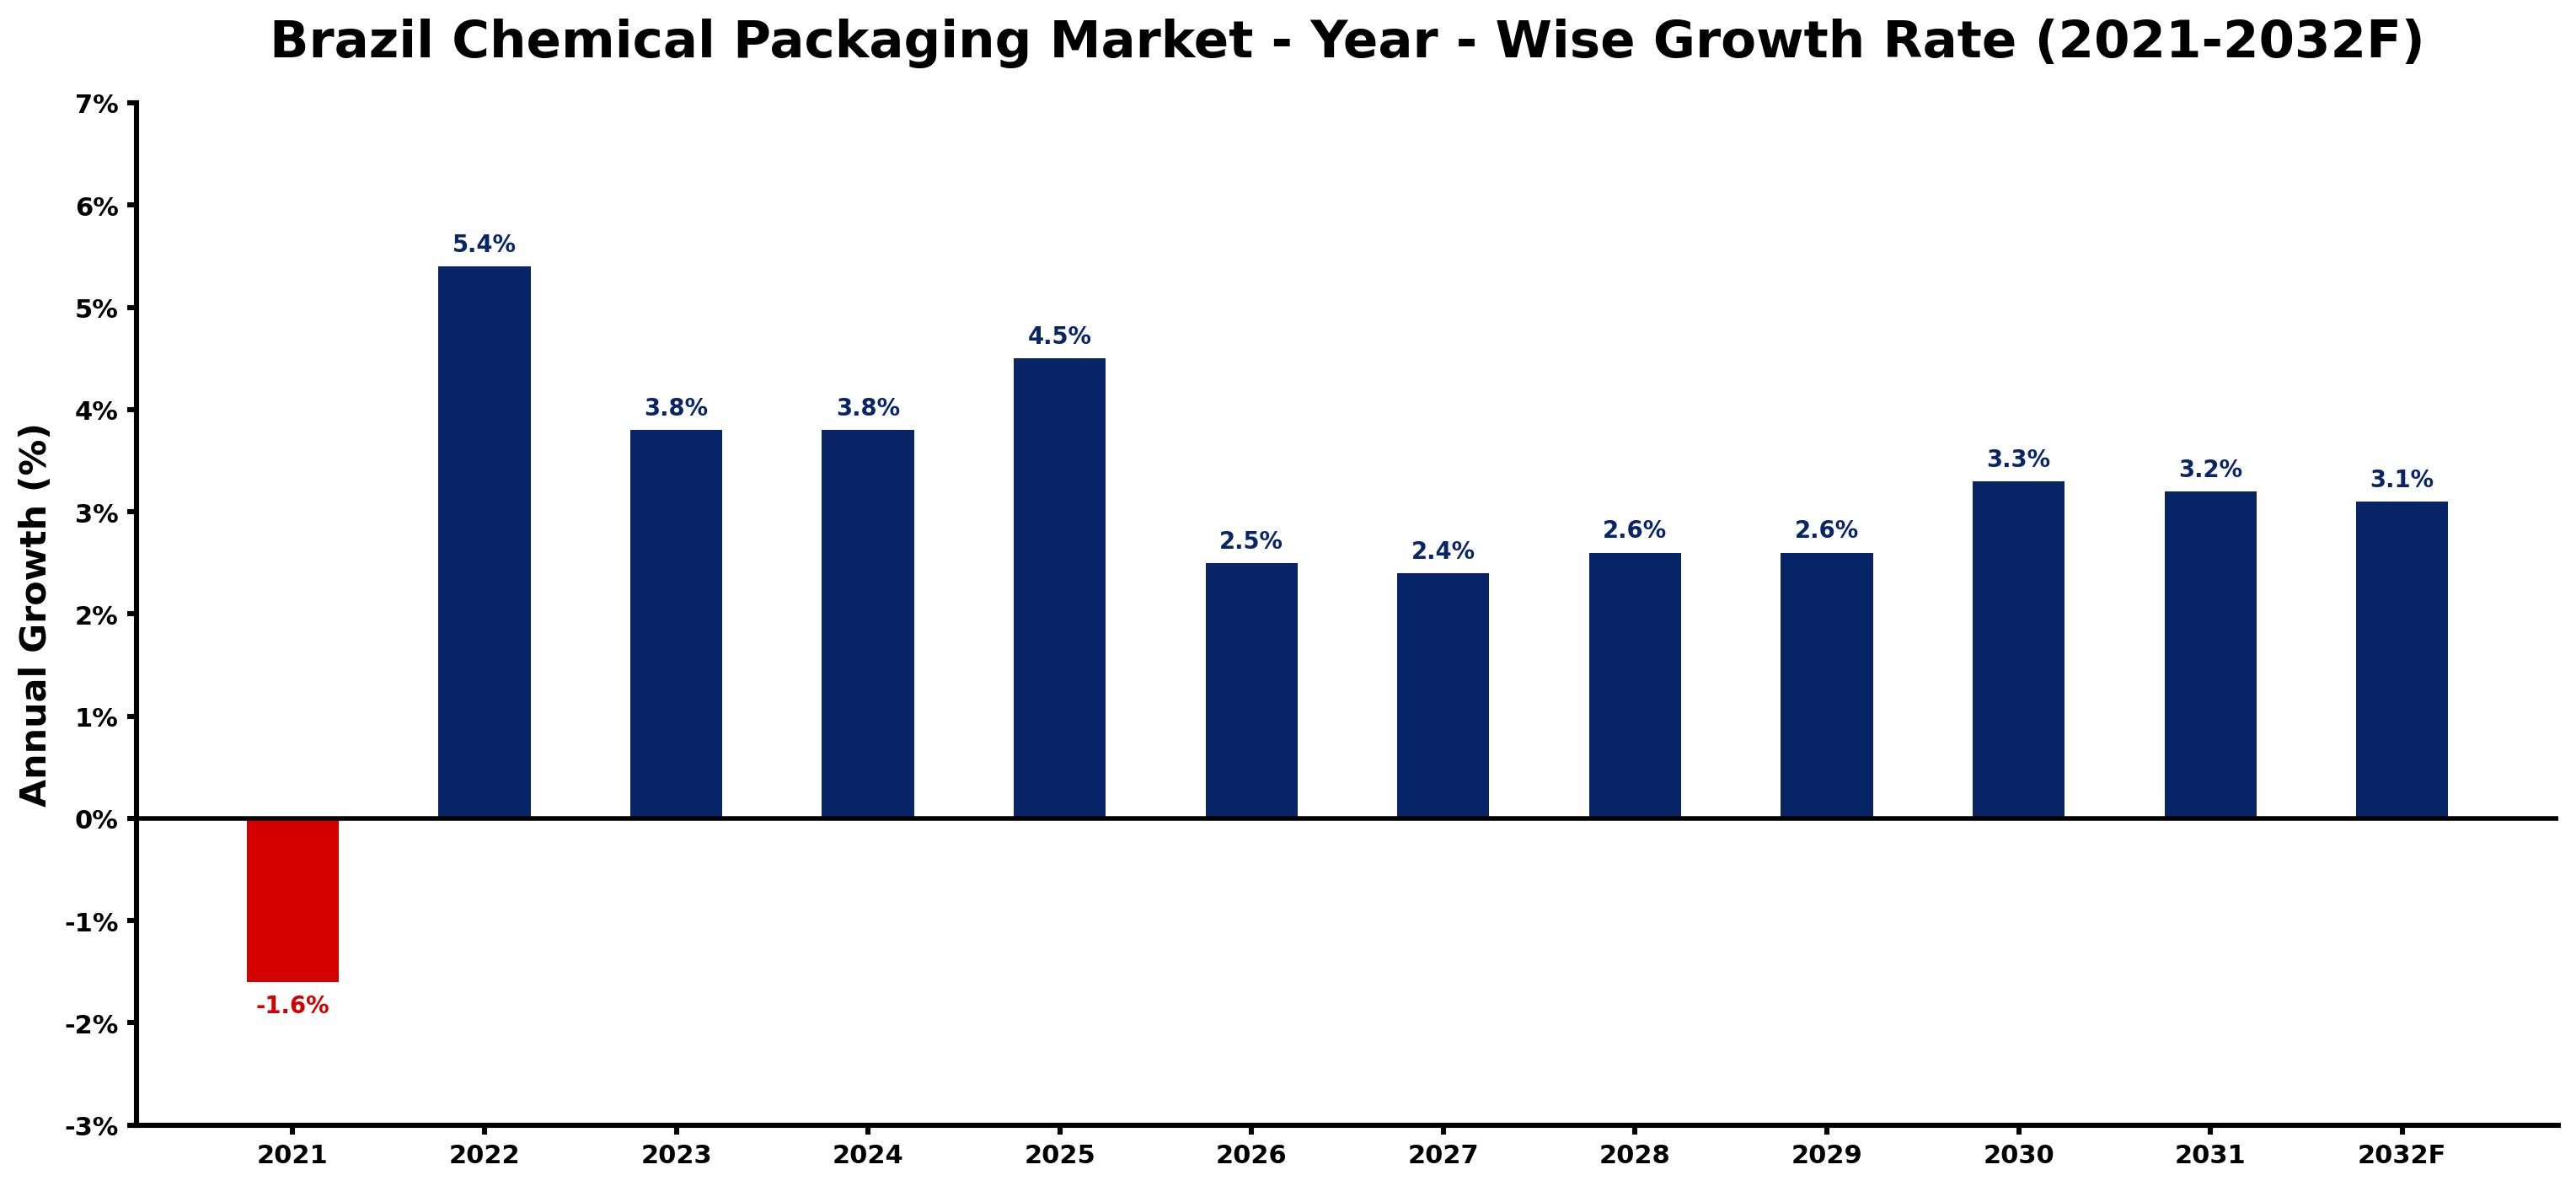
The table below presents the year wise growth rates along with the key drivers influencing the market
| Year | Growth Rate | Major Drivers |
| 2021 | -1.6% | Supply chain disruptions stemming from the pandemic hindered timely delivery of chemical packaging materials. |
| 2022 | 5.4% | Local manufacturers focus on eco-friendly alternatives to meet consumer sustainability preferences. |
| 2023 | 3.8% | Emerging startups pioneer innovative packaging designs to address waste management challenges. |
| 2024 | 3.8% | Global brands entering Brazil highlight the importance of compliant packaging regulations. |
| 2025 | 4.5% | Technological innovations in polymer production enhance the quality of chemical packaging materials. |
| 2026 | 2.5% | Supply chain disruptions prompt companies to reassess sourcing and production practices. |
| 2027 | 2.4% | Consumer preferences shift toward convenience, driving demand for flexible packaging options. |
| 2028 | 2.6% | Collaboration between packaging firms and tech companies fosters advanced recycling solutions. |
| 2029 | 2.6% | E-commerce growth necessitates robust packaging that ensures product safety during transit. |
| 2030 | 3.3% | Rising awareness of environmental impacts pushes companies to adopt circular economy principles. |
| 2031 | 3.2% | Investment in regional production facilities reduces dependency on international supply chains. |
| 2032 | 3.1% | Market consolidation leads to enhanced innovation as companies seek competitive advantages. |
Note - Market size estimations and growth projections presented in this report are based on 6Wresearch's advanced forecasting approach, validated with industry datasets as of June 2026.
Brazil Chemical Packaging Market Synopsis
The Brazil Chemical Packaging Market is projected to reach 2.5% and witness significant growth during the forecast period (2026-2032). As a critical segment of the country's thriving chemical industry, the chemical packaging sector serves an essential role in ensuring the safe storage and transportation of various chemical products. The interplay of stringent regulatory frameworks and the demand for innovative packaging solutions has shaped this market into a dynamic landscape. Companies are increasingly focused on developing packaging that not only meets safety and compliance standards but also aligns with environmental sustainability goals.
Brazil Chemical Packaging Market Growth Drivers
The growth trajectory of the Brazil Chemical Packaging Market is closely tied to the expanding chemical industry. Several key drivers are fueling this growth:
- The increasing production of chemical products necessitates robust packaging solutions that guarantee the integrity and safety during transportation and storage.
- Stringent regulations regarding the packaging of hazardous materials compel companies to invest in specialized packaging that adheres to safety standards.
- The ongoing shift toward eco-friendly packaging solutions aligns with global sustainability trends, pushing businesses to innovate in packaging materials.
- The rise in e-commerce and logistics demands efficient and secure packaging that can withstand varying conditions during shipping.
- Technological advancements in packaging materials and designs enhance product protection, thus boosting market demand.
Brazil Chemical Packaging Market Challenges and Restraints
Despite its potential, the Brazil Chemical Packaging Market faces several challenges that could hinder growth:
- Compliance with ever-evolving regulations regarding hazardous materials can be burdensome for businesses, requiring constant updates and adaptations.
- The cost of implementing innovative packaging solutions often poses a financial challenge, particularly for smaller players in the market.
- Ensuring compatibility between various packaging materials and diverse chemical substances remains a critical concern, impacting product safety.
- The need for continuous innovation in response to environmental sustainability concerns can divert resources away from operational efficiencies.
- The economic volatility in Brazil may affect the investment capabilities of companies, thus impacting the pace of technological advancements.
Brazil Chemical Packaging Market Government Investment and Initiatives
Government policies play a significant role in shaping the Brazil Chemical Packaging Market. The Brazilian government is committed to ensuring the safety of chemical handling and transportation through stringent regulations. Some notable initiatives include:
- The establishment of safety and environmental protection regulations that govern the chemical packaging sector, ensuring worker safety and reducing environmental risks.
- Public spending on infrastructure improvements to facilitate the safe transportation of chemical products across various regions.
- Incentives for companies that adopt advanced packaging technologies, promoting innovations that enhance safety and sustainability.
- Collaboration with industry stakeholders to develop better enforcement mechanisms for existing regulations, thus fostering compliance.
- Support for research and development initiatives focused on sustainable packaging solutions, aiming to align the sector with global environmental standards.
Brazil Chemical Packaging Market Latest Developments (May 2025 - June 2026)
In the period from May 2025 to June 2026, the Brazil Chemical Packaging Market has witnessed several noteworthy developments that are shaping its future direction:
- Increased investments in sustainable packaging technologies, driven by both consumer demand and regulatory pressure, have resulted in a surge of eco-friendly product offerings.
- New partnerships have emerged between packaging innovators and chemical companies to develop hybrid packaging solutions that address safety and sustainability simultaneously.
- Regulatory bodies have intensified their focus on compliance enforcement, leading to heightened scrutiny of packaging processes within the chemical industry.
- Research initiatives aimed at enhancing the recyclability of chemical packaging materials have gained momentum, reflecting a broader transition to a circular economy.
- Technological advancements in smart packaging solutions, such as real-time tracking and monitoring systems, have seen increased adoption within the market, enhancing safety and efficiency.
Brazil Chemical Packaging Market - Key Attractiveness of the Report
- 10 Years of Market Numbers
- Historical Data Starting from 2022 to 2025
- Base Year: 2025
- Forecast Data until 2032
- Key Performance Indicators Impacting the Market
- Major Upcoming Developments and Projects
Key Highlights of the Report:
- Brazil Chemical Packaging Market Outlook
- Market Size of Brazil Chemical Packaging Market, 2025
- Forecast of Brazil Chemical Packaging Market, 2032
- Historical Data and Forecast of Brazil Chemical Packaging Revenues & Volume for the Period 2022-2032F
- Brazil Chemical Packaging Market Trend Evolution
- Brazil Chemical Packaging Market Drivers and Challenges
- Brazil Chemical Packaging Price Trends
- Brazil Chemical Packaging Porter's Five Forces
- Brazil Chemical Packaging Industry Life Cycle
- Historical Data and Forecast of Brazil Chemical Packaging Market Revenues & Volume By Product Types for the Period 2022-2032F
- Historical Data and Forecast of Brazil Chemical Packaging Market Revenues & Volume By Sacks for the Period 2022-2032F
- Historical Data and Forecast of Brazil Chemical Packaging Market Revenues & Volume By Drums for the Period 2022-2032F
- Historical Data and Forecast of Brazil Chemical Packaging Market Revenues & Volume By FIBC for the Period 2022-2032F
- Historical Data and Forecast of Brazil Chemical Packaging Market Revenues & Volume By Other for the Period 2022-2032F
- Historical Data and Forecast of Brazil Chemical Packaging Market Revenues & Volume By Applications for the Period 2022-2032F
- Historical Data and Forecast of Brazil Chemical Packaging Market Revenues & Volume By Pharmaceutical Factory? for the Period 2022-2032F
- Historical Data and Forecast of Brazil Chemical Packaging Market Revenues & Volume By Laboratory for the Period 2022-2032F
- Historical Data and Forecast of Brazil Chemical Packaging Market Revenues & Volume By Chemical Plant? for the Period 2022-2032F
- Historical Data and Forecast of Brazil Chemical Packaging Market Revenues & Volume By Others for the Period 2022-2032F
- Brazil Chemical Packaging Import Export Trade Statistics
- Market Opportunity Assessment By Product Types
- Market Opportunity Assessment By Applications
- Brazil Chemical Packaging Top Companies Market Share
- Brazil Chemical Packaging Competitive Benchmarking By Technical and Operational Parameters
- Brazil Chemical Packaging Company Profiles
- Brazil Chemical Packaging Key Strategic Recommendations
Frequently Asked Questions About the Market Study (FAQs):
The growth rate is closely tied to the expansion of the chemical industry and adherence to safety standards, driven by demand for innovative and compliant packaging solutions.
Government regulations enforce safety, environmental protection, and compliance, thereby influencing the types of packaging solutions developed by companies operating in the sector.
Companies face challenges such as compliance with regulatory changes, cost management associated with innovative packaging solutions, and the need for sustainable materials.
6Wresearch actively monitors the Brazil Chemical Packaging Market and publishes its comprehensive annual report, highlighting emerging trends, growth drivers, revenue analysis, and forecast outlook. Our insights help businesses to make data-backed strategic decisions with ongoing market dynamics. Our analysts track relevent industries related to the Brazil Chemical Packaging Market, allowing our clients with actionable intelligence and reliable forecasts tailored to emerging regional needs.
Yes, we provide customisation as per your requirements. To learn more, feel free to contact us on sales@6wresearch.com
1 Executive Summary |
2 Introduction |
2.1 Key Highlights of the Report |
2.2 Report Description |
2.3 Market Scope & Segmentation |
2.4 Research Methodology |
2.5 Assumptions |
3 Brazil Chemical Packaging Market Overview |
3.1 Brazil Country Macro Economic Indicators |
3.2 Brazil Chemical Packaging Market Revenues & Volume, 2022 & 2032F |
3.3 Brazil Chemical Packaging Market - Industry Life Cycle |
3.4 Brazil Chemical Packaging Market - Porter's Five Forces |
3.5 Brazil Chemical Packaging Market Revenues & Volume Share, By Product Types, 2022 & 2032F |
3.6 Brazil Chemical Packaging Market Revenues & Volume Share, By Applications, 2022 & 2032F |
4 Brazil Chemical Packaging Market Dynamics |
4.1 Impact Analysis |
4.2 Market Drivers |
4.2.1 Growing demand for sustainable and eco-friendly packaging solutions in the chemical industry. |
4.2.2 Increasing focus on product safety and regulations driving the need for secure chemical packaging. |
4.2.3 Expansion of the chemical industry in Brazil leading to higher demand for packaging solutions. |
4.3 Market Restraints |
4.3.1 Fluctuating raw material prices impacting the cost of chemical packaging. |
4.3.2 Stringent regulatory requirements for packaging materials affecting the market dynamics. |
5 Brazil Chemical Packaging Market Trends |
6 Brazil Chemical Packaging Market, By Types |
6.1 Brazil Chemical Packaging Market, By Product Types |
6.1.1 Overview and Analysis |
6.1.2 Brazil Chemical Packaging Market Revenues & Volume, By Product Types, 2022-2032F |
6.1.3 Brazil Chemical Packaging Market Revenues & Volume, By Sacks, 2022-2032F |
6.1.4 Brazil Chemical Packaging Market Revenues & Volume, By Drums, 2022-2032F |
6.1.5 Brazil Chemical Packaging Market Revenues & Volume, By FIBC, 2022-2032F |
6.1.6 Brazil Chemical Packaging Market Revenues & Volume, By Other, 2022-2032F |
6.2 Brazil Chemical Packaging Market, By Applications |
6.2.1 Overview and Analysis |
6.2.2 Brazil Chemical Packaging Market Revenues & Volume, By Pharmaceutical Factory , 2022-2032F |
6.2.3 Brazil Chemical Packaging Market Revenues & Volume, By Laboratory, 2022-2032F |
6.2.4 Brazil Chemical Packaging Market Revenues & Volume, By Chemical Plant , 2022-2032F |
6.2.5 Brazil Chemical Packaging Market Revenues & Volume, By Others, 2022-2032F |
7 Brazil Chemical Packaging Market Import-Export Trade Statistics |
7.1 Brazil Chemical Packaging Market Export to Major Countries |
7.2 Brazil Chemical Packaging Market Imports from Major Countries |
8 Brazil Chemical Packaging Market Key Performance Indicators |
8.1 Percentage of chemical manufacturers adopting sustainable packaging solutions. |
8.2 Number of new regulations impacting chemical packaging compliance. |
8.3 Growth rate of the chemical industry in Brazil. |
8.4 Innovation rate in chemical packaging materials and designs. |
8.5 Rate of investment in research and development for chemical packaging solutions. |
9 Brazil Chemical Packaging Market - Opportunity Assessment |
9.1 Brazil Chemical Packaging Market Opportunity Assessment, By Product Types, 2022 & 2032F |
9.2 Brazil Chemical Packaging Market Opportunity Assessment, By Applications, 2022 & 2032F |
10 Brazil Chemical Packaging Market - Competitive Landscape |
10.1 Brazil Chemical Packaging Market Revenue Share, By Companies, 2025 |
10.2 Brazil Chemical Packaging Market Competitive Benchmarking, By Operating and Technical Parameters |
11 Company Profiles |
12 Recommendations |
13 Disclaimer |
Global Go To Market Strategy - 2030
Export potential enables firms to identify high-growth global markets with greater confidence by combining advanced trade intelligence with a structured quantitative methodology. The framework analyzes emerging demand trends and country-level import patterns while integrating macroeconomic and trade datasets such as GDP and population forecasts, bilateral import–export flows, tariff structures, elasticity differentials between developed and developing economies, geographic distance, and import demand projections. Using weighted trade values from 2020–2024 as the base period to project country-to-country export potential for 2030, these inputs are operationalized through calculated drivers such as gravity model parameters, tariff impact factors, and projected GDP per-capita growth. Through an analysis of hidden potentials, demand hotspots, and market conditions that are most favorable to success, this method enables firms to focus on target countries, maximize returns, and global expansion with data, backed by accuracy.
By factoring in the projected importer demand gap that is currently unmet and could be potential opportunity, it identifies the potential for the Exporter (Country) among 190 countries, against the general trade analysis, which identifies the biggest importer or exporter.
To discover high-growth global markets and optimize your business strategy:
Click Here
Pricing
- Single User License$ 1,995
- Department License$ 2,400
- Site License$ 3,120
- Global License$ 3,795

Leadership Perspectives from Industry Events
Search
Thought Leadership and Analyst Meet


Our Clients
6WResearch In News
- India Air Conditioner Market Set for Strong Rebound in 2026 After Weather-Led Correction and GST-Driven Recovery: 6Wresearch
- ADAS in India: How Automatic Emergency Braking, Blind Spot Detection & Driver Monitoring are Transforming Road Safety
- Doha a strategic location for EV manufacturing hub: IPA Qatar
- Demand for luxury TVs surging in the GCC, says Samsung
- Empowering Growth: The Thriving Journey of Bangladesh’s Cable Industry
- Demand for luxury TVs surging in the GCC, says Samsung
Latest Reports
- Nicaragua RPG Gaming Market (2026-2032)
- New Zealand RPG Gaming Market (2026-2032)
- Netherlands RPG Gaming Market (2026-2032)
- Nauru RPG Gaming Market (2026-2032)
- Namibia RPG Gaming Market (2026-2032)
- Mozambique RPG Gaming Market (2026-2032)
- Montenegro RPG Gaming Market (2026-2032)
- Mongolia RPG Gaming Market (2026-2032)
- Monaco RPG Gaming Market (2026-2032)
- Micronesia RPG Gaming Market (2026-2032)
Industry Events and Analyst Meet

HIMTEX 2026

India Refining Summit 2026

India EV Show 2026

EV tech India Expo 2026

Auto Tech Asia 2026
Whitepaper
- Middle East & Africa Commercial Security Market Click here to view more.
- Middle East & Africa Fire Safety Systems & Equipment Market Click here to view more.
- GCC Drone Market Click here to view more.
- Middle East Lighting Fixture Market Click here to view more.
- GCC Physical & Perimeter Security Market Click here to view more.