United States (US) Chemical Packaging Market (2026-2032) | Industry, Revenue, Size, Growth, Analysis, Forecast, Companies, Outlook, Share, Value & Trends
Market Forecast By Product Types (Sacks, Drums, FIBC, Other), By Applications (Pharmaceutical Factory, Laboratory, Chemical Plant, Others) And Competitive Landscape
| Product Code: ETC006861 | Publication Date: Sep 2020 | Updated Date: Jun 2026 | Product Type: Report | |
| Publisher: 6Wresearch | Author: Sumit Sagar | No. of Pages: 70 | No. of Figures: 35 | No. of Tables: 5 |
United States (US) Chemical Packaging Market Summary
The united states (us) chemical packaging market was estimated at USD 242 Million in 2025 and is projected to reach USD 284 Million by 2032, growing at a CAGR of 2.7% from 2026 to 2032.
United States (US) Chemical Packaging Market Year-wise Growth Rate and Key Drivers
This graph highlights how the United States (US) Chemical Packaging Market has steadily grown over the past five years, supported by major growth factors.
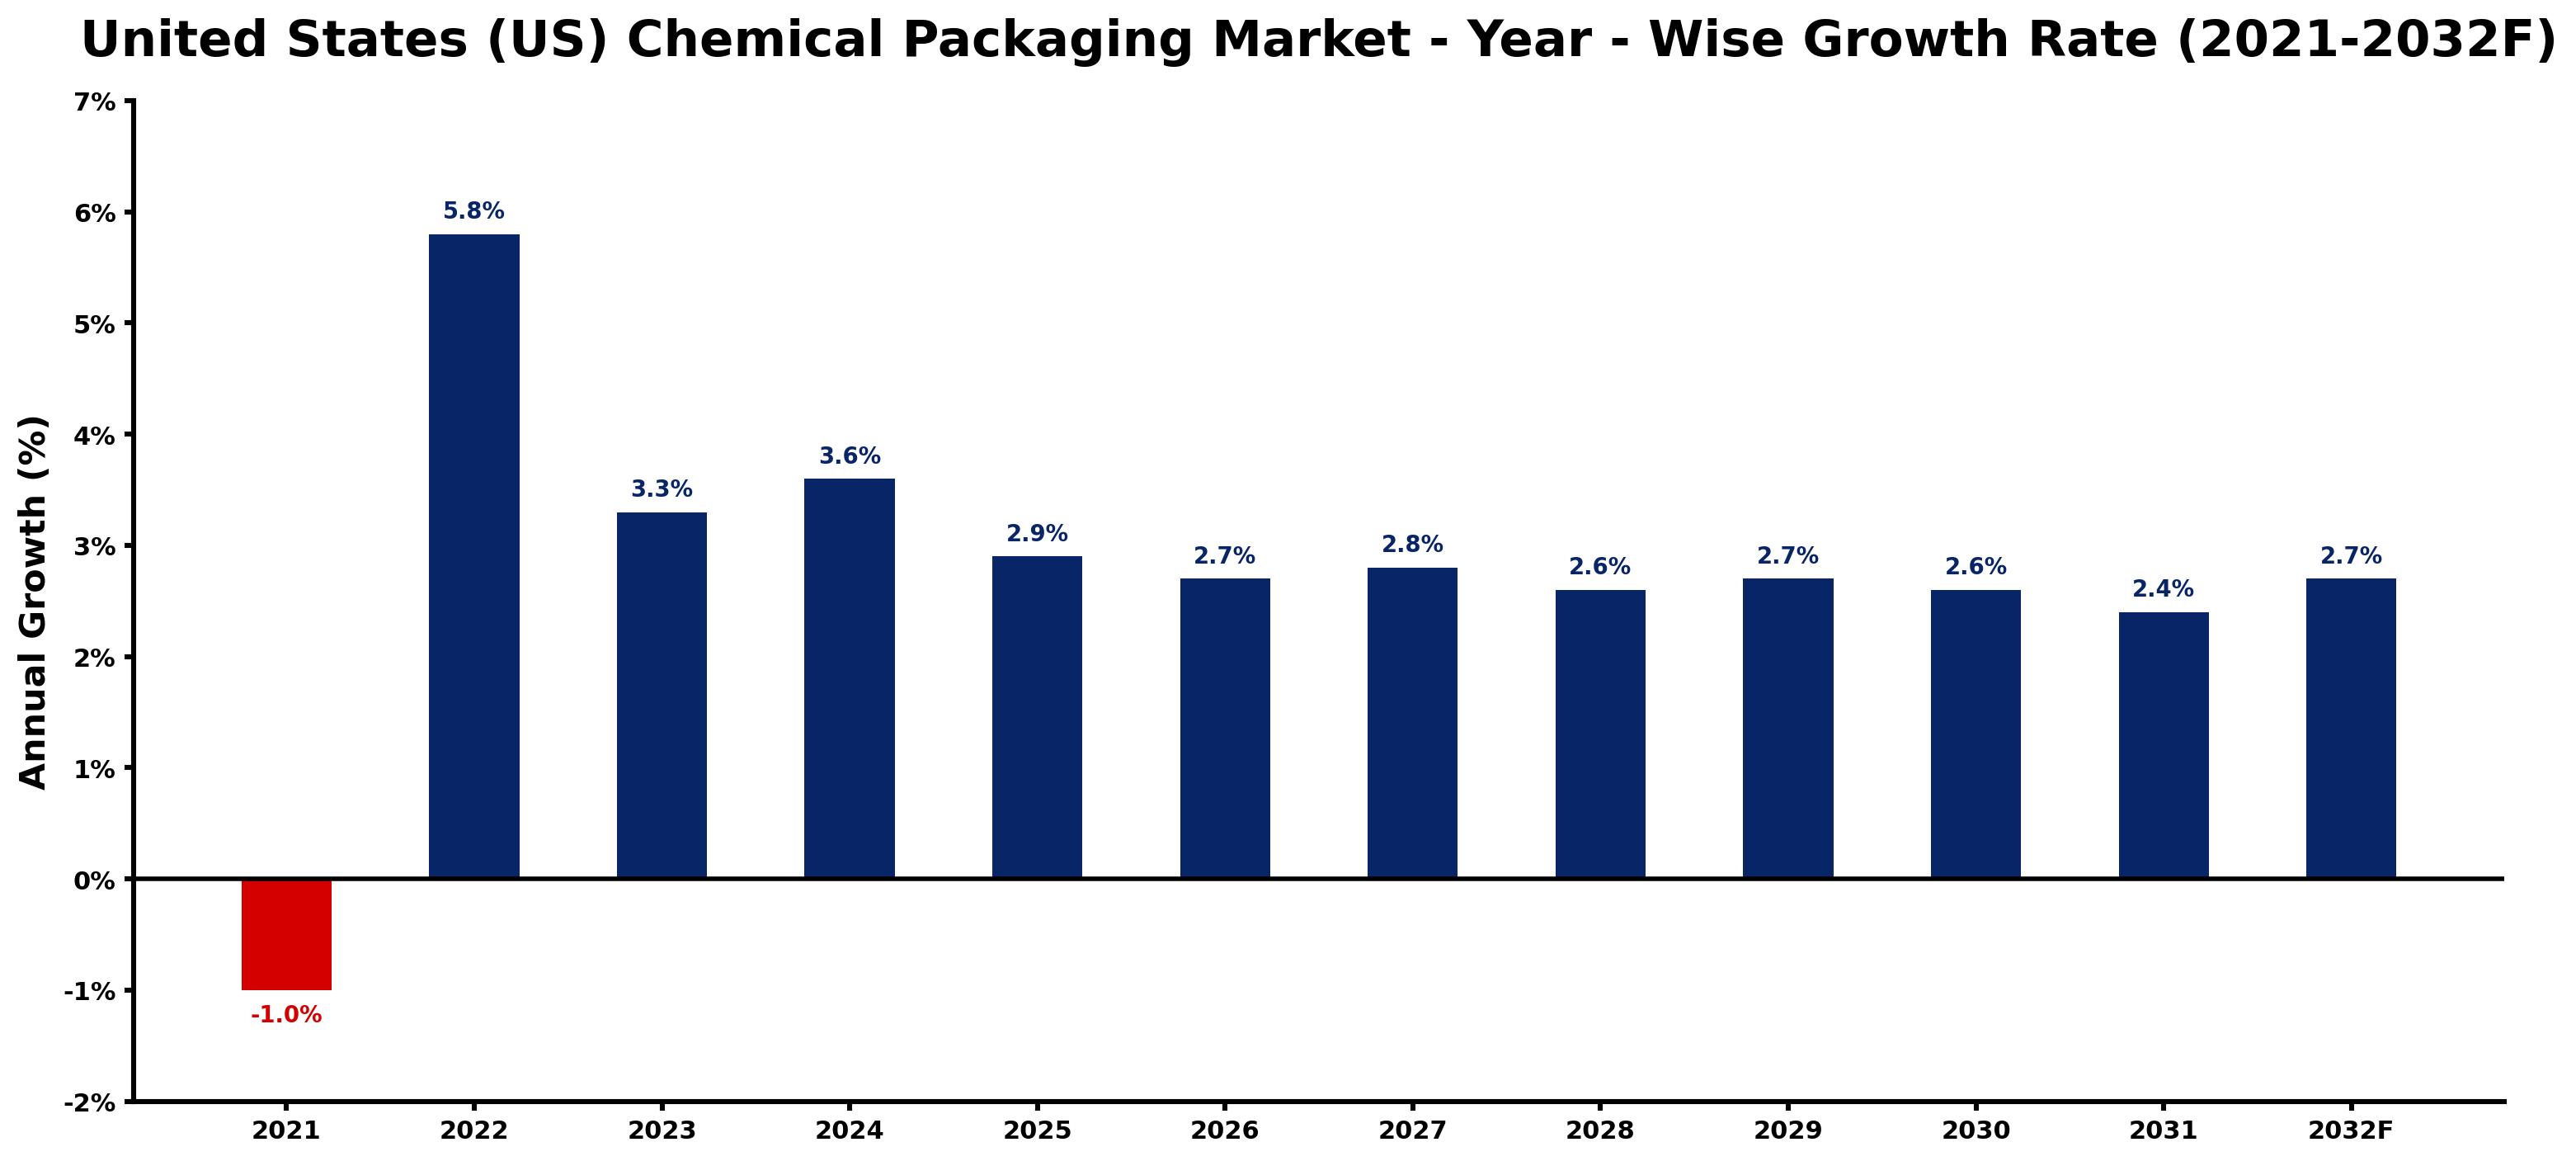
The table below presents the year wise growth rates along with the key drivers influencing the market
| Year | Growth Rate | Major Drivers |
| 2021 | -1.0% | Supply chain disruptions limited inventory availability, negatively impacting sales across the chemical packaging sector. |
| 2022 | 5.8% | Sustainability practices prompted companies to seek eco-friendly packaging alternatives in chemicals. |
| 2023 | 3.3% | Supply chain disruptions highlighted the importance of robust packaging materials for chemical safety. |
| 2024 | 3.6% | E-commerce expansion led to an increase in demand for chemical packaging logistics. |
| 2025 | 2.9% | Technological innovations in packaging design provided new opportunities for market differentiation. |
| 2026 | 2.7% | Collaborations between chemical manufacturers and packaging firms fostered customized solutions. |
| 2027 | 2.8% | Increased consumer awareness about hazardous materials emphasized the need for stringent packaging regulations. |
| 2028 | 2.6% | Emerging markets showed a growing appetite for specialty chemical products and packaging. |
| 2029 | 2.7% | Automation in production processes improved efficiency in chemical packaging operations. |
| 2030 | 2.6% | A shift toward circular economy principles influenced demand for reusable chemical packaging options. |
| 2031 | 2.4% | Market players focused on resilience strategies, optimizing supply chains for chemical packaging. |
| 2032 | 2.7% | Digital transformation initiatives led chemical companies to invest in smart packaging technologies. |
Note - Market size estimations and growth projections presented in this report are based on 6Wresearch's advanced forecasting approach, validated with industry datasets as of June 2026.
United States (US) Chemical Packaging Market Synopsis
The United States (US) Chemical Packaging Market is projected to reach 2.7% and witness significant growth during the forecast period (2026-2032). This market is characterized by an increasing demand for safe and reliable packaging solutions across various sectors, including pharmaceuticals, agriculture, and manufacturing. The need for robust packaging is primarily driven by stringent regulations governing the safe transport and storage of hazardous chemicals, compelling companies to invest in innovative materials and designs that enhance safety and compliance.
United States (US) Chemical Packaging Market Growth Drivers
Several factors are fueling the expansion of the United States (US) Chemical Packaging Market. The key growth drivers include:
- Regulatory Compliance: Stricter laws and guidelines mandated by federal agencies emphasize the necessity for safe packaging of hazardous chemicals, thereby driving demand for compliant packaging solutions.
- Sustainability Trends: There is a growing consumer and regulatory demand for eco-friendly packaging alternatives, leading to increased investments in recyclable and biodegradable materials.
- Technological Advancements: Innovations in packaging technology, including smart packaging solutions with features like RFID tracking, enhance product safety and supply chain efficiency.
- Expanding Chemical Industry: An increase in chemical production across various sectors boosts the need for effective packaging to accommodate diverse chemical formulations.
- Consumer Awareness: Heightened awareness regarding environmental issues is shifting preferences towards companies that prioritize sustainable packaging practices.
United States (US) Chemical Packaging Market Trends and Opportunities
The current landscape of the United States (US) Chemical Packaging Market is shaped by several transformative trends that create significant opportunities:
- Sustainable Packaging Solutions: The demand for eco-friendly packaging options is on the rise, with companies increasingly prioritizing materials that reduce environmental impact.
- Enhanced Safety Features: The market is witnessing a growing trend in packaging designs that prioritize consumer safety, such as child-resistant closures and tamper-evident seals.
- Customized Packaging: Tailored packaging solutions that meet specific regulatory and consumer needs are becoming more essential, presenting opportunities for innovation.
- Digital Integration: The integration of technology in packaging, such as IoT and tracking systems, is creating avenues for improving supply chain transparency and accountability.
- Market Consolidation: Mergers and acquisitions within the packaging sector can enhance operational capabilities and expand product offerings, providing a competitive advantage in the market.
United States (US) Chemical Packaging Market Challenges and Restraints
Despite its growth potential, the United States (US) Chemical Packaging Market faces several challenges that could hinder its progress:
- Regulatory Hurdles: Compliance with an increasingly complex array of regulations can be resource-intensive and may pose challenges for smaller companies.
- Environmental Concerns: Rising scrutiny over plastic waste and emissions requires continuous innovation in sustainable packaging alternatives.
- Raw Material Costs: Fluctuating prices of raw materials can impact production costs and price stability in the packaging sector.
- Competition: The market's competitive landscape necessitates constant innovation and efficiency to maintain a leading edge.
- Supply Chain Disruptions: Global supply chain challenges, exacerbated by recent events, can lead to delays and increased costs for packaging materials.
United States (US) Chemical Packaging Market Investment Opportunities
The United States (US) Chemical Packaging Market presents a wealth of investment opportunities for stakeholders looking to benefit from the evolving landscape:
- Innovative Material Development: Companies focused on developing sustainable and advanced packaging materials are well-positioned to capture market share.
- Customized Solutions Providers: Firms offering specialized packaging solutions tailored to the unique needs of different sectors can capitalize on growing demand.
- Tech-Enabled Packaging: Investment in companies that leverage technology for enhanced packaging solutions can yield significant returns as demand for smart packaging rises.
- Eco-Friendly Initiatives: Ventures that prioritize sustainability and eco-conscious practices are increasingly favored by both consumers and investors.
- Research and Development: Companies investing in R&D to drive innovation in chemical packaging solutions can take advantage of emerging trends and regulatory developments.
United States (US) Chemical Packaging Market Government Investment and Initiatives
Government policies and initiatives play a crucial role in shaping the United States (US) Chemical Packaging Market. Agencies such as the Environmental Protection Agency (EPA) enforce regulations to ensure safe packaging standards. Key regulatory frameworks include:
- The Toxic Substances Control Act (TSCA), which monitors the use of chemical substances in packaging materials.
- The Resource Conservation and Recovery Act (RCRA), which governs the disposal of hazardous waste, including packaging materials.
- The Federal Hazardous Substances Act (FHSA), mandating specific labeling and packaging standards for hazardous substances.
- Occupational Safety and Health Administration (OSHA) guidelines promote safe handling and storage practices for chemicals in the workplace.
- Incentives for sustainable practices encourage companies to adopt eco-friendly packaging solutions and reduce their environmental footprint.
United States (US) Chemical Packaging Market Latest Developments (May 2025 - June 2026)
Recent developments in the United States (US) Chemical Packaging Market indicate a significant shift toward sustainability and technological integration. During this period, companies have been increasingly focused on developing packaging solutions that meet stringent safety standards while also addressing environmental concerns. The trend toward smart packaging has gained momentum, with innovations aimed at enhancing supply chain transparency and product security. Regulatory bodies have continued to emphasize compliance, influencing companies to innovate while adapting to evolving regulations. Additionally, partnerships and collaborations within the industry have emerged as firms seek to leverage shared expertise and resources to enhance product offerings and sustainability efforts.
United States (US) Chemical Packaging Market - Key Attractiveness of the Report
- 10 Years of Market Numbers
- Historical Data Starting from 2022 to 2025
- Base Year: 2025
- Forecast Data until 2032
- Key Performance Indicators Impacting the Market
- Major Upcoming Developments and Projects
Key Highlights of the Report:
- United States (US) Chemical Packaging Market Outlook
- Market Size of United States (US) Chemical Packaging Market, 2025
- Forecast of United States (US) Chemical Packaging Market, 2032F
- Historical Data and Forecast of United States (US) Chemical Packaging Revenues & Volume for the Period 2022-2032F
- United States (US) Chemical Packaging Market Trend Evolution
- United States (US) Chemical Packaging Market Drivers and Challenges
- United States (US) Chemical Packaging Price Trends
- United States (US) Chemical Packaging Porter's Five Forces
- United States (US) Chemical Packaging Industry Life Cycle
- Historical Data and Forecast of United States (US) Chemical Packaging Market Revenues & Volume By Product Types for the Period 2022-2032F
- Historical Data and Forecast of United States (US) Chemical Packaging Market Revenues & Volume By Sacks for the Period 2022-2032F
- Historical Data and Forecast of United States (US) Chemical Packaging Market Revenues & Volume By Drums for the Period 2022-2032F
- Historical Data and Forecast of United States (US) Chemical Packaging Market Revenues & Volume By FIBC for the Period 2022-2032F
- Historical Data and Forecast of United States (US) Chemical Packaging Market Revenues & Volume By Other for the Period 2022-2032F
- Historical Data and Forecast of United States (US) Chemical Packaging Market Revenues & Volume By Applications for the Period 2022-2032F
- Historical Data and Forecast of United States (US) Chemical Packaging Market Revenues & Volume By Pharmaceutical Factory? for the Period 2022-2032F
- Historical Data and Forecast of United States (US) Chemical Packaging Market Revenues & Volume By Laboratory for the Period 2022-2032F
- Historical Data and Forecast of United States (US) Chemical Packaging Market Revenues & Volume By Chemical Plant? for the Period 2022-2032F
- Historical Data and Forecast of United States (US) Chemical Packaging Market Revenues & Volume By Others for the Period 2022-2032F
- United States (US) Chemical Packaging Import Export Trade Statistics
- Market Opportunity Assessment By Product Types
- Market Opportunity Assessment By Applications
- United States (US) Chemical Packaging Top Companies Market Share
- United States (US) Chemical Packaging Competitive Benchmarking By Technical and Operational Parameters
- United States (US) Chemical Packaging Company Profiles
- United States (US) Chemical Packaging Key Strategic Recommendations
Frequently Asked Questions About the Market Study (FAQs):
The growth of the US Chemical Packaging Market is primarily driven by stringent regulations, advancements in technology, and an increasing emphasis on sustainability and eco-friendliness in packaging solutions.
Key challenges include navigating complex regulatory frameworks, addressing environmental sustainability concerns, and managing fluctuating raw material costs amidst a competitive market landscape.
Innovations such as smart packaging technologies, sustainable materials, and customizable packaging solutions are shaping the future of the US Chemical Packaging Market, focusing on safety, compliance, and environmental impact.
Government regulations play a critical role in the US Chemical Packaging Market by establishing standards for safety and environmental protection, driving companies to invest in compliant and sustainable packaging solutions.
6Wresearch actively monitors the United States (US) Chemical Packaging Market and publishes its comprehensive annual report, highlighting emerging trends, growth drivers, revenue analysis, and forecast outlook. Our insights help businesses to make data-backed strategic decisions with ongoing market dynamics. Our analysts track relevent industries related to the United States (US) Chemical Packaging Market, allowing our clients with actionable intelligence and reliable forecasts tailored to emerging regional needs.
Yes, we provide customisation as per your requirements. To learn more, feel free to contact us on sales@6wresearch.com
1 Executive Summary |
2 Introduction |
2.1 Key Highlights of the Report |
2.2 Report Description |
2.3 Market Scope & Segmentation |
2.4 Research Methodology |
2.5 Assumptions |
3 United States (US) Chemical Packaging Market Overview |
3.1 United States (US) Country Macro Economic Indicators |
3.2 United States (US) Chemical Packaging Market Revenues & Volume, 2022 & 2032F |
3.3 United States (US) Chemical Packaging Market - Industry Life Cycle |
3.4 United States (US) Chemical Packaging Market - Porter's Five Forces |
3.5 United States (US) Chemical Packaging Market Revenues & Volume Share, By Product Types, 2022 & 2032F |
3.6 United States (US) Chemical Packaging Market Revenues & Volume Share, By Applications, 2022 & 2032F |
4 United States (US) Chemical Packaging Market Dynamics |
4.1 Impact Analysis |
4.2 Market Drivers |
4.2.1 Increasing demand for sustainable and eco-friendly packaging solutions in the chemical industry |
4.2.2 Growth in the chemical industry leading to higher demand for packaging solutions |
4.2.3 Innovation in packaging materials and technologies to enhance product safety and efficiency |
4.3 Market Restraints |
4.3.1 Stringent regulations and compliance requirements for chemical packaging materials |
4.3.2 Fluctuating raw material prices impacting packaging costs |
4.3.3 Competition from alternative packaging solutions such as bulk containers or reusable packaging options |
5 United States (US) Chemical Packaging Market Trends |
6 United States (US) Chemical Packaging Market, By Types |
6.1 United States (US) Chemical Packaging Market, By Product Types |
6.1.1 Overview and Analysis |
6.1.2 United States (US) Chemical Packaging Market Revenues & Volume, By Product Types, 2022-2032F |
6.1.3 United States (US) Chemical Packaging Market Revenues & Volume, By Sacks, 2022-2032F |
6.1.4 United States (US) Chemical Packaging Market Revenues & Volume, By Drums, 2022-2032F |
6.1.5 United States (US) Chemical Packaging Market Revenues & Volume, By FIBC, 2022-2032F |
6.1.6 United States (US) Chemical Packaging Market Revenues & Volume, By Other, 2022-2032F |
6.2 United States (US) Chemical Packaging Market, By Applications |
6.2.1 Overview and Analysis |
6.2.2 United States (US) Chemical Packaging Market Revenues & Volume, By Pharmaceutical Factory , 2022-2032F |
6.2.3 United States (US) Chemical Packaging Market Revenues & Volume, By Laboratory, 2022-2032F |
6.2.4 United States (US) Chemical Packaging Market Revenues & Volume, By Chemical Plant , 2022-2032F |
6.2.5 United States (US) Chemical Packaging Market Revenues & Volume, By Others, 2022-2032F |
7 United States (US) Chemical Packaging Market Import-Export Trade Statistics |
7.1 United States (US) Chemical Packaging Market Export to Major Countries |
7.2 United States (US) Chemical Packaging Market Imports from Major Countries |
8 United States (US) Chemical Packaging Market Key Performance Indicators |
8.1 Percentage of chemical companies adopting sustainable packaging solutions |
8.2 Number of new product launches in the chemical packaging sector |
8.3 Rate of investment in research and development for packaging innovations |
8.4 Compliance rate with safety and regulatory standards for chemical packaging |
8.5 Customer satisfaction scores related to packaging quality and performance |
9 United States (US) Chemical Packaging Market - Opportunity Assessment |
9.1 United States (US) Chemical Packaging Market Opportunity Assessment, By Product Types, 2022 & 2032F |
9.2 United States (US) Chemical Packaging Market Opportunity Assessment, By Applications, 2022 & 2032F |
10 United States (US) Chemical Packaging Market - Competitive Landscape |
10.1 United States (US) Chemical Packaging Market Revenue Share, By Companies, 2025 |
10.2 United States (US) Chemical Packaging Market Competitive Benchmarking, By Operating and Technical Parameters |
11 Company Profiles |
12 Recommendations |
13 Disclaimer |
Global Go To Market Strategy - 2030
Export potential enables firms to identify high-growth global markets with greater confidence by combining advanced trade intelligence with a structured quantitative methodology. The framework analyzes emerging demand trends and country-level import patterns while integrating macroeconomic and trade datasets such as GDP and population forecasts, bilateral import–export flows, tariff structures, elasticity differentials between developed and developing economies, geographic distance, and import demand projections. Using weighted trade values from 2020–2024 as the base period to project country-to-country export potential for 2030, these inputs are operationalized through calculated drivers such as gravity model parameters, tariff impact factors, and projected GDP per-capita growth. Through an analysis of hidden potentials, demand hotspots, and market conditions that are most favorable to success, this method enables firms to focus on target countries, maximize returns, and global expansion with data, backed by accuracy.
By factoring in the projected importer demand gap that is currently unmet and could be potential opportunity, it identifies the potential for the Exporter (Country) among 190 countries, against the general trade analysis, which identifies the biggest importer or exporter.
To discover high-growth global markets and optimize your business strategy:
Click Here
Pricing
- Single User License$ 1,995
- Department License$ 2,400
- Site License$ 3,120
- Global License$ 3,795

Leadership Perspectives from Industry Events
Search
Thought Leadership and Analyst Meet


Our Clients
6WResearch In News
- India Air Conditioner Market Set for Strong Rebound in 2026 After Weather-Led Correction and GST-Driven Recovery: 6Wresearch
- ADAS in India: How Automatic Emergency Braking, Blind Spot Detection & Driver Monitoring are Transforming Road Safety
- Doha a strategic location for EV manufacturing hub: IPA Qatar
- Demand for luxury TVs surging in the GCC, says Samsung
- Empowering Growth: The Thriving Journey of Bangladesh’s Cable Industry
- Demand for luxury TVs surging in the GCC, says Samsung
Latest Reports
- Nicaragua RPG Gaming Market (2026-2032)
- New Zealand RPG Gaming Market (2026-2032)
- Netherlands RPG Gaming Market (2026-2032)
- Nauru RPG Gaming Market (2026-2032)
- Namibia RPG Gaming Market (2026-2032)
- Mozambique RPG Gaming Market (2026-2032)
- Montenegro RPG Gaming Market (2026-2032)
- Mongolia RPG Gaming Market (2026-2032)
- Monaco RPG Gaming Market (2026-2032)
- Micronesia RPG Gaming Market (2026-2032)
Industry Events and Analyst Meet

EV India Expo 2026

HIMTEX 2026

India Refining Summit 2026

India EV Show 2026

EV tech India Expo 2026
Whitepaper
- Middle East & Africa Commercial Security Market Click here to view more.
- Middle East & Africa Fire Safety Systems & Equipment Market Click here to view more.
- GCC Drone Market Click here to view more.
- Middle East Lighting Fixture Market Click here to view more.
- GCC Physical & Perimeter Security Market Click here to view more.