Australia Chemical Packaging Market (2026-2032) | Growth, Analysis, Value, Industry, Forecast, Trends, Revenue, Share, Outlook, Size & Companies
Market Forecast By Product Types (Sacks, Drums, FIBC, Other), By Applications (Pharmaceutical Factory, Laboratory, Chemical Plant, Others) And Competitive Landscape
| Product Code: ETC006895 | Publication Date: Sep 2020 | Updated Date: Jun 2026 | Product Type: Report | |
| Publisher: 6Wresearch | Author: Ravi Bhandari | No. of Pages: 70 | No. of Figures: 35 | No. of Tables: 5 |
Australia Chemical Packaging Market Summary
The australia chemical packaging market was estimated at USD 101 Million in 2025 and is projected to reach USD 118 Million by 2032, growing at a CAGR of 2.7% from 2026 to 2032.
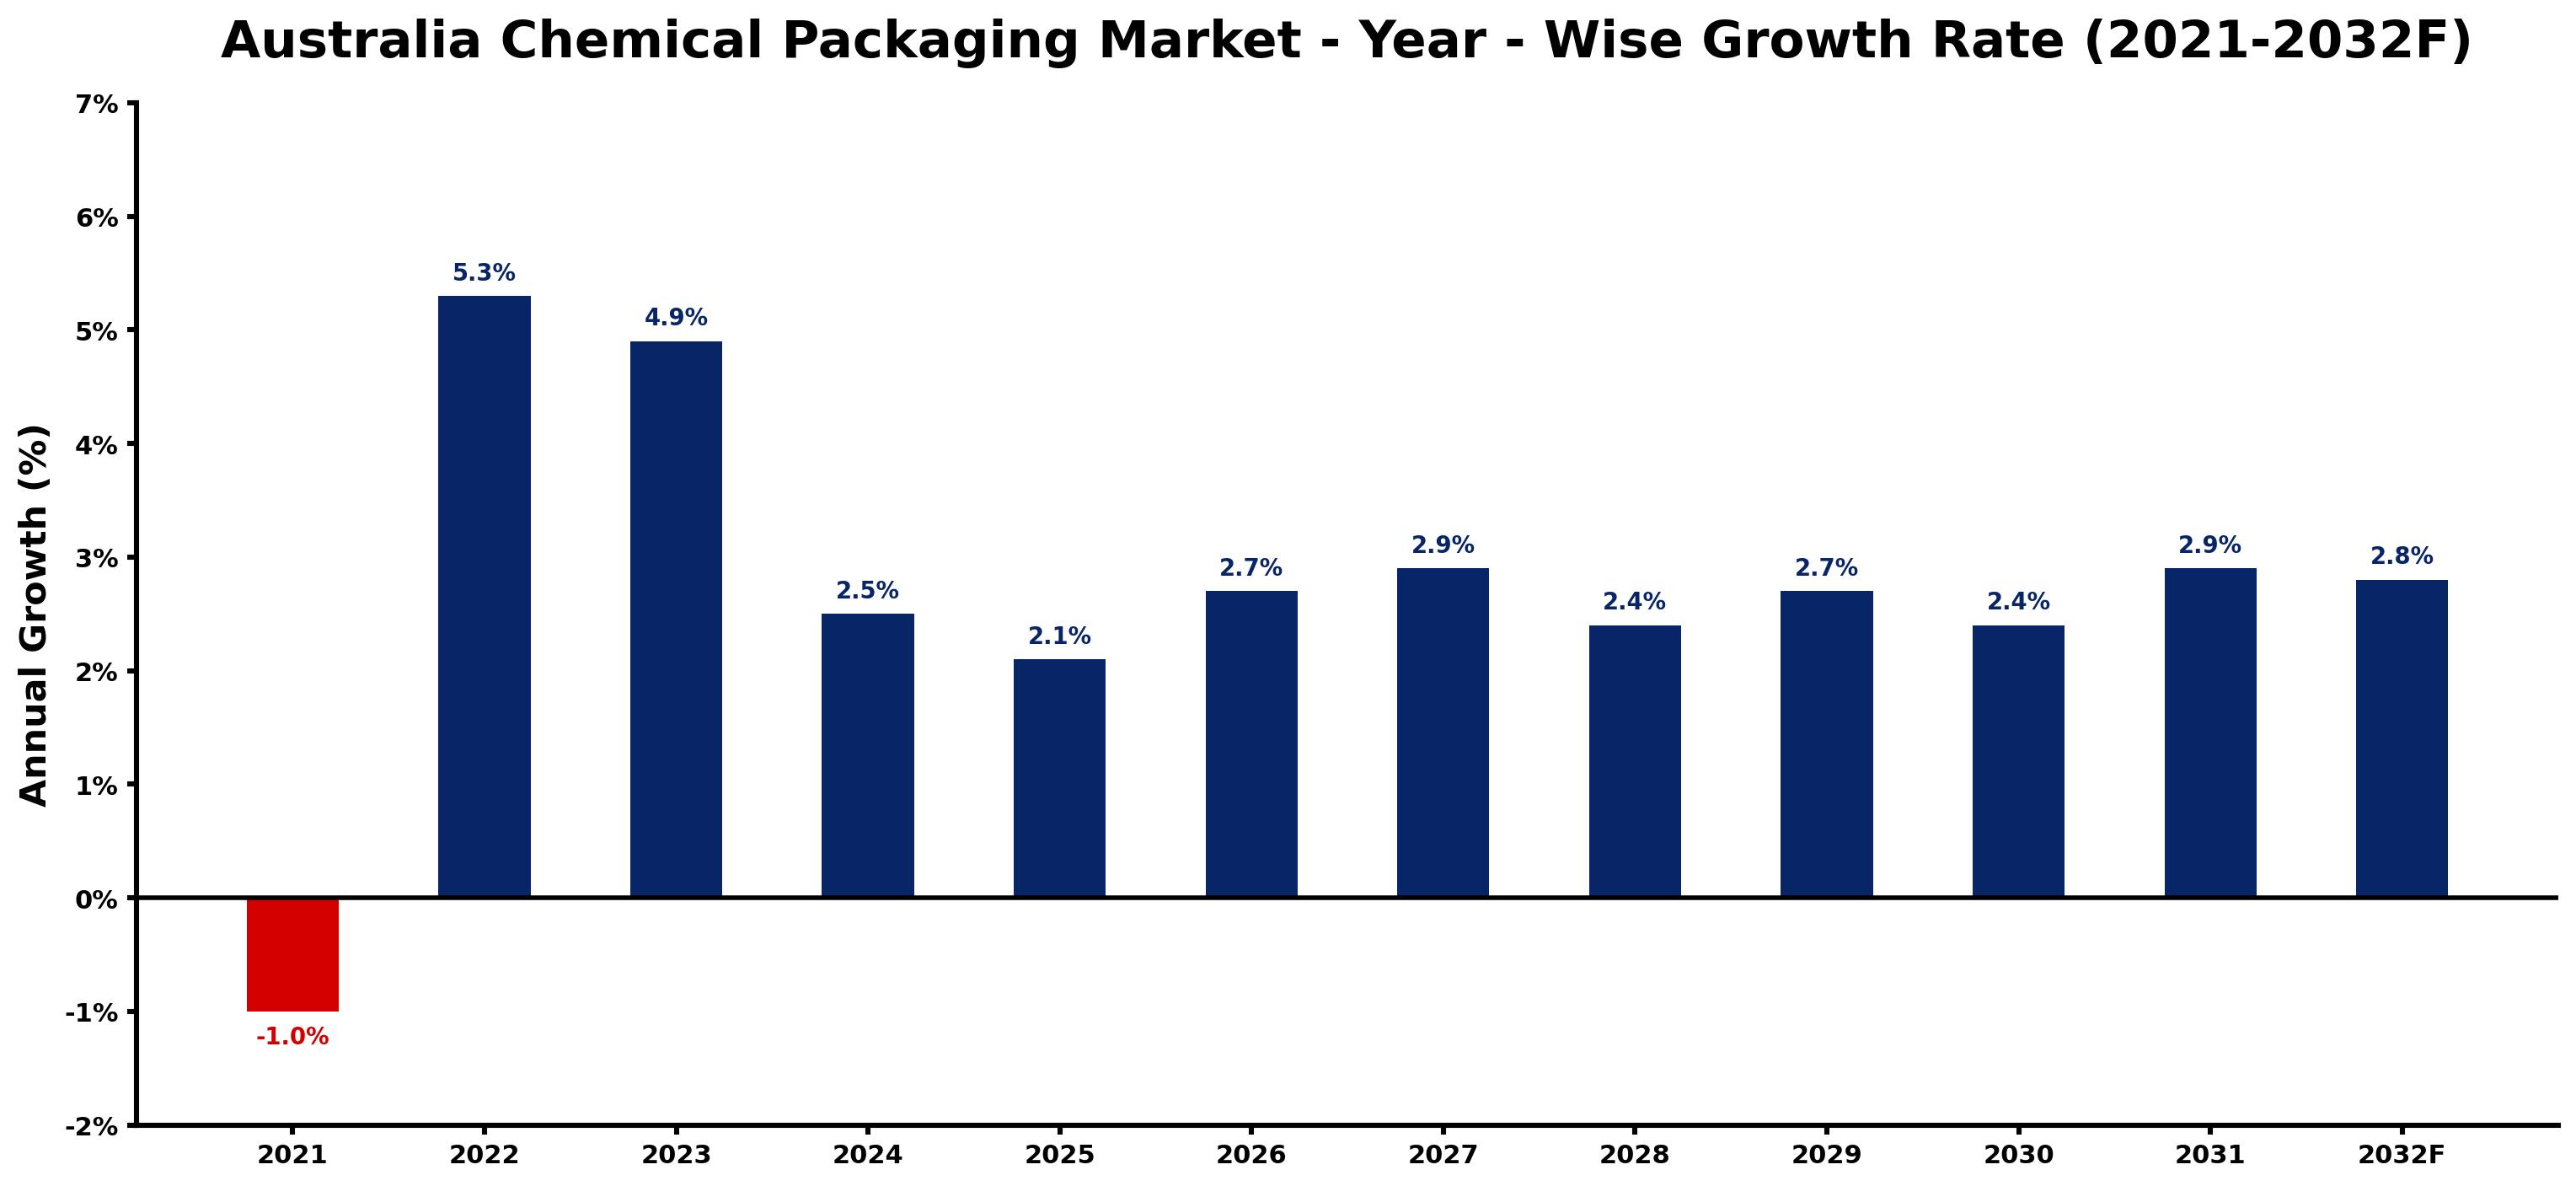
Australia Chemical Packaging Market Growth Rate Analysis (2021-2032)
The Australian Chemical Packaging Market exhibited a notable recovery following a slight decline of 1.0% in 2021, rebounding with growth rates of 5.3% in 2022 and 4.9% in 2023. This resurgence is largely driven by rising consumer demand for sustainable and efficient packaging solutions, alongside increased investments in advanced materials and technology uptake. From 2024 onwards, the market is expected to stabilize, showcasing steady growth rates around 2.5% to 2.9% through 2032. Continued focus on energy transition, regulatory advancements, and infrastructure upgrades further support this positive trend, positioning the sector for sustained development in the coming years.
Australia Chemical Packaging Market Year-wise Growth Rate and Key Drivers
This graph highlights how the Australia Chemical Packaging Market has steadily grown over the past five years, supported by major growth factors.
The table below presents the year wise growth rates along with the key drivers influencing the market
| Year | Growth Rate | Major Drivers |
| 2021 | -1.0% | Supply chain disruptions from the pandemic led to increased costs and product shortages in chemical packaging. |
| 2022 | 5.3% | Increased focus on supply chain resilience stimulates demand for robust packaging solutions. |
| 2023 | 4.9% | Shift towards e-commerce necessitates innovative packaging designs for chemical safety during transit. |
| 2024 | 2.5% | The construction sector's expansion increases the need for specialized chemical packaging applications. |
| 2025 | 2.1% | The surge in pharmaceutical production drives requirements for sterile and compliant packaging solutions. |
| 2026 | 2.7% | Technological innovations enhance production efficiency, enabling companies to diversify packaging materials. |
| 2027 | 2.9% | Growing awareness of hazardous materials influences stricter standards for packaging safety measures. |
| 2028 | 2.4% | Investments in renewable energy projects create demand for eco-conscious chemical packaging options. |
| 2029 | 2.7% | The rise of smart packaging technology offers enhanced tracking and monitoring capabilities. |
| 2030 | 2.4% | Corporate sustainability goals encourage chemical companies to transition to biodegradable packaging materials. |
| 2031 | 2.9% | Increased global partnerships elevate the complexity and variety of chemical packaging needs. |
| 2032 | 2.8% | A shift towards circular economy practices drives the development of reusable packaging systems. |
Note - Market size estimations and growth projections presented in this report are based on 6Wresearch's advanced forecasting approach, validated with industry datasets as of June 2026.
Australia Chemical Packaging Market Synopsis
The Australia Chemical Packaging Market is projected to reach 2.7% and witness significant growth during the forecast period (2026-2032). This market encompasses a comprehensive range of packaging solutions designed specifically for the storage, transportation, and distribution of various chemicals, solvents, and hazardous substances. Effective chemical packaging solutions are crucial for ensuring compliance with safety regulations, preventing leaks, and maintaining product integrity throughout the supply chain. With an increasing emphasis on material compatibility, sustainability, and regulatory adherence, suppliers within Australia are addressing the diverse needs of multiple industries in this sector.
Australia Chemical Packaging Market Growth Drivers
The growth of the Australia Chemical Packaging Market can be attributed to several key factors:
- The rising demand for safe and reliable chemical packaging solutions is largely driven by heightened awareness around safety standards in chemical handling and transportation.
- Stringent regulatory requirements for the handling of hazardous materials compel businesses to invest in compliant packaging solutions that mitigate risks associated with chemical exposure and environmental contamination.
- The ongoing expansion of the chemical industry within Australia, including pharmaceuticals, agriculture, and manufacturing, necessitates robust packaging solutions to ensure product safety and quality during distribution.
- A growing focus on sustainability is propelling the demand for innovative packaging materials that minimize environmental impact while ensuring regulatory compliance.
- As supply chains become more complex, the need for efficient and environmentally friendly packaging options is becoming increasingly important for competitive advantage.
Australia Chemical Packaging Market Challenges and Restraints
While the market is poised for growth, several challenges must be navigated:
- Ensuring compatibility between packaging materials and various hazardous chemicals is critical, as improper compatibility can lead to product degradation and safety risks.
- Meeting rigorous regulatory requirements for labeling, safety data sheets, and transportation can be daunting for many companies, particularly smaller enterprises.
- Sustainability concerns, particularly regarding plastic waste and recycling practices, present ongoing challenges that require innovative solutions from packaging manufacturers.
- Fluctuations in raw material prices can impact packaging costs, making it challenging for manufacturers to maintain stable pricing while adhering to quality standards.
- The increasing complexity of supply chains necessitates advancements in packaging technology and materials to enhance safety, efficiency, and sustainability.
Australia Chemical Packaging Market Government Investment and Initiatives
The Australian government plays a vital role in shaping the chemical packaging landscape through various policies and initiatives aimed at promoting sustainability and safety:
- Implementation of packaging waste management programs to reduce environmental impacts associated with chemical packaging materials is a primary focus of government initiatives.
- Promotion of recyclable and biodegradable materials is encouraged through incentives for companies adopting sustainable practices within their packaging systems.
- Standardization of packaging requirements to improve labeling transparency is being pursued to enhance compliance and consumer confidence in chemical packaging solutions.
- Government funding for research and development initiatives aimed at creating innovative and eco-friendly packaging solutions contributes to the growth of the industry.
- Incentives for businesses to invest in advanced packaging technology and processes are often provided to drive improvements in safety and environmental performance.
Australia Chemical Packaging Market Latest Developments (May 2025 - June 2026)
Recent developments within the Australia Chemical Packaging Market from May 2025 to June 2026 highlight a trend towards increased innovation and compliance within the sector:
- A notable shift towards the adoption of advanced materials and technologies that enhance the safety and integrity of chemical packaging solutions has been observed.
- Growing partnerships between chemical manufacturers and packaging suppliers signal a commitment to developing tailored solutions that address specific industry needs.
- Sustainability initiatives are gaining traction, with many companies adopting greener practices and exploring alternatives to traditional plastic packaging.
- Investment in digital tracking technologies is becoming more prevalent, allowing for improved supply chain transparency and enhanced safety measures.
- Regulatory updates are driving changes in labeling practices, ensuring that consumers have better access to important safety information regarding chemical products.
Australia Chemical Packaging Market - Key Attractiveness of the Report
- 10 Years of Market Numbers
- Historical Data Starting from 2022 to 2025
- Base Year: 2025
- Forecast Data until 2032
- Key Performance Indicators Impacting the Market
- Major Upcoming Developments and Projects
Key Highlights of the Report:
- Australia Chemical Packaging Market Outlook
- Market Size of Australia Chemical Packaging Market, 2025
- Forecast of Australia Chemical Packaging Market, 2032
- Historical Data and Forecast of Australia Chemical Packaging Revenues & Volume for the Period 2022-2032F
- Australia Chemical Packaging Market Trend Evolution
- Australia Chemical Packaging Market Drivers and Challenges
- Australia Chemical Packaging Price Trends
- Australia Chemical Packaging Porter's Five Forces
- Australia Chemical Packaging Industry Life Cycle
- Historical Data and Forecast of Australia Chemical Packaging Market Revenues & Volume By Product Types for the Period 2022-2032F
- Historical Data and Forecast of Australia Chemical Packaging Market Revenues & Volume By Sacks for the Period 2022-2032F
- Historical Data and Forecast of Australia Chemical Packaging Market Revenues & Volume By Drums for the Period 2022-2032F
- Historical Data and Forecast of Australia Chemical Packaging Market Revenues & Volume By FIBC for the Period 2022-2032F
- Historical Data and Forecast of Australia Chemical Packaging Market Revenues & Volume By Other for the Period 2022-2032F
- Historical Data and Forecast of Australia Chemical Packaging Market Revenues & Volume By Applications for the Period 2022-2032F
- Historical Data and Forecast of Australia Chemical Packaging Market Revenues & Volume By Pharmaceutical Factory? for the Period 2022-2032F
- Historical Data and Forecast of Australia Chemical Packaging Market Revenues & Volume By Laboratory for the Period 2022-2032F
- Historical Data and Forecast of Australia Chemical Packaging Market Revenues & Volume By Chemical Plant? for the Period 2022-2032F
- Historical Data and Forecast of Australia Chemical Packaging Market Revenues & Volume By Others for the Period 2022-2032F
- Australia Chemical Packaging Import Export Trade Statistics
- Market Opportunity Assessment By Product Types
- Market Opportunity Assessment By Applications
- Australia Chemical Packaging Top Companies Market Share
- Australia Chemical Packaging Competitive Benchmarking By Technical and Operational Parameters
- Australia Chemical Packaging Company Profiles
- Australia Chemical Packaging Key Strategic Recommendations
Frequently Asked Questions About the Market Study (FAQs):
The growth is driven by increasing demand for safe packaging solutions, stringent regulatory requirements, and a robust chemical industry.
Challenges include ensuring compatibility between packaging materials and chemicals, meeting regulatory requirements, and addressing sustainability concerns.
The government supports the sector through waste management programs, incentives for sustainable practices, and regulatory frameworks that promote safety and environmental compliance.
Latest trends include a shift towards sustainable materials, enhanced safety technologies, and improved regulatory compliance in labeling practices.
6Wresearch actively monitors the Australia Chemical Packaging Market and publishes its comprehensive annual report, highlighting emerging trends, growth drivers, revenue analysis, and forecast outlook. Our insights help businesses to make data-backed strategic decisions with ongoing market dynamics. Our analysts track relevent industries related to the Australia Chemical Packaging Market, allowing our clients with actionable intelligence and reliable forecasts tailored to emerging regional needs.
Yes, we provide customisation as per your requirements. To learn more, feel free to contact us on sales@6wresearch.com
1 Executive Summary |
2 Introduction |
2.1 Key Highlights of the Report |
2.2 Report Description |
2.3 Market Scope & Segmentation |
2.4 Research Methodology |
2.5 Assumptions |
3 Australia Chemical Packaging Market Overview |
3.1 Australia Country Macro Economic Indicators |
3.2 Australia Chemical Packaging Market Revenues & Volume, 2022 & 2032F |
3.3 Australia Chemical Packaging Market - Industry Life Cycle |
3.4 Australia Chemical Packaging Market - Porter's Five Forces |
3.5 Australia Chemical Packaging Market Revenues & Volume Share, By Product Types, 2022 & 2032F |
3.6 Australia Chemical Packaging Market Revenues & Volume Share, By Applications, 2022 & 2032F |
4 Australia Chemical Packaging Market Dynamics |
4.1 Impact Analysis |
4.2 Market Drivers |
4.2.1 Increasing demand for sustainable and eco-friendly packaging solutions in the chemical industry. |
4.2.2 Growth in the chemical manufacturing sector in Australia. |
4.2.3 Stringent regulations regarding packaging safety and labeling in the chemical industry. |
4.3 Market Restraints |
4.3.1 Fluctuating raw material prices impacting packaging production costs. |
4.3.2 Intense competition among packaging manufacturers in the chemical sector. |
4.3.3 Volatility in the global economy affecting export and import of chemical products. |
5 Australia Chemical Packaging Market Trends |
6 Australia Chemical Packaging Market, By Types |
6.1 Australia Chemical Packaging Market, By Product Types |
6.1.1 Overview and Analysis |
6.1.2 Australia Chemical Packaging Market Revenues & Volume, By Product Types, 2022-2032F |
6.1.3 Australia Chemical Packaging Market Revenues & Volume, By Sacks, 2022-2032F |
6.1.4 Australia Chemical Packaging Market Revenues & Volume, By Drums, 2022-2032F |
6.1.5 Australia Chemical Packaging Market Revenues & Volume, By FIBC, 2022-2032F |
6.1.6 Australia Chemical Packaging Market Revenues & Volume, By Other, 2022-2032F |
6.2 Australia Chemical Packaging Market, By Applications |
6.2.1 Overview and Analysis |
6.2.2 Australia Chemical Packaging Market Revenues & Volume, By Pharmaceutical Factory , 2022-2032F |
6.2.3 Australia Chemical Packaging Market Revenues & Volume, By Laboratory, 2022-2032F |
6.2.4 Australia Chemical Packaging Market Revenues & Volume, By Chemical Plant , 2022-2032F |
6.2.5 Australia Chemical Packaging Market Revenues & Volume, By Others, 2022-2032F |
7 Australia Chemical Packaging Market Import-Export Trade Statistics |
7.1 Australia Chemical Packaging Market Export to Major Countries |
7.2 Australia Chemical Packaging Market Imports from Major Countries |
8 Australia Chemical Packaging Market Key Performance Indicators |
8.1 Percentage of recycled materials used in chemical packaging. |
8.2 Compliance rate with packaging safety regulations. |
8.3 Number of new product innovations in chemical packaging. |
8.4 Carbon footprint reduction initiatives in chemical packaging production. |
8.5 Customer satisfaction levels with the durability and effectiveness of chemical packaging solutions. |
9 Australia Chemical Packaging Market - Opportunity Assessment |
9.1 Australia Chemical Packaging Market Opportunity Assessment, By Product Types, 2022 & 2032F |
9.2 Australia Chemical Packaging Market Opportunity Assessment, By Applications, 2022 & 2032F |
10 Australia Chemical Packaging Market - Competitive Landscape |
10.1 Australia Chemical Packaging Market Revenue Share, By Companies, 2025 |
10.2 Australia Chemical Packaging Market Competitive Benchmarking, By Operating and Technical Parameters |
11 Company Profiles |
12 Recommendations |
13 Disclaimer |
Global Go To Market Strategy - 2030
Export potential enables firms to identify high-growth global markets with greater confidence by combining advanced trade intelligence with a structured quantitative methodology. The framework analyzes emerging demand trends and country-level import patterns while integrating macroeconomic and trade datasets such as GDP and population forecasts, bilateral import–export flows, tariff structures, elasticity differentials between developed and developing economies, geographic distance, and import demand projections. Using weighted trade values from 2020–2024 as the base period to project country-to-country export potential for 2030, these inputs are operationalized through calculated drivers such as gravity model parameters, tariff impact factors, and projected GDP per-capita growth. Through an analysis of hidden potentials, demand hotspots, and market conditions that are most favorable to success, this method enables firms to focus on target countries, maximize returns, and global expansion with data, backed by accuracy.
By factoring in the projected importer demand gap that is currently unmet and could be potential opportunity, it identifies the potential for the Exporter (Country) among 190 countries, against the general trade analysis, which identifies the biggest importer or exporter.
To discover high-growth global markets and optimize your business strategy:
Click Here
Pricing
- Single User License$ 1,995
- Department License$ 2,400
- Site License$ 3,120
- Global License$ 3,795

Leadership Perspectives from Industry Events
Search
Thought Leadership and Analyst Meet


Our Clients
6WResearch In News
- India Air Conditioner Market Set for Strong Rebound in 2026 After Weather-Led Correction and GST-Driven Recovery: 6Wresearch
- ADAS in India: How Automatic Emergency Braking, Blind Spot Detection & Driver Monitoring are Transforming Road Safety
- Doha a strategic location for EV manufacturing hub: IPA Qatar
- Demand for luxury TVs surging in the GCC, says Samsung
- Empowering Growth: The Thriving Journey of Bangladesh’s Cable Industry
- Demand for luxury TVs surging in the GCC, says Samsung
Latest Reports
- Poland Fire Protection Systems Market (2026-2032)
- Cape Verde Portable Hand-Thrown Extinguisher Market (2026-2032)
- Canada Portable Hand-Thrown Extinguisher Market (2026-2032)
- Cameroon Portable Hand-Thrown Extinguisher Market (2026-2032)
- Burundi Portable Hand-Thrown Extinguisher Market (2026-2032)
- Burkina Faso Portable Hand-Thrown Extinguisher Market (2026-2032)
- Bulgaria Portable Hand-Thrown Extinguisher Market (2026-2032)
- Brunei Portable Hand-Thrown Extinguisher Market (2026-2032)
- Botswana Portable Hand-Thrown Extinguisher Market (2026-2032)
- Bosnia and Herzegovina Portable Hand-Thrown Extinguisher Market (2026-2032)
Industry Events and Analyst Meet

HIMTEX 2026

India Refining Summit 2026

India EV Show 2026

EV tech India Expo 2026

Auto Tech Asia 2026
Whitepaper
- Middle East & Africa Commercial Security Market Click here to view more.
- Middle East & Africa Fire Safety Systems & Equipment Market Click here to view more.
- GCC Drone Market Click here to view more.
- Middle East Lighting Fixture Market Click here to view more.
- GCC Physical & Perimeter Security Market Click here to view more.