Brazil Chemotherapy Market (2026-2032) | Share, Forecast, Value, Growth, Size, Outlook, Revenue, Trends, Industry, Companies & Analysis
Market Forecast By Drug Class (Alkylating Agents, Mitotic Inhibitors, Antimetabolites, Topoisomerase Inhibitors, Antitumor Antibiotic), By Indication (Lung Cancer, Breast Cancer, Colorectal Cancer, Prostate Cancer, Stomach Cancer, Lymphoma, Leukemia, Ovarian Cancer), By Route of Drug Administration (Intravenous, Oral, Subcutaneous, Intra-Muscular, Intravesicular, Topical, Intraperitoneal, Intraventricular/Intrathecal), By End-Users (Specialty Centers, Hospitals & Clinics) And Competitive Landscape
| Product Code: ETC044922 | Publication Date: Jan 2021 | Updated Date: Jun 2026 | Product Type: Report | |
| Publisher: 6Wresearch | Author: Ravi Bhandari | No. of Pages: 70 | No. of Figures: 35 | No. of Tables: 5 |
Brazil Chemotherapy Market Summary
The brazil chemotherapy market was estimated at USD 371 Million in 2025 and is projected to reach USD 443 Million by 2032, growing at a CAGR of 2.8% from 2026 to 2032.
Brazil Chemotherapy Market Growth Rate Analysis (2021-2032)
The Brazilian chemotherapy market has shown a noteworthy rebound after a challenging period, with growth rates fluctuating between -1.1% in 2021 and a peak of 5.2% in 2022. The increase since then can be attributed to enhanced healthcare infrastructure and rising consumer demand for advanced cancer treatments. In 2023, the market is projected to grow by 4.3%, as investments in biopharmaceutical innovations and robust public health policies continue to support this upward trend. However, growth is expected to moderate slightly, with projections of 2.8% to 3.2% from 2026 to 2032, reflecting a stabilized landscape amid evolving treatment protocols and increased competition in the sector.
Brazil Chemotherapy Market Year-wise Growth Rate and Key Drivers
This graph highlights how the Brazil Chemotherapy Market has steadily grown over the past five years, supported by major growth factors.
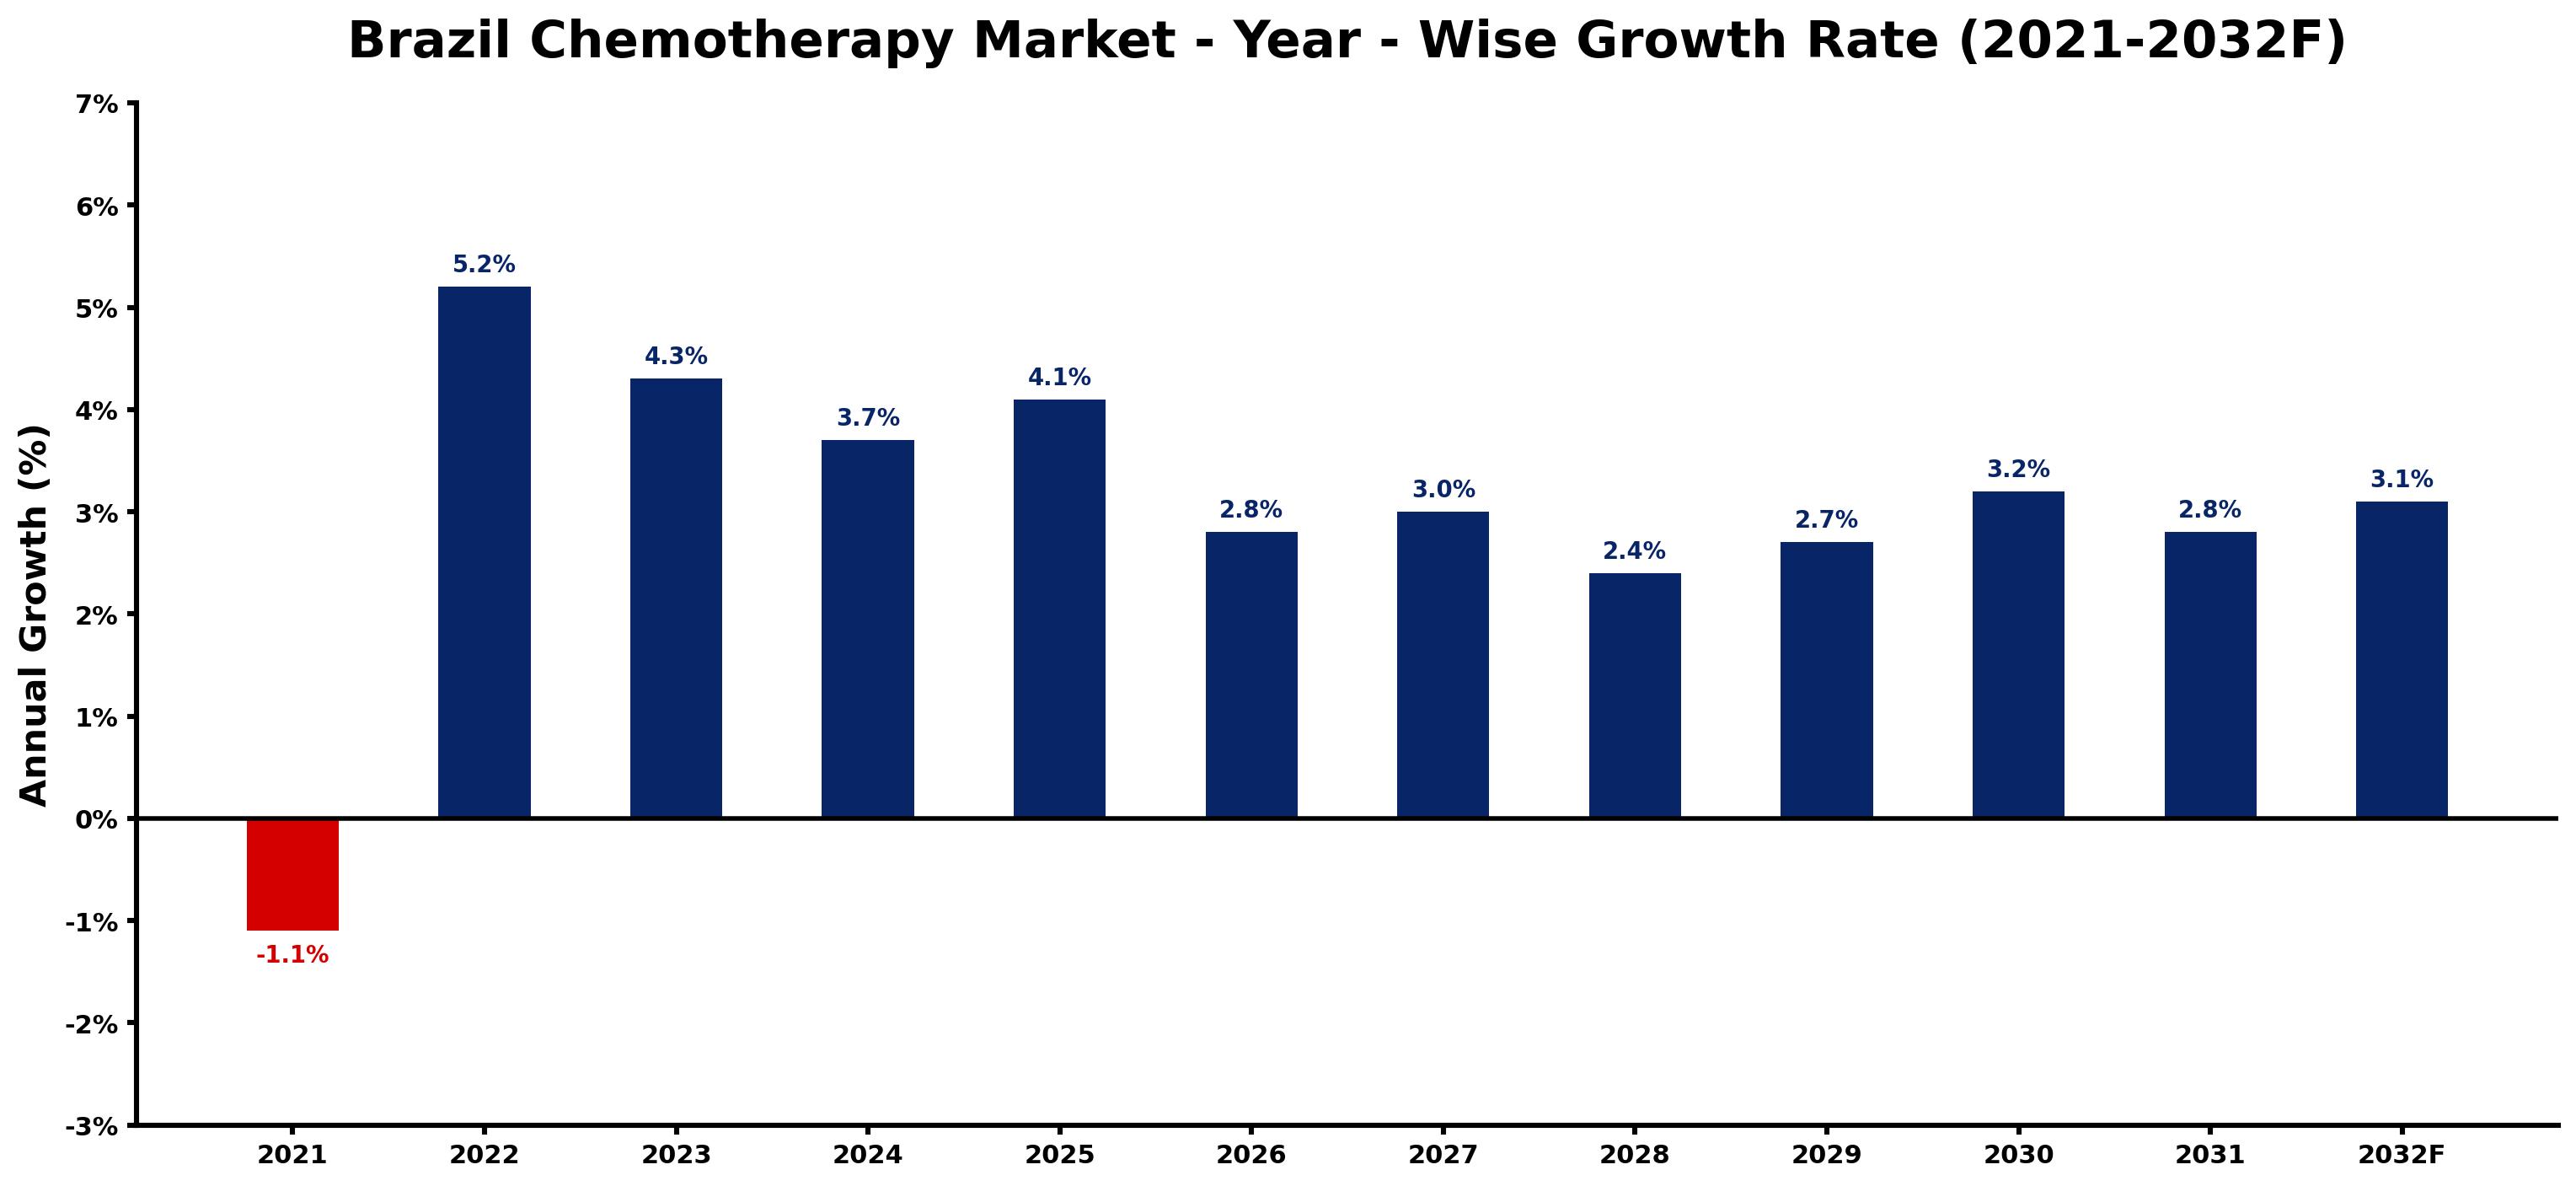
The table below presents the year wise growth rates along with the key drivers influencing the market
| Year | Growth Rate | Major Drivers |
| 2021 | -1.1% | Escalating healthcare costs limited patient access to chemotherapy treatments, impacting market expansion in Brazil. |
| 2022 | 5.2% | Patient advocacy groups highlight the need for innovative cancer treatments. |
| 2023 | 4.3% | Healthcare providers shift focus toward personalized medicine for chemotherapy protocols. |
| 2024 | 3.7% | Collaborations between biotech firms and hospitals enhance drug development timelines. |
| 2025 | 4.1% | Public awareness campaigns highlight early cancer detection, boosting chemotherapy demand. |
| 2026 | 2.8% | Investment in healthcare infrastructure supports better access to chemotherapy services. |
| 2027 | 3.0% | Emerging markets begin showing interest in Brazil's advanced oncology practices. |
| 2028 | 2.4% | Telemedicine platforms expand reach for chemotherapy consultations across Brazil. |
| 2029 | 2.7% | Research funding increases for targeted therapies and immunotherapy alternatives. |
| 2030 | 3.2% | Genomic testing becomes mainstream, influencing chemotherapy drug selection processes. |
| 2031 | 2.8% | International partnerships facilitate knowledge transfer and technology sharing in oncology. |
| 2032 | 3.1% | Patient-centered care models reshape treatment approaches in the Brazilian chemotherapy landscape. |
Note - Market size estimations and growth projections presented in this report are based on 6Wresearch's advanced forecasting approach, validated with industry datasets as of June 2026.
Brazil Chemotherapy Market Synopsis
The Brazil Chemotherapy Market is projected to reach 2.8% and witness significant growth during the forecast period (2026-2032). This market plays a vital role in combating cancer within the Brazilian healthcare landscape, with a strong emphasis on enhancing treatment effectiveness and minimizing adverse effects associated with chemotherapy drugs. The evolving regulatory framework and healthcare infrastructure, along with ongoing research and development efforts, are pivotal factors influencing market dynamics.
Brazil Chemotherapy Market Growth Drivers
Several key factors are contributing to the expansion of the Brazil Chemotherapy Market. The increasing incidence of cancer across the population acts as a primary catalyst for growth. As awareness regarding cancer screening and early detection rises, so does the demand for effective chemotherapy treatments.
- The prevalence of various cancer types, particularly breast, lung, and colorectal cancers, has heightened the need for advanced chemotherapy solutions.
- Advancements in chemotherapy drug formulations and delivery methods are making treatments more effective and tolerable for patients, further driving market demand.
- Research initiatives focused on personalized medicine and targeted therapies are yielding novel chemotherapy agents that are demonstrating improved efficacy in clinical settings.
- Collaborative efforts between pharmaceutical companies and healthcare providers aim to enhance access to chemotherapy treatments, particularly in underserved and rural areas of Brazil.
- Public health campaigns promoting awareness of cancer and the importance of treatment adherence are fostering a supportive environment for market growth.
Brazil Chemotherapy Market Challenges and Restraints
Despite its growth potential, the Brazil Chemotherapy Market is not without challenges. Key barriers affecting the market include issues related to patient access, regulatory compliance, and logistical constraints.
- Access to chemotherapy treatments across Brazil can be inconsistent, particularly in remote regions where healthcare facilities may be limited or ill-equipped.
- The regulatory environment for drug approval and patient safety standards can introduce delays and complexities in bringing new chemotherapy agents to market.
- Affordability remains a significant concern, as the cost of innovative chemotherapy drugs can be prohibitive for a large segment of the population.
- Inadequate infrastructure in certain healthcare settings can hinder the effective delivery of chemotherapy treatments, affecting patient outcomes.
- Competition among existing treatments and generics can impact the financial viability of new drug introductions, influencing investments in R&D.
Brazil Chemotherapy Market Government Investment and Initiatives
Government policies play a crucial role in shaping the Brazil Chemotherapy Market. Regulatory frameworks, public spending, and initiatives aimed at improving cancer care significantly influence market dynamics.
- The Brazilian government is actively working to enhance healthcare accessibility, implementing programs to subsidize chemotherapy treatments for low-income populations.
- Recent policies have focused on streamlining drug approval processes, aiming to expedite access to innovative chemotherapy options for patients.
- Public health initiatives are being launched to increase awareness of cancer treatment options, bolstering early diagnosis and timely chemotherapy intervention.
- Investment in healthcare infrastructure, including the establishment of specialized cancer treatment centers, is a priority to ensure adequate service provision.
- Collaboration between governmental bodies and pharmaceutical companies is encouraged to foster innovation in the development of new chemotherapy drugs, enhancing treatment efficacy.
Brazil Chemotherapy Market Latest Developments (May 2025 - June 2026)
Recent developments in the Brazil Chemotherapy Market indicate a dynamic environment poised for growth. Between May 2025 and June 2026, there have been pivotal movements in regulatory policies and treatment approaches.
- Regulatory bodies have begun to adopt more agile pathways for oncology drug approval, thereby facilitating faster access to novel therapeutic agents.
- New oncological guidelines have been launched to enhance treatment protocols, with an emphasis on patient-centered care and personalized treatment strategies.
- Increased collaborations among healthcare professionals and researchers have led to promising clinical trials exploring novel chemotherapeutics and combination therapies.
- Public health campaigns focused on cancer awareness have gained momentum, aiming to educate communities about treatment options and early detection strategies.
- Progress in telemedicine has improved follow-up care for chemotherapy patients, enhancing treatment adherence and outcomes.
Brazil Chemotherapy Market - Key Attractiveness of the Report
- 10 Years of Market Numbers
- Historical Data Starting from 2022 to 2025
- Base Year: 2025
- Forecast Data until 2032
- Key Performance Indicators Impacting the Market
- Major Upcoming Developments and Projects
Key Highlights of the Report:
- Brazil Chemotherapy? Market Outlook
- Market Size of Brazil Chemotherapy? Market, 2025
- Forecast of Brazil Chemotherapy? Market, 2032
- Historical Data and Forecast of Brazil Chemotherapy? Revenues & Volume for the Period 2022-2032F
- Brazil Chemotherapy? Market Trend Evolution
- Brazil Chemotherapy? Market Drivers and Challenges
- Brazil Chemotherapy? Price Trends
- Brazil Chemotherapy? Porter's Five Forces
- Brazil Chemotherapy? Industry Life Cycle
- Historical Data and Forecast of Brazil Chemotherapy? Market Revenues & Volume By Drug Class for the Period 2022-2032F
- Historical Data and Forecast of Brazil Chemotherapy? Market Revenues & Volume By Alkylating Agents for the Period 2022-2032F
- Historical Data and Forecast of Brazil Chemotherapy? Market Revenues & Volume By Mitotic Inhibitors for the Period 2022-2032F
- Historical Data and Forecast of Brazil Chemotherapy? Market Revenues & Volume By Antimetabolites for the Period 2022-2032F
- Historical Data and Forecast of Brazil Chemotherapy? Market Revenues & Volume By Topoisomerase Inhibitors for the Period 2022-2032F
- Historical Data and Forecast of Brazil Chemotherapy? Market Revenues & Volume By Antitumor Antibiotic for the Period 2022-2032F
- Historical Data and Forecast of Brazil Chemotherapy? Market Revenues & Volume By Indication for the Period 2022-2032F
- Historical Data and Forecast of Brazil Chemotherapy? Market Revenues & Volume By Lung Cancer for the Period 2022-2032F
- Historical Data and Forecast of Brazil Chemotherapy? Market Revenues & Volume By Breast Cancer for the Period 2022-2032F
- Historical Data and Forecast of Brazil Chemotherapy? Market Revenues & Volume By Colorectal Cancer for the Period 2022-2032F
- Historical Data and Forecast of Brazil Chemotherapy? Market Revenues & Volume By Prostate Cancer for the Period 2022-2032F
- Historical Data and Forecast of Brazil Chemotherapy? Market Revenues & Volume By Stomach Cancer for the Period 2022-2032F
- Historical Data and Forecast of Brazil Chemotherapy? Market Revenues & Volume By Lymphoma for the Period 2022-2032F
- Historical Data and Forecast of Brazil Chemotherapy? Market Revenues & Volume By Leukemia for the Period 2022-2032F
- Historical Data and Forecast of Brazil Chemotherapy? Market Revenues & Volume By Ovarian Cancer for the Period 2022-2032F
- Historical Data and Forecast of Brazil Chemotherapy? Market Revenues & Volume By Route of Drug Administration for the Period 2022-2032F
- Historical Data and Forecast of Brazil Chemotherapy? Market Revenues & Volume By Intravenous for the Period 2022-2032F
- Historical Data and Forecast of Brazil Chemotherapy? Market Revenues & Volume By Oral for the Period 2022-2032F
- Historical Data and Forecast of Brazil Chemotherapy? Market Revenues & Volume By Subcutaneous for the Period 2022-2032F
- Historical Data and Forecast of Brazil Chemotherapy? Market Revenues & Volume By Intra-Muscular for the Period 2022-2032F
- Historical Data and Forecast of Brazil Chemotherapy? Market Revenues & Volume By Intravesicular for the Period 2022-2032F
- Historical Data and Forecast of Brazil Chemotherapy? Market Revenues & Volume By Topical for the Period 2022-2032F
- Historical Data and Forecast of Brazil Chemotherapy? Market Revenues & Volume By Intraperitoneal for the Period 2022-2032F
- Historical Data and Forecast of Brazil Chemotherapy? Market Revenues & Volume By Intraventricular/Intrathecal for the Period 2022-2032F
- Historical Data and Forecast of Brazil Chemotherapy? Market Revenues & Volume By End-Users for the Period 2022-2032F
- Historical Data and Forecast of Brazil Chemotherapy? Market Revenues & Volume By Specialty Centers for the Period 2022-2032F
- Historical Data and Forecast of Brazil Chemotherapy? Market Revenues & Volume By Hospitals & Clinics for the Period 2022-2032F
- Brazil Chemotherapy? Import Export Trade Statistics
- Market Opportunity Assessment By Drug Class
- Market Opportunity Assessment By Indication
- Market Opportunity Assessment By Route of Drug Administration
- Market Opportunity Assessment By End-Users
- Brazil Chemotherapy? Top Companies Market Share
- Brazil Chemotherapy? Competitive Benchmarking By Technical and Operational Parameters
- Brazil Chemotherapy? Company Profiles
- Brazil Chemotherapy? Key Strategic Recommendations
Frequently Asked Questions About the Market Study (FAQs):
A1: The Brazil Chemotherapy Market is currently witnessing growth driven by increasing cancer prevalence and advancements in treatment options, with substantial efforts focused on improving patient access.
A2: The government is implementing various policies to enhance drug accessibility, streamline approval processes, and invest in healthcare infrastructure to support cancer treatment initiatives.
A3: Key challenges include issues related to patient access, regulatory compliance, healthcare infrastructure disparities, and the high costs associated with innovative chemotherapy drugs.
A4: The regulatory environment is evolving, with efforts to facilitate quicker drug approvals and improve safety standards, thereby shaping market dynamics and treatment accessibility.
6Wresearch actively monitors the Brazil Chemotherapy Market and publishes its comprehensive annual report, highlighting emerging trends, growth drivers, revenue analysis, and forecast outlook. Our insights help businesses to make data-backed strategic decisions with ongoing market dynamics. Our analysts track relevent industries related to the Brazil Chemotherapy Market, allowing our clients with actionable intelligence and reliable forecasts tailored to emerging regional needs.
Yes, we provide customisation as per your requirements. To learn more, feel free to contact us on sales@6wresearch.com
1 Executive Summary |
2 Introduction |
2.1 Key Highlights of the Report |
2.2 Report Description |
2.3 Market Scope & Segmentation |
2.4 Research Methodology |
2.5 Assumptions |
3 Brazil Chemotherapy Market Overview |
3.1 Brazil Country Macro Economic Indicators |
3.2 Brazil Chemotherapy Market Revenues & Volume, 2022 & 2032F |
3.3 Brazil Chemotherapy Market - Industry Life Cycle |
3.4 Brazil Chemotherapy Market - Porter's Five Forces |
3.5 Brazil Chemotherapy Market Revenues & Volume Share, By Drug Class, 2022 & 2032F |
3.6 Brazil Chemotherapy Market Revenues & Volume Share, By Indication, 2022 & 2032F |
3.7 Brazil Chemotherapy Market Revenues & Volume Share, By Route of Drug Administration, 2022 & 2032F |
3.8 Brazil Chemotherapy Market Revenues & Volume Share, By End-Users, 2022 & 2032F |
4 Brazil Chemotherapy Market Dynamics |
4.1 Impact Analysis |
4.2 Market Drivers |
4.2.1 Increasing incidence of cancer in Brazil |
4.2.2 Growing awareness about the benefits of chemotherapy treatment |
4.2.3 Technological advancements in chemotherapy drugs and procedures |
4.3 Market Restraints |
4.3.1 High cost of chemotherapy treatment |
4.3.2 Side effects associated with chemotherapy |
4.3.3 Limited access to advanced chemotherapy treatments in certain regions of Brazil |
5 Brazil Chemotherapy Market Trends |
6 Brazil Chemotherapy Market, By Types |
6.1 Brazil Chemotherapy Market, By Drug Class |
6.1.1 Overview and Analysis |
6.1.2 Brazil Chemotherapy Market Revenues & Volume, By Drug Class, 2022-2032F |
6.1.3 Brazil Chemotherapy Market Revenues & Volume, By Alkylating Agents, 2022-2032F |
6.1.4 Brazil Chemotherapy Market Revenues & Volume, By Mitotic Inhibitors, 2022-2032F |
6.1.5 Brazil Chemotherapy Market Revenues & Volume, By Antimetabolites, 2022-2032F |
6.1.6 Brazil Chemotherapy Market Revenues & Volume, By Topoisomerase Inhibitors, 2022-2032F |
6.1.7 Brazil Chemotherapy Market Revenues & Volume, By Antitumor Antibiotic, 2022-2032F |
6.2 Brazil Chemotherapy Market, By Indication |
6.2.1 Overview and Analysis |
6.2.2 Brazil Chemotherapy Market Revenues & Volume, By Lung Cancer, 2022-2032F |
6.2.3 Brazil Chemotherapy Market Revenues & Volume, By Breast Cancer, 2022-2032F |
6.2.4 Brazil Chemotherapy Market Revenues & Volume, By Colorectal Cancer, 2022-2032F |
6.2.5 Brazil Chemotherapy Market Revenues & Volume, By Prostate Cancer, 2022-2032F |
6.2.6 Brazil Chemotherapy Market Revenues & Volume, By Stomach Cancer, 2022-2032F |
6.2.7 Brazil Chemotherapy Market Revenues & Volume, By Lymphoma, 2022-2032F |
6.2.8 Brazil Chemotherapy Market Revenues & Volume, By Ovarian Cancer, 2022-2032F |
6.2.9 Brazil Chemotherapy Market Revenues & Volume, By Ovarian Cancer, 2022-2032F |
6.3 Brazil Chemotherapy Market, By Route of Drug Administration |
6.3.1 Overview and Analysis |
6.3.2 Brazil Chemotherapy Market Revenues & Volume, By Intravenous, 2022-2032F |
6.3.3 Brazil Chemotherapy Market Revenues & Volume, By Oral, 2022-2032F |
6.3.4 Brazil Chemotherapy Market Revenues & Volume, By Subcutaneous, 2022-2032F |
6.3.5 Brazil Chemotherapy Market Revenues & Volume, By Intra-Muscular, 2022-2032F |
6.3.6 Brazil Chemotherapy Market Revenues & Volume, By Intravesicular, 2022-2032F |
6.3.7 Brazil Chemotherapy Market Revenues & Volume, By Topical, 2022-2032F |
6.3.8 Brazil Chemotherapy Market Revenues & Volume, By Intraventricular/Intrathecal, 2022-2032F |
6.3.9 Brazil Chemotherapy Market Revenues & Volume, By Intraventricular/Intrathecal, 2022-2032F |
6.4 Brazil Chemotherapy Market, By End-Users |
6.4.1 Overview and Analysis |
6.4.2 Brazil Chemotherapy Market Revenues & Volume, By Specialty Centers, 2022-2032F |
6.4.3 Brazil Chemotherapy Market Revenues & Volume, By Hospitals & Clinics, 2022-2032F |
7 Brazil Chemotherapy Market Import-Export Trade Statistics |
7.1 Brazil Chemotherapy Market Export to Major Countries |
7.2 Brazil Chemotherapy Market Imports from Major Countries |
8 Brazil Chemotherapy Market Key Performance Indicators |
8.1 Average waiting time for chemotherapy treatment |
8.2 Patient satisfaction with chemotherapy services |
8.3 Number of oncologists per capita in Brazil |
9 Brazil Chemotherapy Market - Opportunity Assessment |
9.1 Brazil Chemotherapy Market Opportunity Assessment, By Drug Class, 2022 & 2032F |
9.2 Brazil Chemotherapy Market Opportunity Assessment, By Indication, 2022 & 2032F |
9.3 Brazil Chemotherapy Market Opportunity Assessment, By Route of Drug Administration, 2022 & 2032F |
9.4 Brazil Chemotherapy Market Opportunity Assessment, By End-Users, 2022 & 2032F |
10 Brazil Chemotherapy Market - Competitive Landscape |
10.1 Brazil Chemotherapy Market Revenue Share, By Companies, 2025 |
10.2 Brazil Chemotherapy Market Competitive Benchmarking, By Operating and Technical Parameters |
11 Company Profiles |
12 Recommendations |
13 Disclaimer |
Global Go To Market Strategy - 2030
Export potential enables firms to identify high-growth global markets with greater confidence by combining advanced trade intelligence with a structured quantitative methodology. The framework analyzes emerging demand trends and country-level import patterns while integrating macroeconomic and trade datasets such as GDP and population forecasts, bilateral import–export flows, tariff structures, elasticity differentials between developed and developing economies, geographic distance, and import demand projections. Using weighted trade values from 2020–2024 as the base period to project country-to-country export potential for 2030, these inputs are operationalized through calculated drivers such as gravity model parameters, tariff impact factors, and projected GDP per-capita growth. Through an analysis of hidden potentials, demand hotspots, and market conditions that are most favorable to success, this method enables firms to focus on target countries, maximize returns, and global expansion with data, backed by accuracy.
By factoring in the projected importer demand gap that is currently unmet and could be potential opportunity, it identifies the potential for the Exporter (Country) among 190 countries, against the general trade analysis, which identifies the biggest importer or exporter.
To discover high-growth global markets and optimize your business strategy:
Click Here
Pricing
- Single User License$ 1,995
- Department License$ 2,400
- Site License$ 3,120
- Global License$ 3,795

Leadership Perspectives from Industry Events
Search
Thought Leadership and Analyst Meet


Our Clients
6WResearch In News
- India Air Conditioner Market Set for Strong Rebound in 2026 After Weather-Led Correction and GST-Driven Recovery: 6Wresearch
- ADAS in India: How Automatic Emergency Braking, Blind Spot Detection & Driver Monitoring are Transforming Road Safety
- Doha a strategic location for EV manufacturing hub: IPA Qatar
- Demand for luxury TVs surging in the GCC, says Samsung
- Empowering Growth: The Thriving Journey of Bangladesh’s Cable Industry
- Demand for luxury TVs surging in the GCC, says Samsung
Latest Reports
- Poland Fire Protection Systems Market (2026-2032)
- Cape Verde Portable Hand-Thrown Extinguisher Market (2026-2032)
- Canada Portable Hand-Thrown Extinguisher Market (2026-2032)
- Cameroon Portable Hand-Thrown Extinguisher Market (2026-2032)
- Burundi Portable Hand-Thrown Extinguisher Market (2026-2032)
- Burkina Faso Portable Hand-Thrown Extinguisher Market (2026-2032)
- Bulgaria Portable Hand-Thrown Extinguisher Market (2026-2032)
- Brunei Portable Hand-Thrown Extinguisher Market (2026-2032)
- Botswana Portable Hand-Thrown Extinguisher Market (2026-2032)
- Bosnia and Herzegovina Portable Hand-Thrown Extinguisher Market (2026-2032)
Industry Events and Analyst Meet

HIMTEX 2026

India Refining Summit 2026

India EV Show 2026

EV tech India Expo 2026

Auto Tech Asia 2026
Whitepaper
- Middle East & Africa Commercial Security Market Click here to view more.
- Middle East & Africa Fire Safety Systems & Equipment Market Click here to view more.
- GCC Drone Market Click here to view more.
- Middle East Lighting Fixture Market Click here to view more.
- GCC Physical & Perimeter Security Market Click here to view more.