United States (US) Chemotherapy Market (2026-2032) | Analysis, Forecast, Outlook, Share, Size, Industry, Growth, Value, Trends, Revenue & Companies
Market Forecast By Drug Class (Alkylating Agents, Mitotic Inhibitors, Antimetabolites, Topoisomerase Inhibitors, Antitumor Antibiotic), By Indication (Lung Cancer, Breast Cancer, Colorectal Cancer, Prostate Cancer, Stomach Cancer, Lymphoma, Leukemia, Ovarian Cancer), By Route of Drug Administration (Intravenous, Oral, Subcutaneous, Intra-Muscular, Intravesicular, Topical, Intraperitoneal, Intraventricular/Intrathecal), By End-Users (Specialty Centers, Hospitals & Clinics) And Competitive Landscape
| Product Code: ETC044921 | Publication Date: Jan 2021 | Updated Date: Jun 2026 | Product Type: Report | |
| Publisher: 6Wresearch | Author: Ravi Bhandari | No. of Pages: 70 | No. of Figures: 35 | No. of Tables: 5 |
United States (US) Chemotherapy Market Summary
The united states (us) chemotherapy market was estimated at USD 205 Million in 2025 and is projected to reach USD 241 Million by 2032, growing at a CAGR of 2.5% from 2026 to 2032.
United States (US) Chemotherapy Market Year-wise Growth Rate and Key Drivers
This graph highlights how the United States (US) Chemotherapy Market has steadily grown over the past five years, supported by major growth factors.
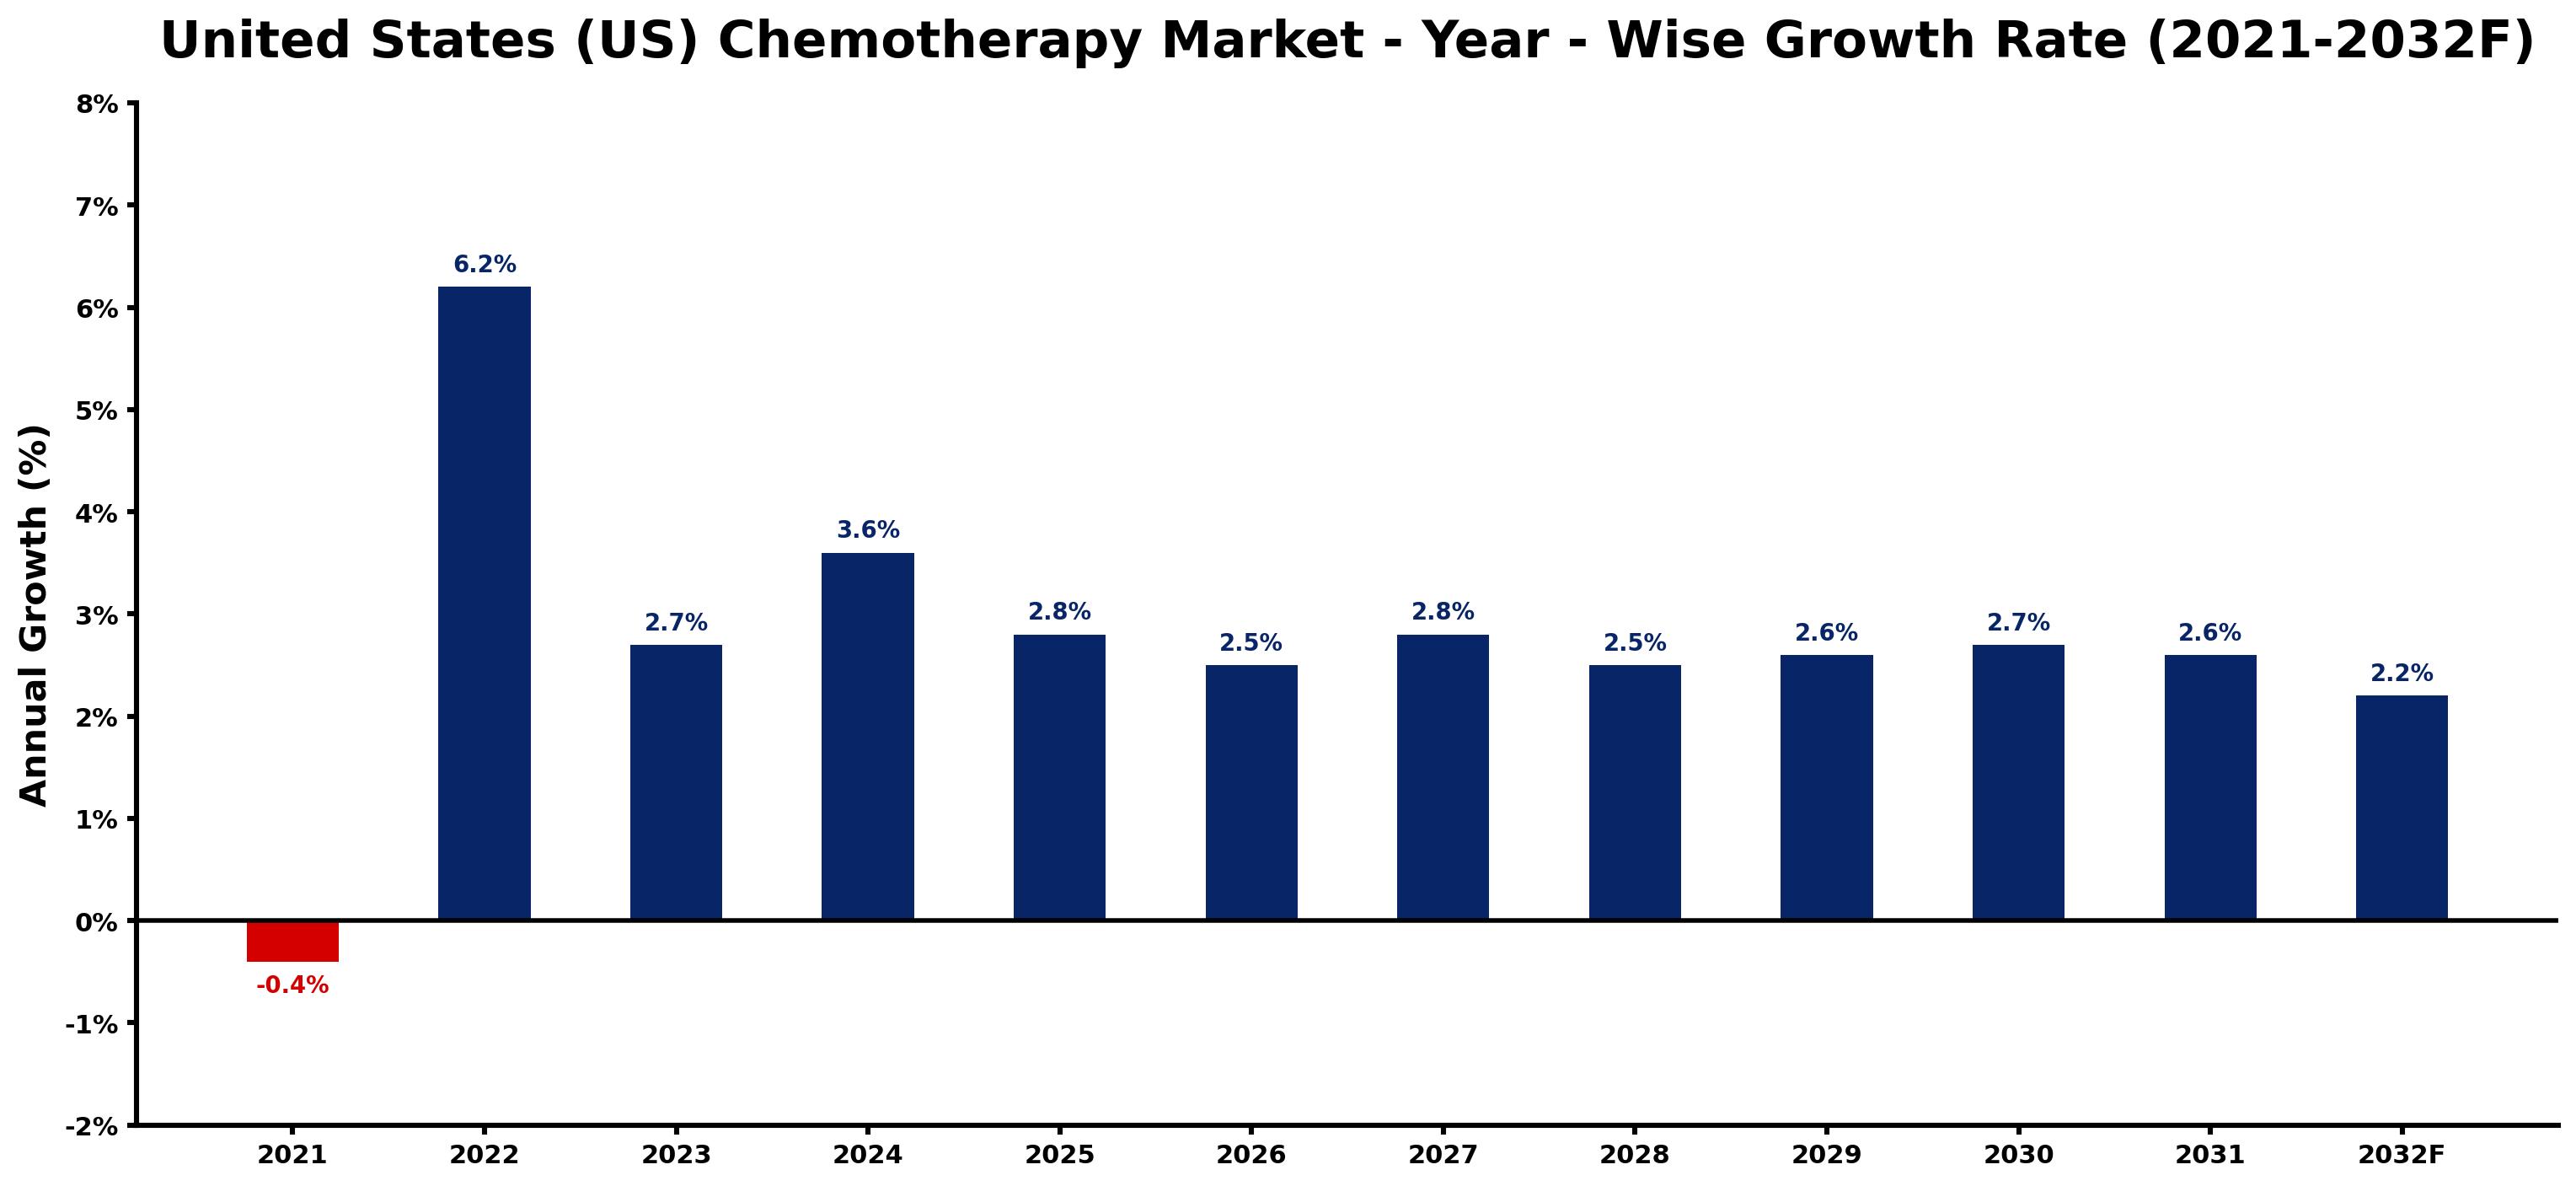
The table below presents the year wise growth rates along with the key drivers influencing the market
| Year | Growth Rate | Major Drivers |
| 2021 | -0.4% | Increased competition from alternative cancer therapies shifted physician prescribing patterns, diminishing chemotherapy usage rates. |
| 2022 | 6.2% | Emerging therapies, including immunotherapy, create a complementary landscape for traditional chemotherapy. |
| 2023 | 2.7% | Healthcare expenditure rises, allowing for expanded access to cancer treatment options nationwide. |
| 2024 | 3.6% | Telemedicine adoption facilitates remote consultations, improving patient engagement in chemotherapy decisions. |
| 2025 | 2.8% | Collaborations between biotech firms and pharmaceutical companies enhance drug development efficiency and innovation. |
| 2026 | 2.5% | Growing awareness of cancer prevention leads to earlier diagnoses and increased treatment opportunities. |
| 2027 | 2.8% | Real-world data analytics support personalized medicine approaches, optimizing chemotherapy regimens for patients. |
| 2028 | 2.5% | Omics technologies revolutionize treatment selection, ensuring precise targeting in chemotherapy applications. |
| 2029 | 2.6% | Healthcare policies evolve, emphasizing value-based care to improve patient outcomes and minimize costs. |
| 2030 | 2.7% | Diversified supply chains reduce drug shortages, ensuring consistent availability of chemotherapy agents. |
| 2031 | 2.6% | Corporate social responsibility trends motivate pharmaceutical companies to invest in community cancer awareness programs. |
| 2032 | 2.2% | Patient advocacy movements increasingly influence drug approval processes and treatment accessibility initiatives. |
Note - Market size estimations and growth projections presented in this report are based on 6Wresearch's advanced forecasting approach, validated with industry datasets as of June 2026.
United States (US) Chemotherapy Market Synopsis
The United States (US) Chemotherapy Market is projected to reach 2.5% and witness significant growth during the forecast period (2026-2032). This market is a crucial segment of the broader healthcare sector, encompassing a diverse array of pharmacological interventions aimed at treating various cancer types. With cancer rates continually on the rise, the demand for effective chemotherapy treatments is expected to escalate, driven by increasing patient needs and advancements in therapeutic technologies.
United States (US) Chemotherapy Market Growth Drivers
The US Chemotherapy Market is propelled by several key growth drivers that contribute to its expansion. These include:
- Increasing Incidence of Cancer: An alarming rise in cancer diagnoses across the United States has intensified the need for robust chemotherapy regimens, thereby enhancing market demand.
- Aging Population: The demographic shift towards an older population, who are more susceptible to various forms of cancer, is significantly boosting the chemotherapy market.
- Advancements in Treatment Technologies: Ongoing innovations in drug formulation and delivery methods are improving treatment efficacy and reducing side effects, thereby expanding the market's potential.
- Investment in Research and Development: Pharmaceutical companies are heavily investing in R&D to create more effective and personalized chemotherapy treatments, which will inevitably drive market growth.
- Increasing Awareness and Screening Programs: Enhanced public awareness about cancer risks and the benefits of early detection are leading to higher screening rates, which in turn increases treatment demand.
United States (US) Chemotherapy Market Trends and Opportunities
Current trends within the US Chemotherapy Market indicate a shift towards personalized medicine, where chemotherapy treatments are tailored based on individual patient profiles. Additionally:
- Precision Oncology: There is a growing focus on tailoring chemotherapy based on genetic profiling, which helps in optimizing treatment efficacy and minimizing adverse effects.
- Combination Therapies: The use of multi-modal treatment approaches that combine chemotherapy with other therapeutic modalities, such as immunotherapy, is gaining traction.
- Digital Health Integration: The incorporation of digital health technologies, including telemedicine and mobile health applications, is improving patient management and monitoring throughout treatment cycles.
- Emphasis on Supportive Care: There is an increasing market demand for supportive care products that alleviate chemotherapy side effects, thereby enhancing quality of life for patients.
- Regenerative Medicine: The exploration of regenerative medicine techniques alongside chemotherapy treatments presents new opportunities for improving patient outcomes.
United States (US) Chemotherapy Market Challenges and Restraints
While the US Chemotherapy Market is poised for growth, it faces several challenges that could impact its trajectory:
- High Treatment Costs: The financial burden of chemotherapy drugs remains a significant barrier for many patients, affecting treatment accessibility and adherence.
- Healthcare Disparities: Variations in access to innovative chemotherapy treatments based on geographic location and socioeconomic factors can lead to unequal patient outcomes.
- Side Effects Management: Adverse reactions associated with chemotherapy, such as nausea and fatigue, continue to challenge healthcare providers and impact patient satisfaction.
- Alternative Treatment Modalities: The emergence of alternative therapies, including gene therapy, may divert attention and funding away from traditional chemotherapy approaches.
- Regulatory Challenges: Stringent regulations governing drug approval processes may slow the introduction of novel therapies in the chemotherapy landscape.
United States (US) Chemotherapy Market Investment Opportunities
The United States Chemotherapy Market presents several investment opportunities, particularly in the following areas:
- Innovative Drug Development: There is vast potential in developing next-generation chemotherapy agents with improved efficacy and tolerability, a focus area for many investors.
- Supportive Care Solutions: Investing in companies that offer products aimed at alleviating chemotherapy side effects can yield significant returns as patient needs continue to evolve.
- Oncology-focused Biotechnologies: Companies focused on novel therapies and treatments that enhance overall cancer care are on the rise, representing lucrative investment avenues.
- Digital Health Innovations: As technology becomes integral to treatment management, opportunities in health tech solutions specifically designed for oncology will grow.
- Comprehensive Oncology Services: Investment in organizations that provide holistic cancer care, from diagnostics to treatment management, is increasingly attractive for stakeholders.
United States (US) Chemotherapy Market Government Investment and Initiatives
The US government plays a pivotal role in shaping the chemotherapy market through various investments and policy initiatives aimed at enhancing healthcare access and improving treatment outcomes:
- Drug Approval Regulations: The Food and Drug Administration (FDA) enforces strict regulatory standards to ensure that chemotherapy drugs are both safe and effective before they enter the market.
- Public Healthcare Programs: Medicare and Medicaid significantly influence market accessibility by covering a wide range of chemotherapy treatments, benefiting diverse populations.
- Research Grants: Public funding is often directed towards cancer research initiatives, supporting the development of innovative therapies and treatment protocols.
- Policy Reforms: Legislative efforts, including provisions under the Affordable Care Act, aim to improve access to cancer treatments and enhance preventive measures.
- Subsidies for Innovative Therapies: Government initiatives may provide financial support for groundbreaking cancer treatments and supportive care solutions to foster market growth.
United States (US) Chemotherapy Market Latest Developments (May 2025 - June 2026)
Recent developments in the United States Chemotherapy Market between May 2025 and June 2026 reflect a dynamic atmosphere characterized by innovation and strategic shifts:
- The introduction of new chemotherapy agents with enhanced efficacy and lower side effects has gained momentum, improving treatment options for patients.
- Key clinical trials exploring the effectiveness of combination therapies have shown promising results, signaling a shift toward more integrative treatment approaches.
- Adoption of telehealth services has become widespread, providing patients with more accessible monitoring and support during chemotherapy.
- Public and private sector collaborations have increased, aiming to streamline research processes and expedite the delivery of new therapies to the market.
- Regulatory frameworks are being updated to facilitate faster approvals for innovative chemotherapy treatments, seeking to enhance patient access and care outcomes.
United States (US) Chemotherapy Market - Key Attractiveness of the Report
- 10 Years of Market Numbers
- Historical Data Starting from 2022 to 2025
- Base Year: 2025
- Forecast Data until 2032
- Key Performance Indicators Impacting the Market
- Major Upcoming Developments and Projects
Key Highlights of the Report:
- United States (US) Chemotherapy? Market Outlook
- Market Size of United States (US) Chemotherapy? Market, 2025
- Forecast of United States (US) Chemotherapy? Market, 2032
- Historical Data and Forecast of United States (US) Chemotherapy? Revenues & Volume for the Period 2022-2032F
- United States (US) Chemotherapy? Market Trend Evolution
- United States (US) Chemotherapy? Market Drivers and Challenges
- United States (US) Chemotherapy? Price Trends
- United States (US) Chemotherapy? Porter's Five Forces
- United States (US) Chemotherapy? Industry Life Cycle
- Historical Data and Forecast of United States (US) Chemotherapy? Market Revenues & Volume By Drug Class for the Period 2022-2032F
- Historical Data and Forecast of United States (US) Chemotherapy? Market Revenues & Volume By Alkylating Agents for the Period 2022-2032F
- Historical Data and Forecast of United States (US) Chemotherapy? Market Revenues & Volume By Mitotic Inhibitors for the Period 2022-2032F
- Historical Data and Forecast of United States (US) Chemotherapy? Market Revenues & Volume By Antimetabolites for the Period 2022-2032F
- Historical Data and Forecast of United States (US) Chemotherapy? Market Revenues & Volume By Topoisomerase Inhibitors for the Period 2022-2032F
- Historical Data and Forecast of United States (US) Chemotherapy? Market Revenues & Volume By Antitumor Antibiotic for the Period 2022-2032F
- Historical Data and Forecast of United States (US) Chemotherapy? Market Revenues & Volume By Indication for the Period 2022-2032F
- Historical Data and Forecast of United States (US) Chemotherapy? Market Revenues & Volume By Lung Cancer for the Period 2022-2032F
- Historical Data and Forecast of United States (US) Chemotherapy? Market Revenues & Volume By Breast Cancer for the Period 2022-2032F
- Historical Data and Forecast of United States (US) Chemotherapy? Market Revenues & Volume By Colorectal Cancer for the Period 2022-2032F
- Historical Data and Forecast of United States (US) Chemotherapy? Market Revenues & Volume By Prostate Cancer for the Period 2022-2032F
- Historical Data and Forecast of United States (US) Chemotherapy? Market Revenues & Volume By Stomach Cancer for the Period 2022-2032F
- Historical Data and Forecast of United States (US) Chemotherapy? Market Revenues & Volume By Lymphoma for the Period 2022-2032F
- Historical Data and Forecast of United States (US) Chemotherapy? Market Revenues & Volume By Leukemia for the Period 2022-2032F
- Historical Data and Forecast of United States (US) Chemotherapy? Market Revenues & Volume By Ovarian Cancer for the Period 2022-2032F
- Historical Data and Forecast of United States (US) Chemotherapy? Market Revenues & Volume By Route of Drug Administration for the Period 2022-2032F
- Historical Data and Forecast of United States (US) Chemotherapy? Market Revenues & Volume By Intravenous for the Period 2022-2032F
- Historical Data and Forecast of United States (US) Chemotherapy? Market Revenues & Volume By Oral for the Period 2022-2032F
- Historical Data and Forecast of United States (US) Chemotherapy? Market Revenues & Volume By Subcutaneous for the Period 2022-2032F
- Historical Data and Forecast of United States (US) Chemotherapy? Market Revenues & Volume By Intra-Muscular for the Period 2022-2032F
- Historical Data and Forecast of United States (US) Chemotherapy? Market Revenues & Volume By Intravesicular for the Period 2022-2032F
- Historical Data and Forecast of United States (US) Chemotherapy? Market Revenues & Volume By Topical for the Period 2022-2032F
- Historical Data and Forecast of United States (US) Chemotherapy? Market Revenues & Volume By Intraperitoneal for the Period 2022-2032F
- Historical Data and Forecast of United States (US) Chemotherapy? Market Revenues & Volume By Intraventricular/Intrathecal for the Period 2022-2032F
- Historical Data and Forecast of United States (US) Chemotherapy? Market Revenues & Volume By End-Users for the Period 2022-2032F
- Historical Data and Forecast of United States (US) Chemotherapy? Market Revenues & Volume By Specialty Centers for the Period 2022-2032F
- Historical Data and Forecast of United States (US) Chemotherapy? Market Revenues & Volume By Hospitals & Clinics for the Period 2022-2032F
- United States (US) Chemotherapy? Import Export Trade Statistics
- Market Opportunity Assessment By Drug Class
- Market Opportunity Assessment By Indication
- Market Opportunity Assessment By Route of Drug Administration
- Market Opportunity Assessment By End-Users
- United States (US) Chemotherapy? Top Companies Market Share
- United States (US) Chemotherapy? Competitive Benchmarking By Technical and Operational Parameters
- United States (US) Chemotherapy? Company Profiles
- United States (US) Chemotherapy? Key Strategic Recommendations
Frequently Asked Questions About the Market Study (FAQs):
The growth is primarily driven by the increasing incidence of cancer, technological advancements, and an aging population that demands more effective treatment options.
Key challenges include high treatment costs, disparities in access to care, and the management of chemotherapy's side effects.
The government influences the market through regulatory frameworks, public healthcare programs, and funding for cancer research initiatives.
Opportunities exist in the development of innovative chemotherapy drugs, supportive care solutions, and integrating digital health technologies into oncology care.
6Wresearch actively monitors the United States (US) Chemotherapy Market and publishes its comprehensive annual report, highlighting emerging trends, growth drivers, revenue analysis, and forecast outlook. Our insights help businesses to make data-backed strategic decisions with ongoing market dynamics. Our analysts track relevent industries related to the United States (US) Chemotherapy Market, allowing our clients with actionable intelligence and reliable forecasts tailored to emerging regional needs.
Yes, we provide customisation as per your requirements. To learn more, feel free to contact us on sales@6wresearch.com
1 Executive Summary |
2 Introduction |
2.1 Key Highlights of the Report |
2.2 Report Description |
2.3 Market Scope & Segmentation |
2.4 Research Methodology |
2.5 Assumptions |
3 United States (US) Chemotherapy Market Overview |
3.1 United States (US) Country Macro Economic Indicators |
3.2 United States (US) Chemotherapy Market Revenues & Volume, 2022 & 2032F |
3.3 United States (US) Chemotherapy Market - Industry Life Cycle |
3.4 United States (US) Chemotherapy Market - Porter's Five Forces |
3.5 United States (US) Chemotherapy Market Revenues & Volume Share, By Drug Class, 2022 & 2032F |
3.6 United States (US) Chemotherapy Market Revenues & Volume Share, By Indication, 2022 & 2032F |
3.7 United States (US) Chemotherapy Market Revenues & Volume Share, By Route of Drug Administration, 2022 & 2032F |
3.8 United States (US) Chemotherapy Market Revenues & Volume Share, By End-Users, 2022 & 2032F |
4 United States (US) Chemotherapy Market Dynamics |
4.1 Impact Analysis |
4.2 Market Drivers |
4.2.1 Increasing prevalence of cancer in the United States |
4.2.2 Technological advancements leading to the development of more effective chemotherapy drugs |
4.2.3 Growing investments in research and development for innovative cancer treatments |
4.3 Market Restraints |
4.3.1 High cost associated with chemotherapy treatments |
4.3.2 Side effects and toxicity of chemotherapy drugs leading to patient discomfort |
4.3.3 Stringent regulations and approval processes for new chemotherapy drugs |
5 United States (US) Chemotherapy Market Trends |
6 United States (US) Chemotherapy Market, By Types |
6.1 United States (US) Chemotherapy Market, By Drug Class |
6.1.1 Overview and Analysis |
6.1.2 United States (US) Chemotherapy Market Revenues & Volume, By Drug Class, 2022-2032F |
6.1.3 United States (US) Chemotherapy Market Revenues & Volume, By Alkylating Agents, 2022-2032F |
6.1.4 United States (US) Chemotherapy Market Revenues & Volume, By Mitotic Inhibitors, 2022-2032F |
6.1.5 United States (US) Chemotherapy Market Revenues & Volume, By Antimetabolites, 2022-2032F |
6.1.6 United States (US) Chemotherapy Market Revenues & Volume, By Topoisomerase Inhibitors, 2022-2032F |
6.1.7 United States (US) Chemotherapy Market Revenues & Volume, By Antitumor Antibiotic, 2022-2032F |
6.2 United States (US) Chemotherapy Market, By Indication |
6.2.1 Overview and Analysis |
6.2.2 United States (US) Chemotherapy Market Revenues & Volume, By Lung Cancer, 2022-2032F |
6.2.3 United States (US) Chemotherapy Market Revenues & Volume, By Breast Cancer, 2022-2032F |
6.2.4 United States (US) Chemotherapy Market Revenues & Volume, By Colorectal Cancer, 2022-2032F |
6.2.5 United States (US) Chemotherapy Market Revenues & Volume, By Prostate Cancer, 2022-2032F |
6.2.6 United States (US) Chemotherapy Market Revenues & Volume, By Stomach Cancer, 2022-2032F |
6.2.7 United States (US) Chemotherapy Market Revenues & Volume, By Lymphoma, 2022-2032F |
6.2.8 United States (US) Chemotherapy Market Revenues & Volume, By Ovarian Cancer, 2022-2032F |
6.2.9 United States (US) Chemotherapy Market Revenues & Volume, By Ovarian Cancer, 2022-2032F |
6.3 United States (US) Chemotherapy Market, By Route of Drug Administration |
6.3.1 Overview and Analysis |
6.3.2 United States (US) Chemotherapy Market Revenues & Volume, By Intravenous, 2022-2032F |
6.3.3 United States (US) Chemotherapy Market Revenues & Volume, By Oral, 2022-2032F |
6.3.4 United States (US) Chemotherapy Market Revenues & Volume, By Subcutaneous, 2022-2032F |
6.3.5 United States (US) Chemotherapy Market Revenues & Volume, By Intra-Muscular, 2022-2032F |
6.3.6 United States (US) Chemotherapy Market Revenues & Volume, By Intravesicular, 2022-2032F |
6.3.7 United States (US) Chemotherapy Market Revenues & Volume, By Topical, 2022-2032F |
6.3.8 United States (US) Chemotherapy Market Revenues & Volume, By Intraventricular/Intrathecal, 2022-2032F |
6.3.9 United States (US) Chemotherapy Market Revenues & Volume, By Intraventricular/Intrathecal, 2022-2032F |
6.4 United States (US) Chemotherapy Market, By End-Users |
6.4.1 Overview and Analysis |
6.4.2 United States (US) Chemotherapy Market Revenues & Volume, By Specialty Centers, 2022-2032F |
6.4.3 United States (US) Chemotherapy Market Revenues & Volume, By Hospitals & Clinics, 2022-2032F |
7 United States (US) Chemotherapy Market Import-Export Trade Statistics |
7.1 United States (US) Chemotherapy Market Export to Major Countries |
7.2 United States (US) Chemotherapy Market Imports from Major Countries |
8 United States (US) Chemotherapy Market Key Performance Indicators |
8.1 Patient survival rates post-chemotherapy treatment |
8.2 Adoption rates of new chemotherapy drugs in the market |
8.3 Number of clinical trials for chemotherapy treatments conducted in the United States |
9 United States (US) Chemotherapy Market - Opportunity Assessment |
9.1 United States (US) Chemotherapy Market Opportunity Assessment, By Drug Class, 2022 & 2032F |
9.2 United States (US) Chemotherapy Market Opportunity Assessment, By Indication, 2022 & 2032F |
9.3 United States (US) Chemotherapy Market Opportunity Assessment, By Route of Drug Administration, 2022 & 2032F |
9.4 United States (US) Chemotherapy Market Opportunity Assessment, By End-Users, 2022 & 2032F |
10 United States (US) Chemotherapy Market - Competitive Landscape |
10.1 United States (US) Chemotherapy Market Revenue Share, By Companies, 2025 |
10.2 United States (US) Chemotherapy Market Competitive Benchmarking, By Operating and Technical Parameters |
11 Company Profiles |
12 Recommendations |
13 Disclaimer |
Global Go To Market Strategy - 2030
Export potential enables firms to identify high-growth global markets with greater confidence by combining advanced trade intelligence with a structured quantitative methodology. The framework analyzes emerging demand trends and country-level import patterns while integrating macroeconomic and trade datasets such as GDP and population forecasts, bilateral import–export flows, tariff structures, elasticity differentials between developed and developing economies, geographic distance, and import demand projections. Using weighted trade values from 2020–2024 as the base period to project country-to-country export potential for 2030, these inputs are operationalized through calculated drivers such as gravity model parameters, tariff impact factors, and projected GDP per-capita growth. Through an analysis of hidden potentials, demand hotspots, and market conditions that are most favorable to success, this method enables firms to focus on target countries, maximize returns, and global expansion with data, backed by accuracy.
By factoring in the projected importer demand gap that is currently unmet and could be potential opportunity, it identifies the potential for the Exporter (Country) among 190 countries, against the general trade analysis, which identifies the biggest importer or exporter.
To discover high-growth global markets and optimize your business strategy:
Click Here
Pricing
- Single User License$ 1,995
- Department License$ 2,400
- Site License$ 3,120
- Global License$ 3,795

Leadership Perspectives from Industry Events
Search
Thought Leadership and Analyst Meet


Our Clients
6WResearch In News
- India Air Conditioner Market Set for Strong Rebound in 2026 After Weather-Led Correction and GST-Driven Recovery: 6Wresearch
- ADAS in India: How Automatic Emergency Braking, Blind Spot Detection & Driver Monitoring are Transforming Road Safety
- Doha a strategic location for EV manufacturing hub: IPA Qatar
- Demand for luxury TVs surging in the GCC, says Samsung
- Empowering Growth: The Thriving Journey of Bangladesh’s Cable Industry
- Demand for luxury TVs surging in the GCC, says Samsung
Latest Reports
- Nicaragua RPG Gaming Market (2026-2032)
- New Zealand RPG Gaming Market (2026-2032)
- Netherlands RPG Gaming Market (2026-2032)
- Nauru RPG Gaming Market (2026-2032)
- Namibia RPG Gaming Market (2026-2032)
- Mozambique RPG Gaming Market (2026-2032)
- Montenegro RPG Gaming Market (2026-2032)
- Mongolia RPG Gaming Market (2026-2032)
- Monaco RPG Gaming Market (2026-2032)
- Micronesia RPG Gaming Market (2026-2032)
Industry Events and Analyst Meet

EV India Expo 2026

HIMTEX 2026

India Refining Summit 2026

India EV Show 2026

EV tech India Expo 2026
Whitepaper
- Middle East & Africa Commercial Security Market Click here to view more.
- Middle East & Africa Fire Safety Systems & Equipment Market Click here to view more.
- GCC Drone Market Click here to view more.
- Middle East Lighting Fixture Market Click here to view more.
- GCC Physical & Perimeter Security Market Click here to view more.