Brazil Hollow Glass Microspheres Market Outlook | Size, Companies, Revenue, Forecast, Value, Industry, Growth, Analysis, Trends, Share & COVID-19 IMPACT
Market Forecast By Type (Glass, Others), By Application (Automotive, Aerospace & Defense, Building & Construction, Paints & Coatings, Electrical & Electronics, Cosmetics & Personal Care, Healthcare) And Competitive Landscape
| Product Code: ETC214694 | Publication Date: May 2022 | Updated Date: Oct 2025 | Product Type: Market Research Report | |
| Publisher: 6Wresearch | Author: Ravi Bhandari | No. of Pages: 60 | No. of Figures: 40 | No. of Tables: 7 |
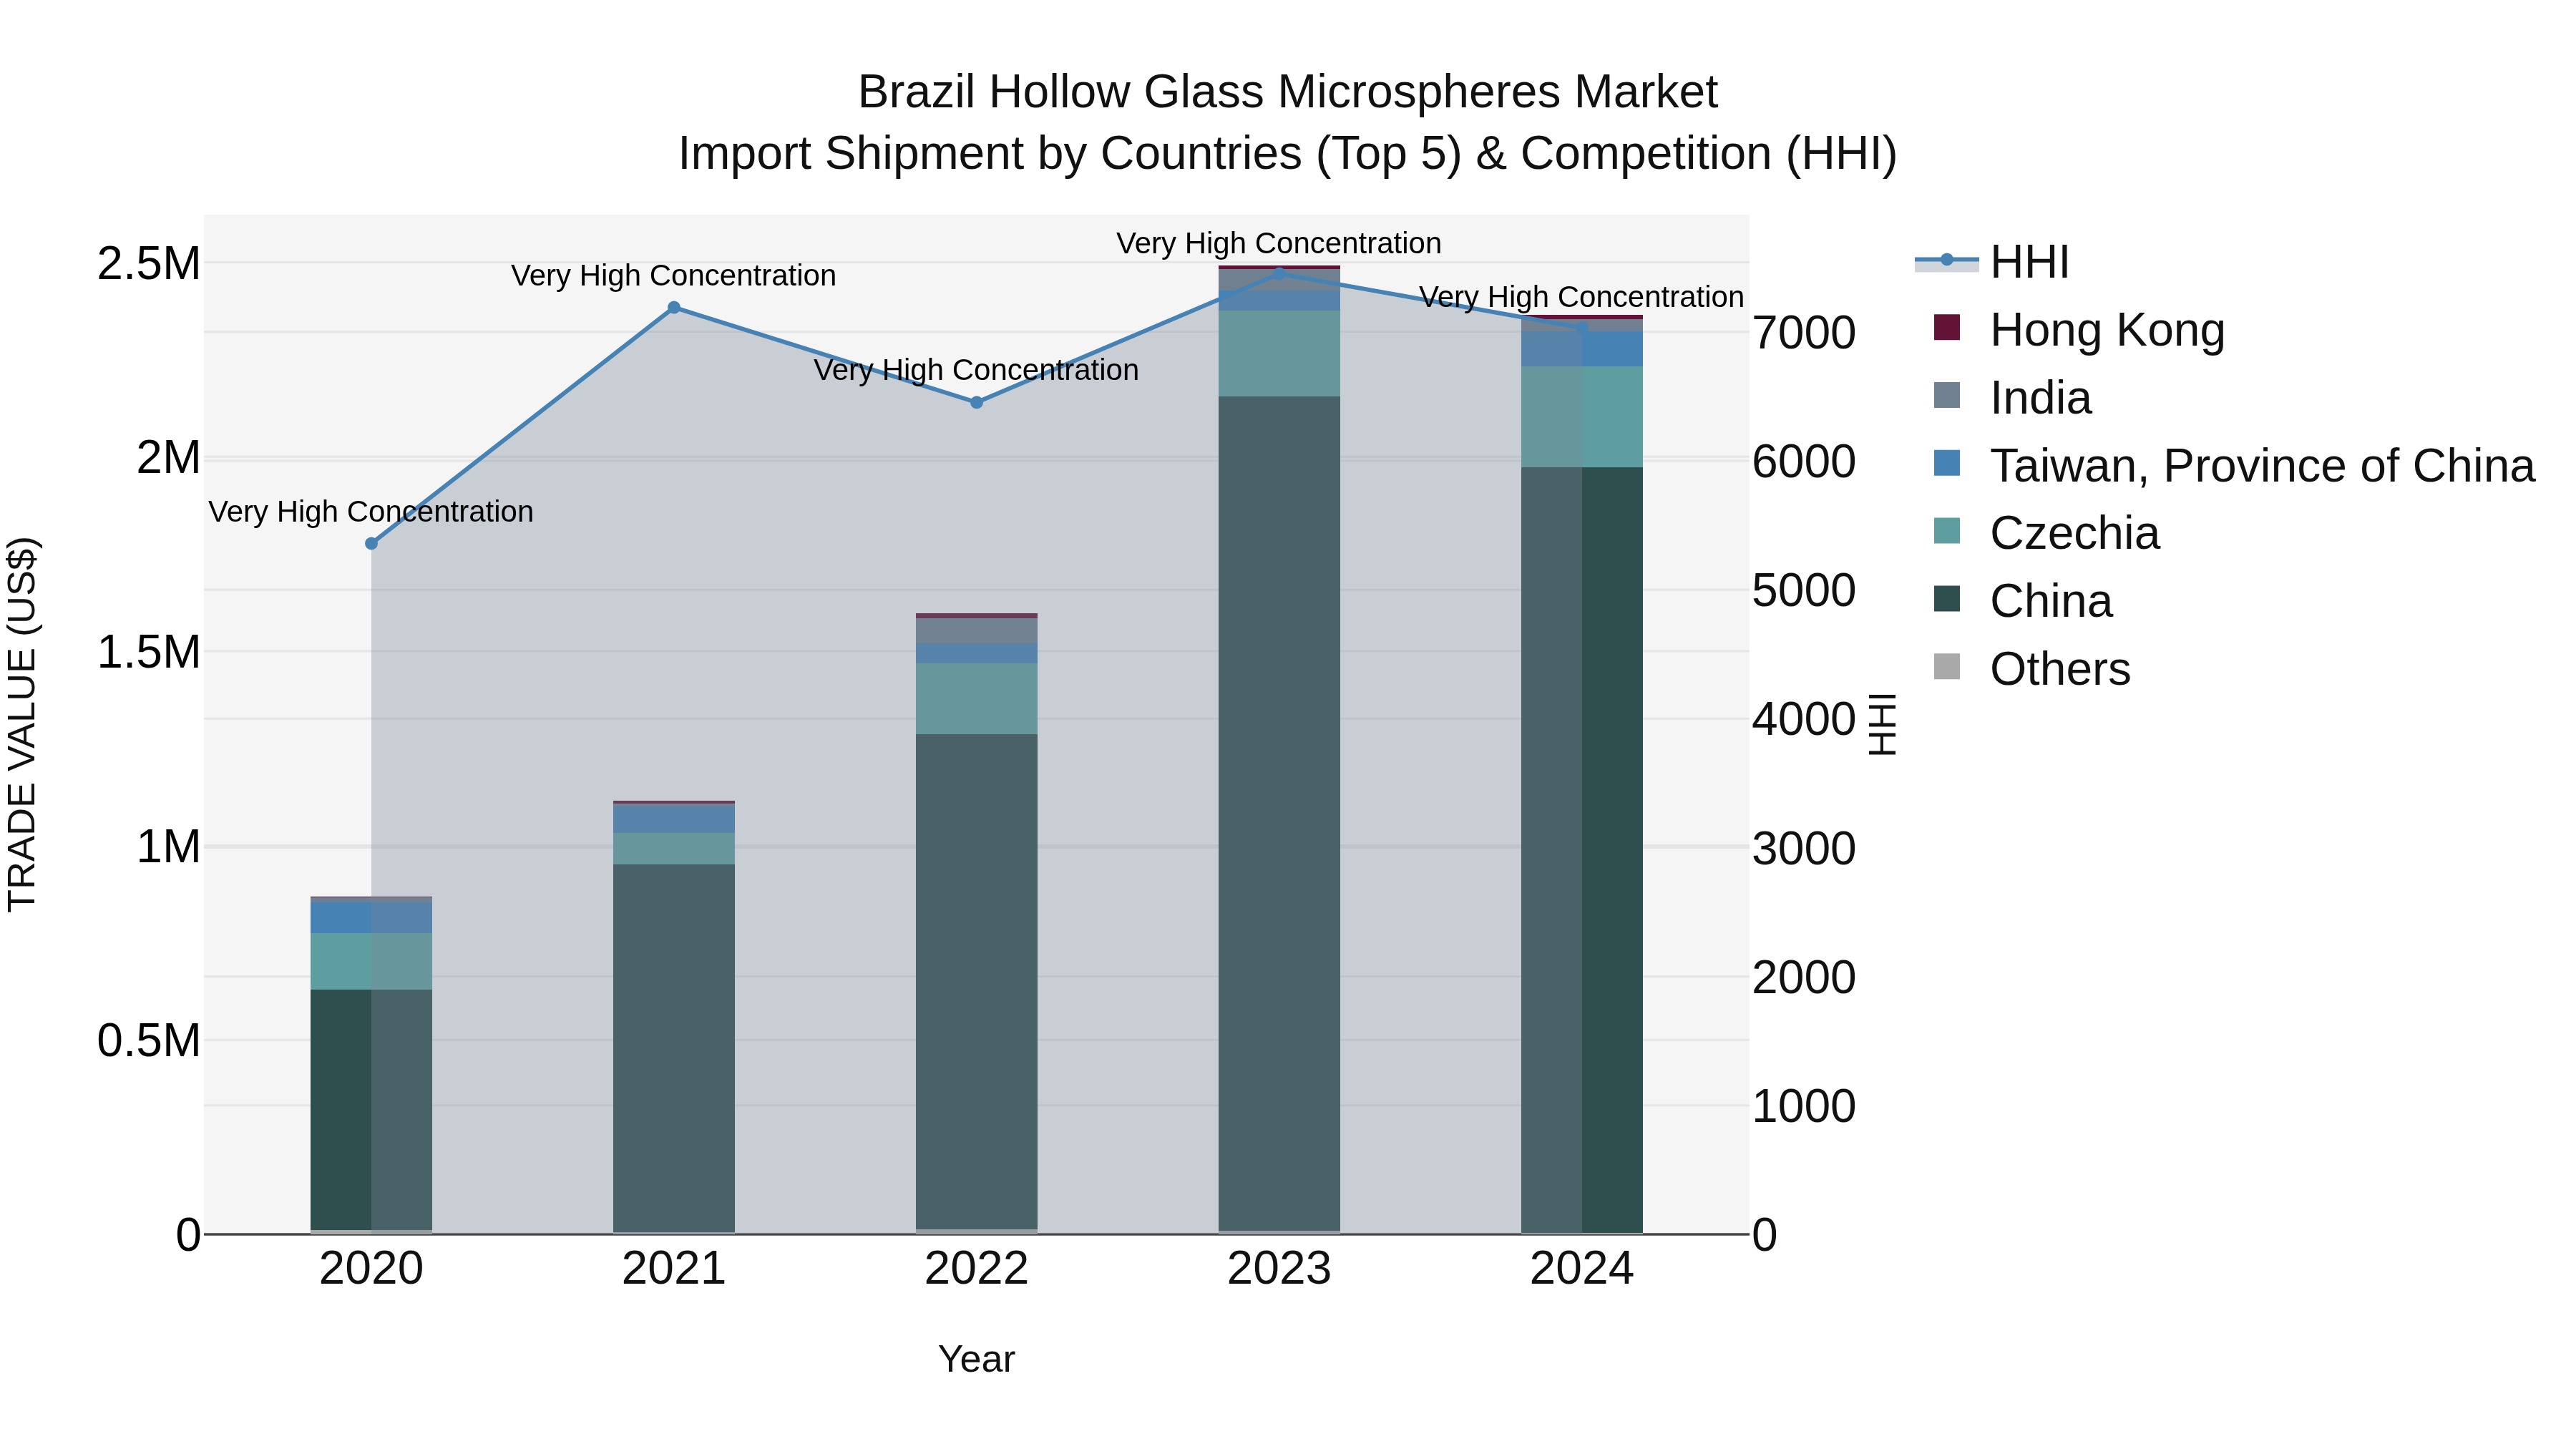
Brazil Hollow Glass Microspheres Market Top 5 Importing Countries and Market Competition (HHI) Analysis
In 2024, Brazil continued to see a significant influx of hollow glass microspheres imports, with top exporting countries including China, Czechia, Taiwan, India, and Hong Kong. Despite a slight decrease in growth rate from the previous year, the high Herfindahl-Hirschman Index (HHI) indicates a concentrated market. The impressive compound annual growth rate (CAGR) of 28.45% from 2020 to 2024 suggests a strong and sustained demand for these products in Brazil, positioning the country as a key player in the global hollow glass microspheres market.
Brazil Hollow Glass Microspheres Market Overview
The Hollow Glass Microspheres market in Brazil is experiencing significant growth, driven by applications in industries such as construction, automotive, and aerospace. These lightweight and versatile materials contribute to enhanced efficiency and sustainability in various sectors.
Drivers of the market
In the Brazil Hollow Glass Microspheres market, the demand is primarily propelled by the expanding applications in industries such as construction, aerospace, and automotive. The lightweight and insulating properties of hollow glass microspheres make them attractive for various uses, driving innovation in materials and construction technologies. Moreover, the increasing focus on energy efficiency and sustainability in these sectors further boosts the adoption of hollow glass microspheres.
Challenges of the market
In the Brazil Hollow Glass Microspheres Market, challenges arise from the limited awareness and understanding of the benefits of these microspheres. Industries may be hesitant to adopt this technology due to perceived higher costs and a lack of standardized manufacturing processes. Regulatory hurdles and the need for extensive research and development further slow down market penetration. Collaboration between industry players and regulatory bodies is crucial to establish guidelines and standards for the widespread acceptance of hollow glass microspheres.
Government Policy of the market
Government policies in Brazil aim to foster innovation and technology in various industries, including the hollow glass microspheres market. Research and development incentives, coupled with quality control measures, contribute to the growth of this sector. Additionally, there are efforts to align production practices with environmental sustainability goals.
Key Highlights of the Report:
- Brazil Hollow Glass Microspheres Market Outlook
- Market Size of Brazil Hollow Glass Microspheres Market, 2024
- Forecast of Brazil Hollow Glass Microspheres Market, 2031
- Historical Data and Forecast of Brazil Hollow Glass Microspheres Revenues & Volume for the Period 2018 - 2031
- Brazil Hollow Glass Microspheres Market Trend Evolution
- Brazil Hollow Glass Microspheres Market Drivers and Challenges
- Brazil Hollow Glass Microspheres Price Trends
- Brazil Hollow Glass Microspheres Porter's Five Forces
- Brazil Hollow Glass Microspheres Industry Life Cycle
- Historical Data and Forecast of Brazil Hollow Glass Microspheres Market Revenues & Volume By Type for the Period 2018 - 2031
- Historical Data and Forecast of Brazil Hollow Glass Microspheres Market Revenues & Volume By Glass for the Period 2018 - 2031
- Historical Data and Forecast of Brazil Hollow Glass Microspheres Market Revenues & Volume By Others for the Period 2018 - 2031
- Historical Data and Forecast of Brazil Hollow Glass Microspheres Market Revenues & Volume By Application for the Period 2018 - 2031
- Historical Data and Forecast of Brazil Hollow Glass Microspheres Market Revenues & Volume By Automotive for the Period 2018 - 2031
- Historical Data and Forecast of Brazil Hollow Glass Microspheres Market Revenues & Volume By Aerospace & Defense for the Period 2018 - 2031
- Historical Data and Forecast of Brazil Hollow Glass Microspheres Market Revenues & Volume By Building & Construction for the Period 2018 - 2031
- Historical Data and Forecast of Brazil Hollow Glass Microspheres Market Revenues & Volume By Paints & Coatings for the Period 2018 - 2031
- Historical Data and Forecast of Brazil Hollow Glass Microspheres Market Revenues & Volume By Electrical & Electronics for the Period 2018 - 2031
- Historical Data and Forecast of Brazil Hollow Glass Microspheres Market Revenues & Volume By Cosmetics & Personal Care for the Period 2018 - 2031
- Historical Data and Forecast of Brazil Hollow Glass Microspheres Market Revenues & Volume By Healthcare for the Period 2018 - 2031
- Brazil Hollow Glass Microspheres Import Export Trade Statistics
- Market Opportunity Assessment By Type
- Market Opportunity Assessment By Application
- Brazil Hollow Glass Microspheres Top Companies Market Share
- Brazil Hollow Glass Microspheres Competitive Benchmarking By Technical and Operational Parameters
- Brazil Hollow Glass Microspheres Company Profiles
- Brazil Hollow Glass Microspheres Key Strategic Recommendations
Frequently Asked Questions About the Market Study (FAQs):
6Wresearch actively monitors the Brazil Hollow Glass Microspheres Market and publishes its comprehensive annual report, highlighting emerging trends, growth drivers, revenue analysis, and forecast outlook. Our insights help businesses to make data-backed strategic decisions with ongoing market dynamics. Our analysts track relevent industries related to the Brazil Hollow Glass Microspheres Market, allowing our clients with actionable intelligence and reliable forecasts tailored to emerging regional needs.
Yes, we provide customisation as per your requirements. To learn more, feel free to contact us on sales@6wresearch.com
1 Executive Summary |
2 Introduction |
2.1 Key Highlights of the Report |
2.2 Report Description |
2.3 Market Scope & Segmentation |
2.4 Research Methodology |
2.5 Assumptions |
3 Brazil Hollow Glass Microspheres Market Overview |
3.1 Brazil Country Macro Economic Indicators |
3.2 Brazil Hollow Glass Microspheres Market Revenues & Volume, 2021 & 2031F |
3.3 Brazil Hollow Glass Microspheres Market - Industry Life Cycle |
3.4 Brazil Hollow Glass Microspheres Market - Porter's Five Forces |
3.5 Brazil Hollow Glass Microspheres Market Revenues & Volume Share, By Type, 2021 & 2031F |
3.6 Brazil Hollow Glass Microspheres Market Revenues & Volume Share, By Application, 2021 & 2031F |
4 Brazil Hollow Glass Microspheres Market Dynamics |
4.1 Impact Analysis |
4.2 Market Drivers |
4.2.1 Increasing demand for lightweight materials in automotive and aerospace industries |
4.2.2 Rising focus on energy efficiency and sustainability in construction sector |
4.2.3 Growing usage of hollow glass microspheres in composites and coatings industry |
4.3 Market Restraints |
4.3.1 High production costs associated with hollow glass microspheres |
4.3.2 Limited availability of raw materials for manufacturing |
4.3.3 Stringent regulations and standards related to product quality and safety |
5 Brazil Hollow Glass Microspheres Market Trends |
6 Brazil Hollow Glass Microspheres Market, By Types |
6.1 Brazil Hollow Glass Microspheres Market, By Type |
6.1.1 Overview and Analysis |
6.1.2 Brazil Hollow Glass Microspheres Market Revenues & Volume, By Type, 2021-2031F |
6.1.3 Brazil Hollow Glass Microspheres Market Revenues & Volume, By Glass, 2021-2031F |
6.1.4 Brazil Hollow Glass Microspheres Market Revenues & Volume, By Others, 2021-2031F |
6.2 Brazil Hollow Glass Microspheres Market, By Application |
6.2.1 Overview and Analysis |
6.2.2 Brazil Hollow Glass Microspheres Market Revenues & Volume, By Automotive, 2021-2031F |
6.2.3 Brazil Hollow Glass Microspheres Market Revenues & Volume, By Aerospace & Defense, 2021-2031F |
6.2.4 Brazil Hollow Glass Microspheres Market Revenues & Volume, By Building & Construction, 2021-2031F |
6.2.5 Brazil Hollow Glass Microspheres Market Revenues & Volume, By Paints & Coatings, 2021-2031F |
6.2.6 Brazil Hollow Glass Microspheres Market Revenues & Volume, By Electrical & Electronics, 2021-2031F |
6.2.7 Brazil Hollow Glass Microspheres Market Revenues & Volume, By Cosmetics & Personal Care, 2021-2031F |
7 Brazil Hollow Glass Microspheres Market Import-Export Trade Statistics |
7.1 Brazil Hollow Glass Microspheres Market Export to Major Countries |
7.2 Brazil Hollow Glass Microspheres Market Imports from Major Countries |
8 Brazil Hollow Glass Microspheres Market Key Performance Indicators |
8.1 Research and development investment in hollow glass microspheres technology |
8.2 Number of patents filed for innovative applications of hollow glass microspheres |
8.3 Adoption rate of hollow glass microspheres in new industries |
8.4 Environmental impact assessment of hollow glass microspheres production and usage |
8.5 Supplier diversity and supply chain resilience for raw materials used in manufacturing |
9 Brazil Hollow Glass Microspheres Market - Opportunity Assessment |
9.1 Brazil Hollow Glass Microspheres Market Opportunity Assessment, By Type, 2021 & 2031F |
9.2 Brazil Hollow Glass Microspheres Market Opportunity Assessment, By Application, 2021 & 2031F |
10 Brazil Hollow Glass Microspheres Market - Competitive Landscape |
10.1 Brazil Hollow Glass Microspheres Market Revenue Share, By Companies, 2024 |
10.2 Brazil Hollow Glass Microspheres Market Competitive Benchmarking, By Operating and Technical Parameters |
11 Company Profiles |
12 Recommendations |
13 Disclaimer |
Global Go To Market Strategy - 2030
Export potential enables firms to identify high-growth global markets with greater confidence by combining advanced trade intelligence with a structured quantitative methodology. The framework analyzes emerging demand trends and country-level import patterns while integrating macroeconomic and trade datasets such as GDP and population forecasts, bilateral import–export flows, tariff structures, elasticity differentials between developed and developing economies, geographic distance, and import demand projections. Using weighted trade values from 2020–2024 as the base period to project country-to-country export potential for 2030, these inputs are operationalized through calculated drivers such as gravity model parameters, tariff impact factors, and projected GDP per-capita growth. Through an analysis of hidden potentials, demand hotspots, and market conditions that are most favorable to success, this method enables firms to focus on target countries, maximize returns, and global expansion with data, backed by accuracy.
By factoring in the projected importer demand gap that is currently unmet and could be potential opportunity, it identifies the potential for the Exporter (Country) among 190 countries, against the general trade analysis, which identifies the biggest importer or exporter.
To discover high-growth global markets and optimize your business strategy:
Click Here
Pricing
- Single User License$ 1,995
- Department License$ 2,400
- Site License$ 3,120
- Global License$ 3,795

Leadership Perspectives from Industry Events
Search
Thought Leadership and Analyst Meet


Our Clients
6WResearch In News
- India Air Conditioner Market Set for Strong Rebound in 2026 After Weather-Led Correction and GST-Driven Recovery: 6Wresearch
- ADAS in India: How Automatic Emergency Braking, Blind Spot Detection & Driver Monitoring are Transforming Road Safety
- Doha a strategic location for EV manufacturing hub: IPA Qatar
- Demand for luxury TVs surging in the GCC, says Samsung
- Empowering Growth: The Thriving Journey of Bangladesh’s Cable Industry
- Demand for luxury TVs surging in the GCC, says Samsung
Latest Reports
- Nicaragua RPG Gaming Market (2026-2032)
- New Zealand RPG Gaming Market (2026-2032)
- Netherlands RPG Gaming Market (2026-2032)
- Nauru RPG Gaming Market (2026-2032)
- Namibia RPG Gaming Market (2026-2032)
- Mozambique RPG Gaming Market (2026-2032)
- Montenegro RPG Gaming Market (2026-2032)
- Mongolia RPG Gaming Market (2026-2032)
- Monaco RPG Gaming Market (2026-2032)
- Micronesia RPG Gaming Market (2026-2032)
Industry Events and Analyst Meet

EV India Expo 2026

HIMTEX 2026

India Refining Summit 2026

India EV Show 2026

EV tech India Expo 2026
Whitepaper
- Middle East & Africa Commercial Security Market Click here to view more.
- Middle East & Africa Fire Safety Systems & Equipment Market Click here to view more.
- GCC Drone Market Click here to view more.
- Middle East Lighting Fixture Market Click here to view more.
- GCC Physical & Perimeter Security Market Click here to view more.