Brazil Nonferrous Metal Products Market (2026-2032) | Outlook, Size, Trends, Industry, Forecast, Revenue, Value, Analysis, Share, Companies & Growth
Market Forecast By Type (Smelting and Refining, Rolling, Drawing, Extruding, Alloying, Other), By Applications (Automotive, Electronic Power, Construction, Others) And Competitive Landscape
| Product Code: ETC033802 | Publication Date: Oct 2020 | Updated Date: Jun 2026 | Product Type: Report | |
| Publisher: 6Wresearch | Author: Ravi Bhandari | No. of Pages: 70 | No. of Figures: 35 | No. of Tables: 5 |
Brazil Nonferrous Metal Products Market Summary
The brazil nonferrous metal products market was estimated at USD 441 Million in 2025 and is projected to reach USD 526 Million by 2032, growing at a CAGR of 3.0% from 2026 to 2032.
Brazil Nonferrous Metal Products Market Year-wise Growth Rate and Key Drivers
This graph highlights how the Brazil Nonferrous Metal Products Market has steadily grown over the past five years, supported by major growth factors.
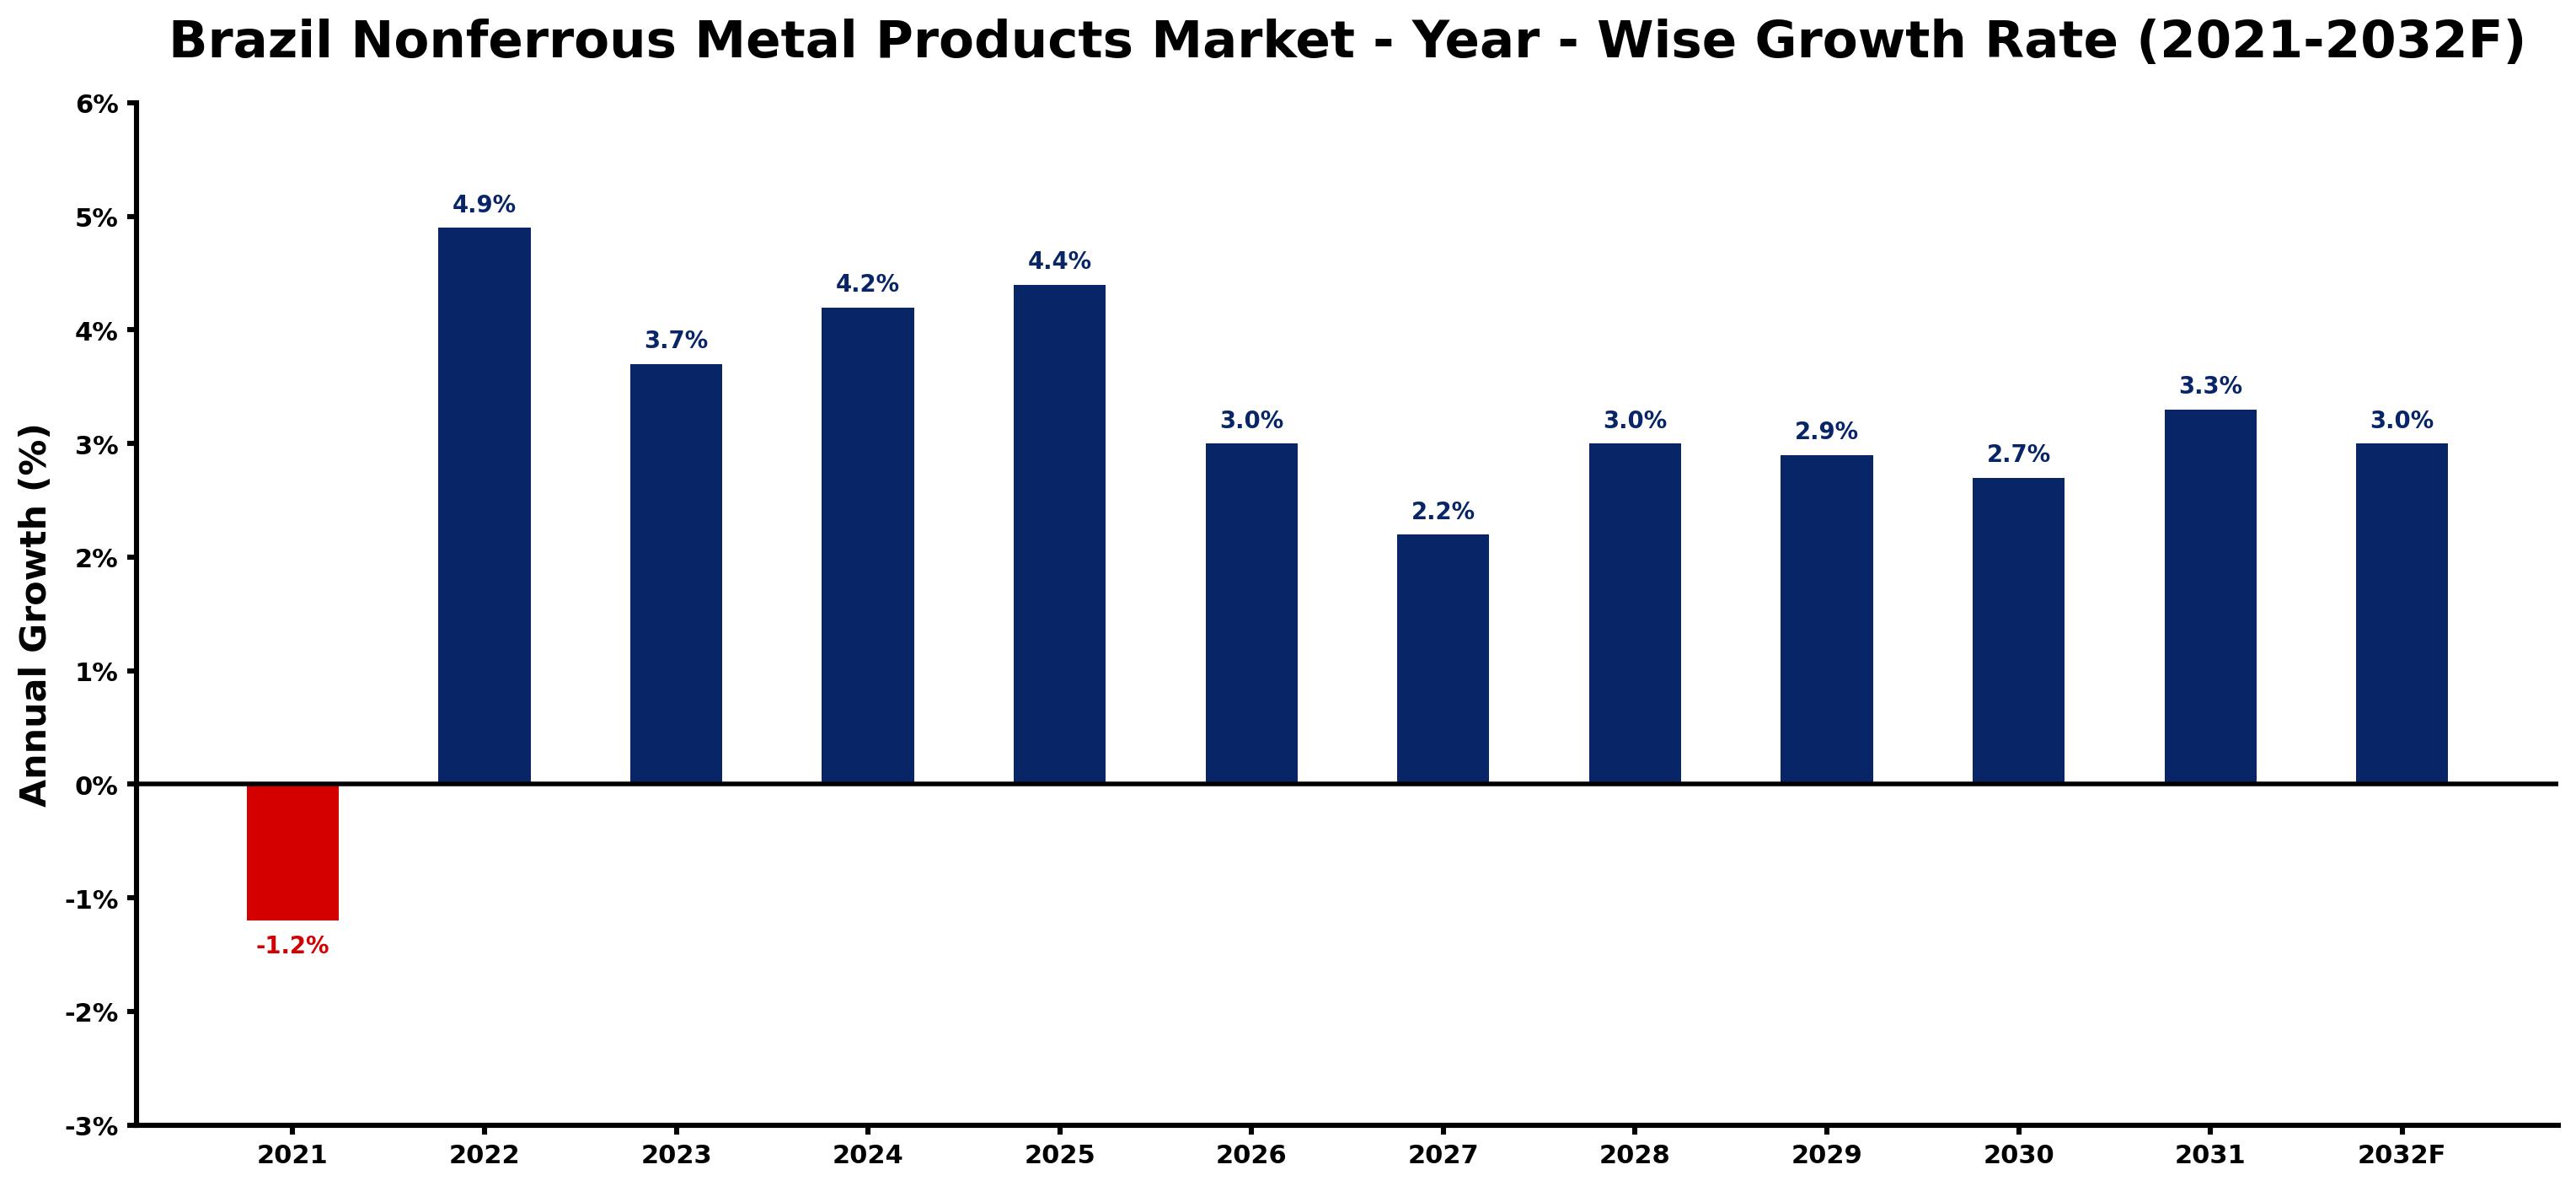
The table below presents the year wise growth rates along with the key drivers influencing the market
| Year | Growth Rate | Major Drivers |
| 2021 | -1.2% | Supply chain disruptions hindered manufacturing capabilities, leading to decreased output and diminished market availability. |
| 2022 | 4.9% | Infrastructure projects gained momentum, showcasing a need for copper and aluminum products. |
| 2023 | 3.7% | Emerging technology sectors increased consumption of specialized nonferrous metal applications. |
| 2024 | 4.2% | Brazil's focus on sustainable practices encouraged recycling of nonferrous metals in manufacturing. |
| 2025 | 4.4% | Urbanization trends highlighted the necessity for aluminum in residential and commercial construction. |
| 2026 | 3.0% | Brazil's automotive sector shifted towards electric vehicles, boosting demand for lightweight materials. |
| 2027 | 2.2% | Investment in renewable energy projects created opportunities for copper in solar applications. |
| 2028 | 3.0% | Evolving construction standards necessitated higher-quality nonferrous metal products in compliance. |
| 2029 | 2.9% | Technological innovation in metal processing improved efficiency, reducing costs for manufacturers. |
| 2030 | 2.7% | Emerging markets within Brazil fueled demand for affordable, durable nonferrous metal solutions. |
| 2031 | 3.3% | A focus on localizing supply chains strengthened the domestic nonferrous metal production landscape. |
| 2032 | 3.0% | Increased export opportunities positioned Brazil as a key player in the global market. |
Note - Market size estimations and growth projections presented in this report are based on 6Wresearch's advanced forecasting approach, validated with industry datasets as of June 2026.
Brazil Nonferrous Metal Products Market Synopsis
The Brazil Nonferrous Metal Products Market is projected to reach 3.0% and witness significant growth during the forecast period (2026-2032). This market includes essential metals such as aluminum, copper, and zinc, which are vital for various applications across several industries including aerospace, automotive, and construction. As these sectors expand and evolve, the demand for nonferrous metals is anticipated to increase, driven by their lightweight properties and corrosion resistance.
Brazil Nonferrous Metal Products Market Growth Drivers
Various factors contribute to the robust growth of the Brazil Nonferrous Metal Products Market. Key drivers include:
- Technological advancements in manufacturing processes are enabling the production of nonferrous metals with improved properties, thereby enhancing their applications in various industries.
- The construction sector in Brazil is undergoing a transformation with increased investments in infrastructure projects, which directly translates to a rising demand for aluminum and zinc products.
- The automotive industry is increasingly incorporating lightweight materials to improve fuel efficiency and reduce emissions, making nonferrous metals indispensable.
- Brazil's strategic push towards sustainable materials fosters an environment where nonferrous metals, known for their recyclability, gain traction among environmentally-conscious enterprises.
- The global trend towards electric vehicles and renewable energy technologies is creating new markets for copper and aluminum, further bolstering growth in the nonferrous metal sector.
Brazil Nonferrous Metal Products Market Challenges and Restraints
Despite several growth prospects, the Brazil Nonferrous Metal Products Market faces notable challenges that could hinder its expansion. These include:
- Price volatility of nonferrous metals presents challenges for manufacturers, affecting their cost structures and profit margins in an increasingly competitive landscape.
- The evolving landscape of manufacturing processes necessitates continuous adaptation, which can be resource-intensive and hinder operational efficiency.
- Environmental regulations regarding metal production are becoming more stringent, requiring companies to invest in cleaner technologies and processes.
- Global economic uncertainties, such as fluctuating demand from key markets, could lead to instability in production and sales forecasts.
- Supply chain disruptions, whether from geopolitical factors or natural events, can significantly impact the availability and pricing of nonferrous metal products.
Brazil Nonferrous Metal Products Market Government Investment and Initiatives
The Brazilian government plays a critical role in shaping the nonferrous metal products market through various initiatives aimed at fostering industrial growth. Key policies include:
- Supportive regulations that promote technological advancements in metal production, ensuring that the industry remains competitive on a global scale.
- Investment incentives aimed at attracting foreign direct investment into the nonferrous sector, subsequently boosting local production capabilities and job creation.
- Development plans focused on infrastructure enhancement, which directly impacts the construction industry's demand for nonferrous metal products.
- Public spending initiatives targeting the modernization of manufacturing facilities to improve efficiency and reduce environmental impacts.
- Policies that encourage research and development in sustainable practices within the metal production sector, aligning with global sustainability goals.
Brazil Nonferrous Metal Products Market Latest Developments (May 2025 - June 2026)
In the period from May 2025 to June 2026, the Brazil Nonferrous Metal Products Market has witnessed several significant developments that indicate a shift in industry dynamics. Recent trends include an increased focus on sustainable production methods, aligning with global environmental standards. Concurrently, investments in infrastructure projects have surged, driven by government initiatives aimed at economic recovery, thereby propelling the demand for nonferrous metals.
Technological innovations in metal processing have also emerged, enabling manufacturers to enhance product quality and reduce waste. Furthermore, the Brazilian market is becoming more integrated into global supply chains, with an uptick in export activities, particularly regarding aluminum and copper products. These developments suggest a positive outlook for the Brazil Nonferrous Metal Products Market in the coming years.
Brazil Nonferrous Metal Products Market - Key Attractiveness of the Report
- 10 Years of Market Numbers
- Historical Data Starting from 2022 to 2025
- Base Year: 2025
- Forecast Data until 2032
- Key Performance Indicators Impacting the Market
- Major Upcoming Developments and Projects
Key Highlights of the Report:
- Brazil Nonferrous Metal Products Market Outlook
- Market Size of Brazil Nonferrous Metal Products Market, 2025
- Forecast of Brazil Nonferrous Metal Products Market, 2032
- Historical Data and Forecast of Brazil Nonferrous Metal Products Revenues & Volume for the Period 2022-2032F
- Brazil Nonferrous Metal Products Market Trend Evolution
- Brazil Nonferrous Metal Products Market Drivers and Challenges
- Brazil Nonferrous Metal Products Price Trends
- Brazil Nonferrous Metal Products Porter's Five Forces
- Brazil Nonferrous Metal Products Industry Life Cycle
- Historical Data and Forecast of Brazil Nonferrous Metal Products Market Revenues & Volume By Type for the Period 2022-2032F
- Historical Data and Forecast of Brazil Nonferrous Metal Products Market Revenues & Volume By Smelting and Refining for the Period 2022-2032F
- Historical Data and Forecast of Brazil Nonferrous Metal Products Market Revenues & Volume By Rolling for the Period 2022-2032F
- Historical Data and Forecast of Brazil Nonferrous Metal Products Market Revenues & Volume By Drawing for the Period 2022-2032F
- Historical Data and Forecast of Brazil Nonferrous Metal Products Market Revenues & Volume By Extruding for the Period 2022-2032F
- Historical Data and Forecast of Brazil Nonferrous Metal Products Market Revenues & Volume By Alloying for the Period 2022-2032F
- Historical Data and Forecast of Brazil Nonferrous Metal Products Market Revenues & Volume By Other for the Period 2022-2032F
- Historical Data and Forecast of Brazil Nonferrous Metal Products Market Revenues & Volume By Applications for the Period 2022-2032F
- Historical Data and Forecast of Brazil Nonferrous Metal Products Market Revenues & Volume By Automotive for the Period 2022-2032F
- Historical Data and Forecast of Brazil Nonferrous Metal Products Market Revenues & Volume By Electronic Power for the Period 2022-2032F
- Historical Data and Forecast of Brazil Nonferrous Metal Products Market Revenues & Volume By Construction for the Period 2022-2032F
- Historical Data and Forecast of Brazil Nonferrous Metal Products Market Revenues & Volume By Others for the Period 2022-2032F
- Brazil Nonferrous Metal Products Import Export Trade Statistics
- Market Opportunity Assessment By Type
- Market Opportunity Assessment By Applications
- Brazil Nonferrous Metal Products Top Companies Market Share
- Brazil Nonferrous Metal Products Competitive Benchmarking By Technical and Operational Parameters
- Brazil Nonferrous Metal Products Company Profiles
- Brazil Nonferrous Metal Products Key Strategic Recommendations
Frequently Asked Questions About the Market Study (FAQs):
The primary nonferrous metals include aluminum, copper, and zinc, which serve critical roles in various sectors.
Key industries include aerospace, automotive, and construction, all of which require lightweight and durable materials.
The government implements policies aimed at technological advancement, infrastructure development, and attracting foreign investment, which collectively enhance market competitiveness.
Major challenges include price volatility, environmental regulations, and the need for continuous adaptation to new manufacturing techniques.
6Wresearch actively monitors the Brazil Nonferrous Metal Products Market and publishes its comprehensive annual report, highlighting emerging trends, growth drivers, revenue analysis, and forecast outlook. Our insights help businesses to make data-backed strategic decisions with ongoing market dynamics. Our analysts track relevent industries related to the Brazil Nonferrous Metal Products Market, allowing our clients with actionable intelligence and reliable forecasts tailored to emerging regional needs.
Yes, we provide customisation as per your requirements. To learn more, feel free to contact us on sales@6wresearch.com
1 Executive Summary |
2 Introduction |
2.1 Key Highlights of the Report |
2.2 Report Description |
2.3 Market Scope & Segmentation |
2.4 Research Methodology |
2.5 Assumptions |
3 Brazil Nonferrous Metal Products Market Overview |
3.1 Brazil Country Macro Economic Indicators |
3.2 Brazil Nonferrous Metal Products Market Revenues & Volume, 2022 & 2032F |
3.3 Brazil Nonferrous Metal Products Market - Industry Life Cycle |
3.4 Brazil Nonferrous Metal Products Market - Porter's Five Forces |
3.5 Brazil Nonferrous Metal Products Market Revenues & Volume Share, By Type, 2022 & 2032F |
3.6 Brazil Nonferrous Metal Products Market Revenues & Volume Share, By Applications, 2022 & 2032F |
4 Brazil Nonferrous Metal Products Market Dynamics |
4.1 Impact Analysis |
4.2 Market Drivers |
4.2.1 Increasing demand from industries such as automotive and construction |
4.2.2 Growth in infrastructure projects in Brazil |
4.2.3 Technological advancements in nonferrous metal products |
4.3 Market Restraints |
4.3.1 Volatility in metal prices |
4.3.2 Regulatory challenges in the mining sector |
4.3.3 Impact of global economic conditions on metal prices |
5 Brazil Nonferrous Metal Products Market Trends |
6 Brazil Nonferrous Metal Products Market, By Types |
6.1 Brazil Nonferrous Metal Products Market, By Type |
6.1.1 Overview and Analysis |
6.1.2 Brazil Nonferrous Metal Products Market Revenues & Volume, By Type, 2022-2032F |
6.1.3 Brazil Nonferrous Metal Products Market Revenues & Volume, By Smelting and Refining, 2022-2032F |
6.1.4 Brazil Nonferrous Metal Products Market Revenues & Volume, By Rolling, 2022-2032F |
6.1.5 Brazil Nonferrous Metal Products Market Revenues & Volume, By Drawing, 2022-2032F |
6.1.6 Brazil Nonferrous Metal Products Market Revenues & Volume, By Extruding, 2022-2032F |
6.1.7 Brazil Nonferrous Metal Products Market Revenues & Volume, By Alloying, 2022-2032F |
6.1.8 Brazil Nonferrous Metal Products Market Revenues & Volume, By Other, 2022-2032F |
6.2 Brazil Nonferrous Metal Products Market, By Applications |
6.2.1 Overview and Analysis |
6.2.2 Brazil Nonferrous Metal Products Market Revenues & Volume, By Automotive, 2022-2032F |
6.2.3 Brazil Nonferrous Metal Products Market Revenues & Volume, By Electronic Power, 2022-2032F |
6.2.4 Brazil Nonferrous Metal Products Market Revenues & Volume, By Construction, 2022-2032F |
6.2.5 Brazil Nonferrous Metal Products Market Revenues & Volume, By Others, 2022-2032F |
7 Brazil Nonferrous Metal Products Market Import-Export Trade Statistics |
7.1 Brazil Nonferrous Metal Products Market Export to Major Countries |
7.2 Brazil Nonferrous Metal Products Market Imports from Major Countries |
8 Brazil Nonferrous Metal Products Market Key Performance Indicators |
8.1 Average selling price of nonferrous metal products |
8.2 Production capacity utilization rate |
8.3 Percentage of revenue from new product innovations |
8.4 Export volume of nonferrous metal products |
8.5 Percentage of market share held by Brazilian companies in the global nonferrous metal products market |
9 Brazil Nonferrous Metal Products Market - Opportunity Assessment |
9.1 Brazil Nonferrous Metal Products Market Opportunity Assessment, By Type, 2022 & 2032F |
9.2 Brazil Nonferrous Metal Products Market Opportunity Assessment, By Applications, 2022 & 2032F |
10 Brazil Nonferrous Metal Products Market - Competitive Landscape |
10.1 Brazil Nonferrous Metal Products Market Revenue Share, By Companies, 2025 |
10.2 Brazil Nonferrous Metal Products Market Competitive Benchmarking, By Operating and Technical Parameters |
11 Company Profiles |
12 Recommendations |
13 Disclaimer |
Global Go To Market Strategy - 2030
Export potential enables firms to identify high-growth global markets with greater confidence by combining advanced trade intelligence with a structured quantitative methodology. The framework analyzes emerging demand trends and country-level import patterns while integrating macroeconomic and trade datasets such as GDP and population forecasts, bilateral import–export flows, tariff structures, elasticity differentials between developed and developing economies, geographic distance, and import demand projections. Using weighted trade values from 2020–2024 as the base period to project country-to-country export potential for 2030, these inputs are operationalized through calculated drivers such as gravity model parameters, tariff impact factors, and projected GDP per-capita growth. Through an analysis of hidden potentials, demand hotspots, and market conditions that are most favorable to success, this method enables firms to focus on target countries, maximize returns, and global expansion with data, backed by accuracy.
By factoring in the projected importer demand gap that is currently unmet and could be potential opportunity, it identifies the potential for the Exporter (Country) among 190 countries, against the general trade analysis, which identifies the biggest importer or exporter.
To discover high-growth global markets and optimize your business strategy:
Click Here
Pricing
- Single User License$ 1,995
- Department License$ 2,400
- Site License$ 3,120
- Global License$ 3,795

Leadership Perspectives from Industry Events
Search
Thought Leadership and Analyst Meet


Our Clients
6WResearch In News
- India Air Conditioner Market Set for Strong Rebound in 2026 After Weather-Led Correction and GST-Driven Recovery: 6Wresearch
- ADAS in India: How Automatic Emergency Braking, Blind Spot Detection & Driver Monitoring are Transforming Road Safety
- Doha a strategic location for EV manufacturing hub: IPA Qatar
- Demand for luxury TVs surging in the GCC, says Samsung
- Empowering Growth: The Thriving Journey of Bangladesh’s Cable Industry
- Demand for luxury TVs surging in the GCC, says Samsung
Latest Reports
- Nicaragua RPG Gaming Market (2026-2032)
- New Zealand RPG Gaming Market (2026-2032)
- Netherlands RPG Gaming Market (2026-2032)
- Nauru RPG Gaming Market (2026-2032)
- Namibia RPG Gaming Market (2026-2032)
- Mozambique RPG Gaming Market (2026-2032)
- Montenegro RPG Gaming Market (2026-2032)
- Mongolia RPG Gaming Market (2026-2032)
- Monaco RPG Gaming Market (2026-2032)
- Micronesia RPG Gaming Market (2026-2032)
Industry Events and Analyst Meet

EV India Expo 2026

HIMTEX 2026

India Refining Summit 2026

India EV Show 2026

EV tech India Expo 2026
Whitepaper
- Middle East & Africa Commercial Security Market Click here to view more.
- Middle East & Africa Fire Safety Systems & Equipment Market Click here to view more.
- GCC Drone Market Click here to view more.
- Middle East Lighting Fixture Market Click here to view more.
- GCC Physical & Perimeter Security Market Click here to view more.